

Revenue, 2025
$37.8Bn
Forecast, 2035
$874.0Bn
CAGR, 2025-2035
36.9%
Report Coverage
Global
Market Size and Forecast
2025
$37.8Bn
2035
$874.0Bn
CAGR
36.9%
The Global AI Toolkit Market was valued at USD 37.8 billion in 2025 and is projected to reach USD 874.0 billion by 2035, growing at a CAGR of 36.9%. The market growth can be attributed to the rising use of AI development platforms, cloud-based model deployment, machine learning automation, generative AI tools, and enterprise demand for faster data-driven decision-making.
North America led the market with a 38.7% share in 2025, while the U.S. market reached USD 10.2 billion and is expected to grow at a 36.4% CAGR, supported by strong enterprise AI adoption, rising cloud-based model development, growing use of generative AI tools, higher spending on AI software infrastructure, and rapid integration of AI toolkits across IT, healthcare, BFSI, retail, and manufacturing applications.
Top Market Takeaways
Platforms led the AI toolkit market with 59.5% share, supported by rising demand for model development, training, deployment, and AI workflow management tools.
Cloud deployment accounted for 72.6% share, driven by easier scalability, faster access to AI infrastructure, and lower upfront technology costs.
Machine learning led the application segment with 39.7% share, supported by strong use in predictive analytics, automation, personalization, and business decision-making.
Large enterprises held 65.8% share, driven by higher AI budgets, advanced data infrastructure, and wider adoption across business functions.
North America accounted for 38.7% share of the AI toolkit market, supported by strong AI investment, cloud adoption, and enterprise technology spending.
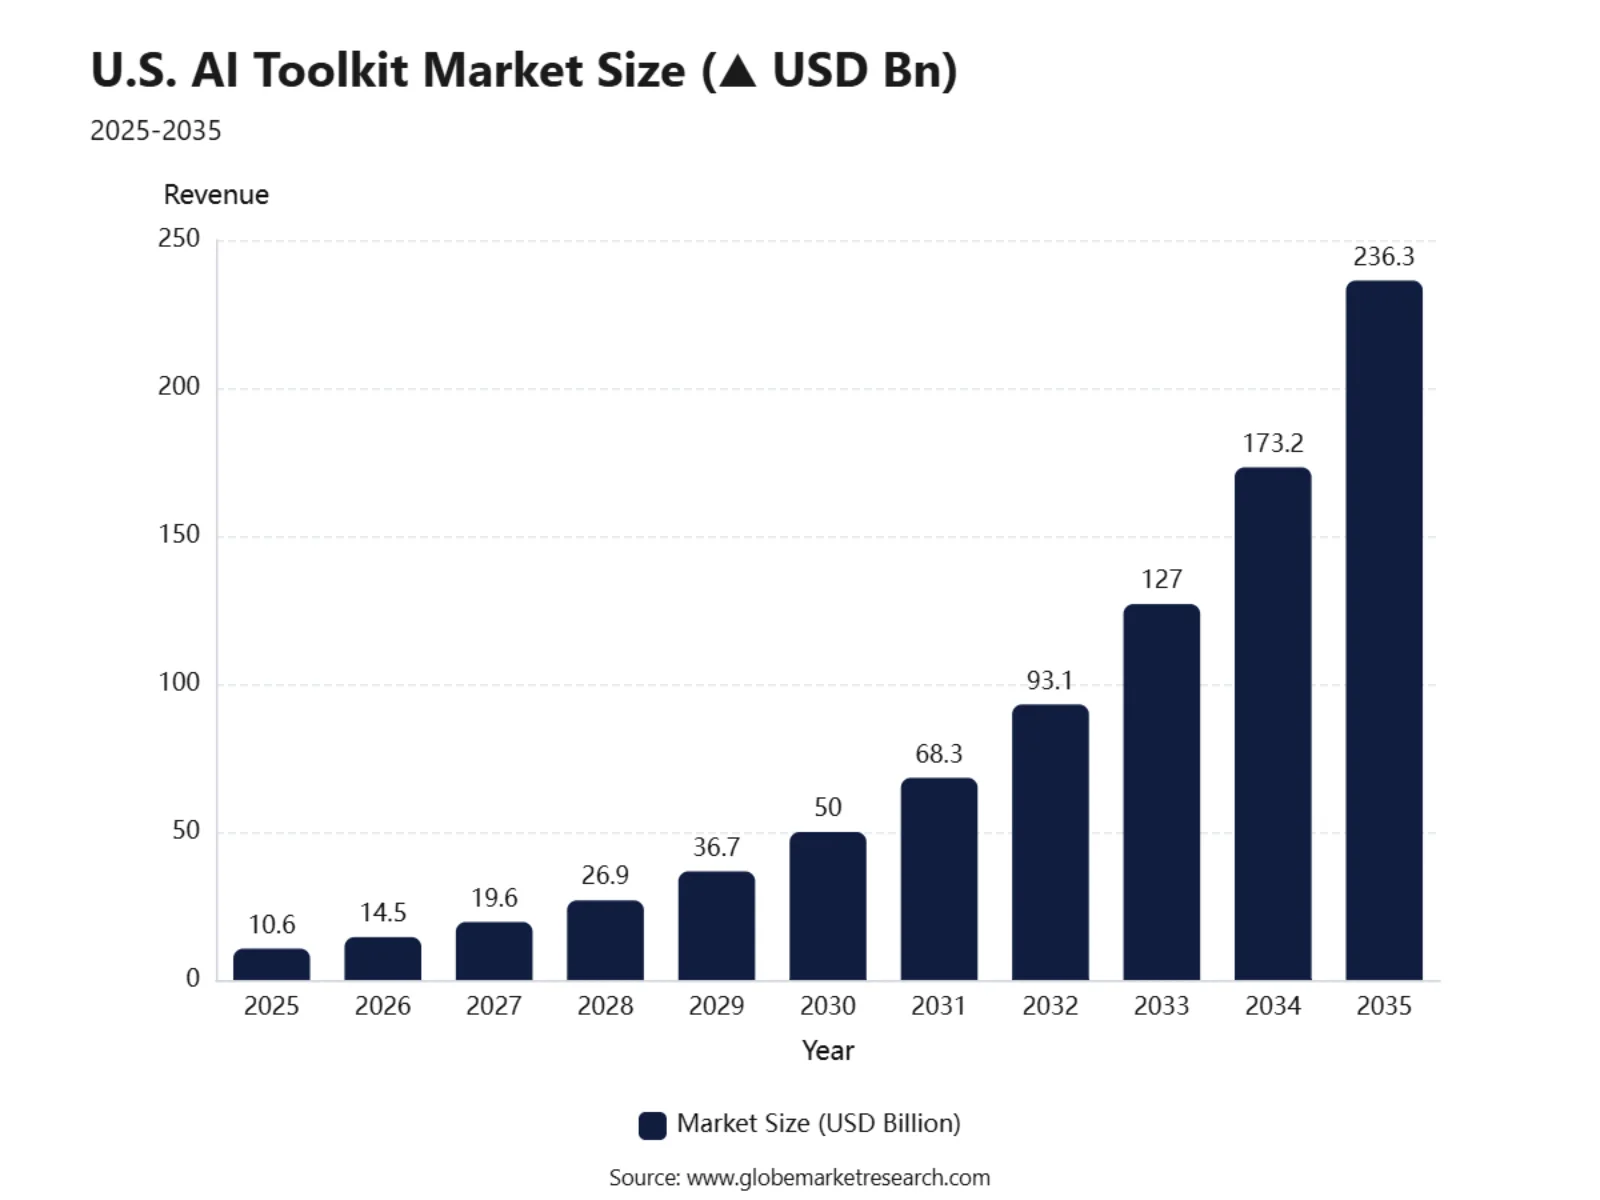
The U.S. AI toolkit market was valued at USD 10.6 billion and is projected to grow at a CAGR of 36.4%.
Market Overview
The market is expanding as AI is moving from experimental use to daily business operations. Enterprises are adopting AI toolkits for software development, customer support, analytics, content generation, cybersecurity, workflow automation, and knowledge management. In 2025, 84% of surveyed developers said they were using or planning to use AI tools in their development process, showing strong demand for toolkits that improve coding, testing, documentation, and productivity.
The growth of the AI Toolkit Market can be attributed to the rising need for faster software development, automation, and data-driven decision-making. Companies are using AI toolkits to reduce repetitive work, improve model development speed, and support teams that need scalable AI features across departments. Enterprise AI adoption has also strengthened as worker access to AI increased by 50% in 2025, while 66% of organizations reported productivity and efficiency gains from enterprise AI use.
Enterprise demand is also rising because organizations want secure, governed, and integrated AI systems instead of scattered AI experiments. AI toolkits are being used to connect large language models with company data, internal applications, cloud systems, analytics platforms, and customer-facing tools. This demand is further supported by GitHub’s 2025 data, which reported that more than 1.1 million public repositories used an LLM SDK, with 693,867 of those projects created in the prior 12 months.
AI Toolkit Statistics
Based on data from Stack Overflow Annual Developer Survey, 84% of developers were using or planning to use AI tools in their development process in 2025, up from 76% in 2024.
51% of developers said they use AI tools every day or several times a week in 2025.
ChatGPT was used by 82% of developers who reported using out-of-the-box AI agents, copilots, or assistants, while GitHub Copilot was used by 68%.
85% of developers regularly used AI tools for coding and development in 2025, according to JetBrains’ developer ecosystem findings.
62% of developers relied on at least one AI coding assistant, agent, or AI code editor in 2025.
GitHub Copilot crossed 20 million all-time users by July 2025
OpenAI reported that 4 million developers had built with OpenAI by DevDay 2025.
Segment Highlights
By Component: Platforms
Platforms accounted for the leading share of the AI Toolkit Market with 59.5%, supported by rising enterprise demand for integrated model development, deployment, monitoring, and governance tools. In 2026, businesses are giving higher priority to platforms that can manage the full AI lifecycle, from data preparation to model testing and production control. This trend is also supported by the strong rise in global IT spending, which is expected to reach USD 6.15 trillion in 2026.
The growth of the platforms segment can be attributed to the need for scalable, secure, and easy-to-integrate AI systems across business functions. Enterprises are using AI platforms for automation, analytics, customer support, software development, cybersecurity, and decision support. In 2026, several large companies are moving more AI experiments into production, which is increasing demand for reliable AI platform infrastructure.
Component | Market Share |
|---|---|
Platforms | 59.5% |
Tools | 25.8% |
Services | 14.7% |
By Deployment Mode: Cloud
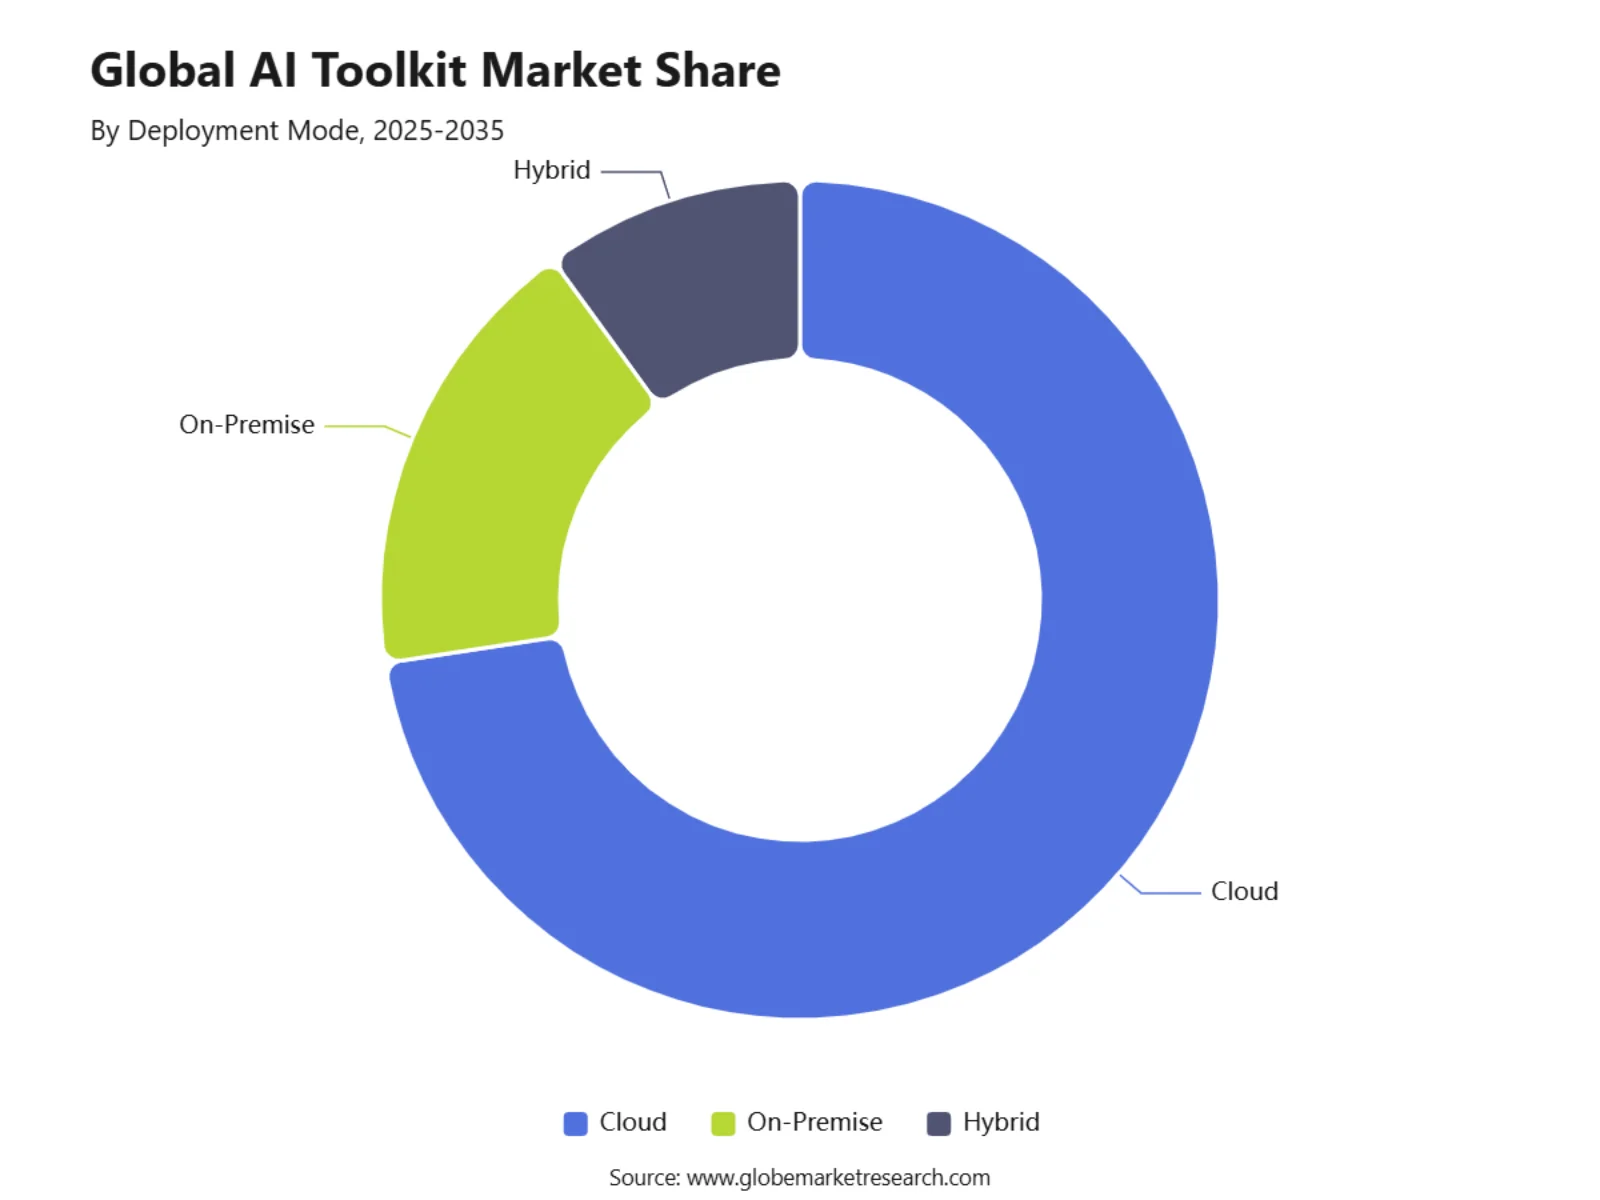
Cloud deployment led the AI Toolkit Market with a 72.6% share, driven by the need for flexible computing power, faster model deployment, and lower upfront infrastructure costs. AI toolkits require strong processing capacity, storage, and integration with enterprise data systems, which makes cloud-based deployment highly suitable. In 2026, cloud adoption is being strengthened by rapid growth in AI workloads, especially for generative AI, machine learning, and AI agents.
Deployment Mode | Market Share |
|---|---|
Cloud | 72.6% |
On-Premise | 17.4% |
Hybrid | 10.0% |
The demand for cloud-based AI toolkits is also rising because businesses need scalable infrastructure for training, inference, application testing, and real-time analytics. Cloud deployment allows enterprises to expand AI usage without building heavy in-house infrastructure. In 2026, AI infrastructure spending remains a major priority as companies increase investment in data centers, GPUs, and cloud-based AI services.
 iThe graph shows projected market growth until 2035 based on CAGR analysis. Actual outcomes may vary depending on changing demand, competition, and economic factors.To gain greater insights - request a sample report PDF
By Application: Machine Learning
Machine learning held the leading application share at 39.7%, as it remains the foundation of many AI toolkit use cases. Businesses use machine learning toolkits for forecasting, fraud detection, recommendation engines, predictive maintenance, image recognition, language processing, and customer behavior analysis. In 2026, machine learning remains important because enterprises are moving from simple automation toward more accurate prediction and decision support.
The demand for machine learning applications is supported by the need to process large volumes of business, customer, operational, and sensor data. Companies are using machine learning toolkits to improve accuracy, reduce manual analysis, and create faster business insights. In 2026, developer adoption of AI tools is also rising, with 84% of developers using or planning to use AI tools in their development process.
Application | Market Share |
|---|---|
Machine Learning | 39.7% |
Natural Language Processing | 16.8% |
Computer Vision | 13.5% |
Big Data Analytics | 10.9% |
Generative AI Tools | 8.7% |
AI Code Assistants | 6.2% |
Model Monitoring and Governance | 4.2% |
By End User: Large Enterprises
Large enterprises dominated the AI Toolkit Market with a 65.8% share, supported by strong budgets, complex data systems, and higher demand for automation across multiple departments. These organizations are adopting AI toolkits to improve productivity, customer service, risk management, cybersecurity, supply chain planning, and business intelligence. In 2026, large companies are focusing on moving AI from pilot projects into full business workflows.
The leadership of large enterprises can also be linked to their ability to invest in cloud infrastructure, AI talent, data governance, and advanced analytics systems. Many large firms are now using AI tools across thousands of employees, which increases demand for centralized toolkit management. In 2026, enterprise AI adoption is being shaped by stronger governance needs, as 80% of organizations have a separate risk function for AI or generative AI risks.
End User | Market Share |
|---|---|
Large Enterprises | 65.8% |
Small and Medium Enterprises | 18.6% |
Startups | 7.4% |
Individual Developers | 5.1% |
Academic and Research Institutions | 3.1% |
Regional Insights
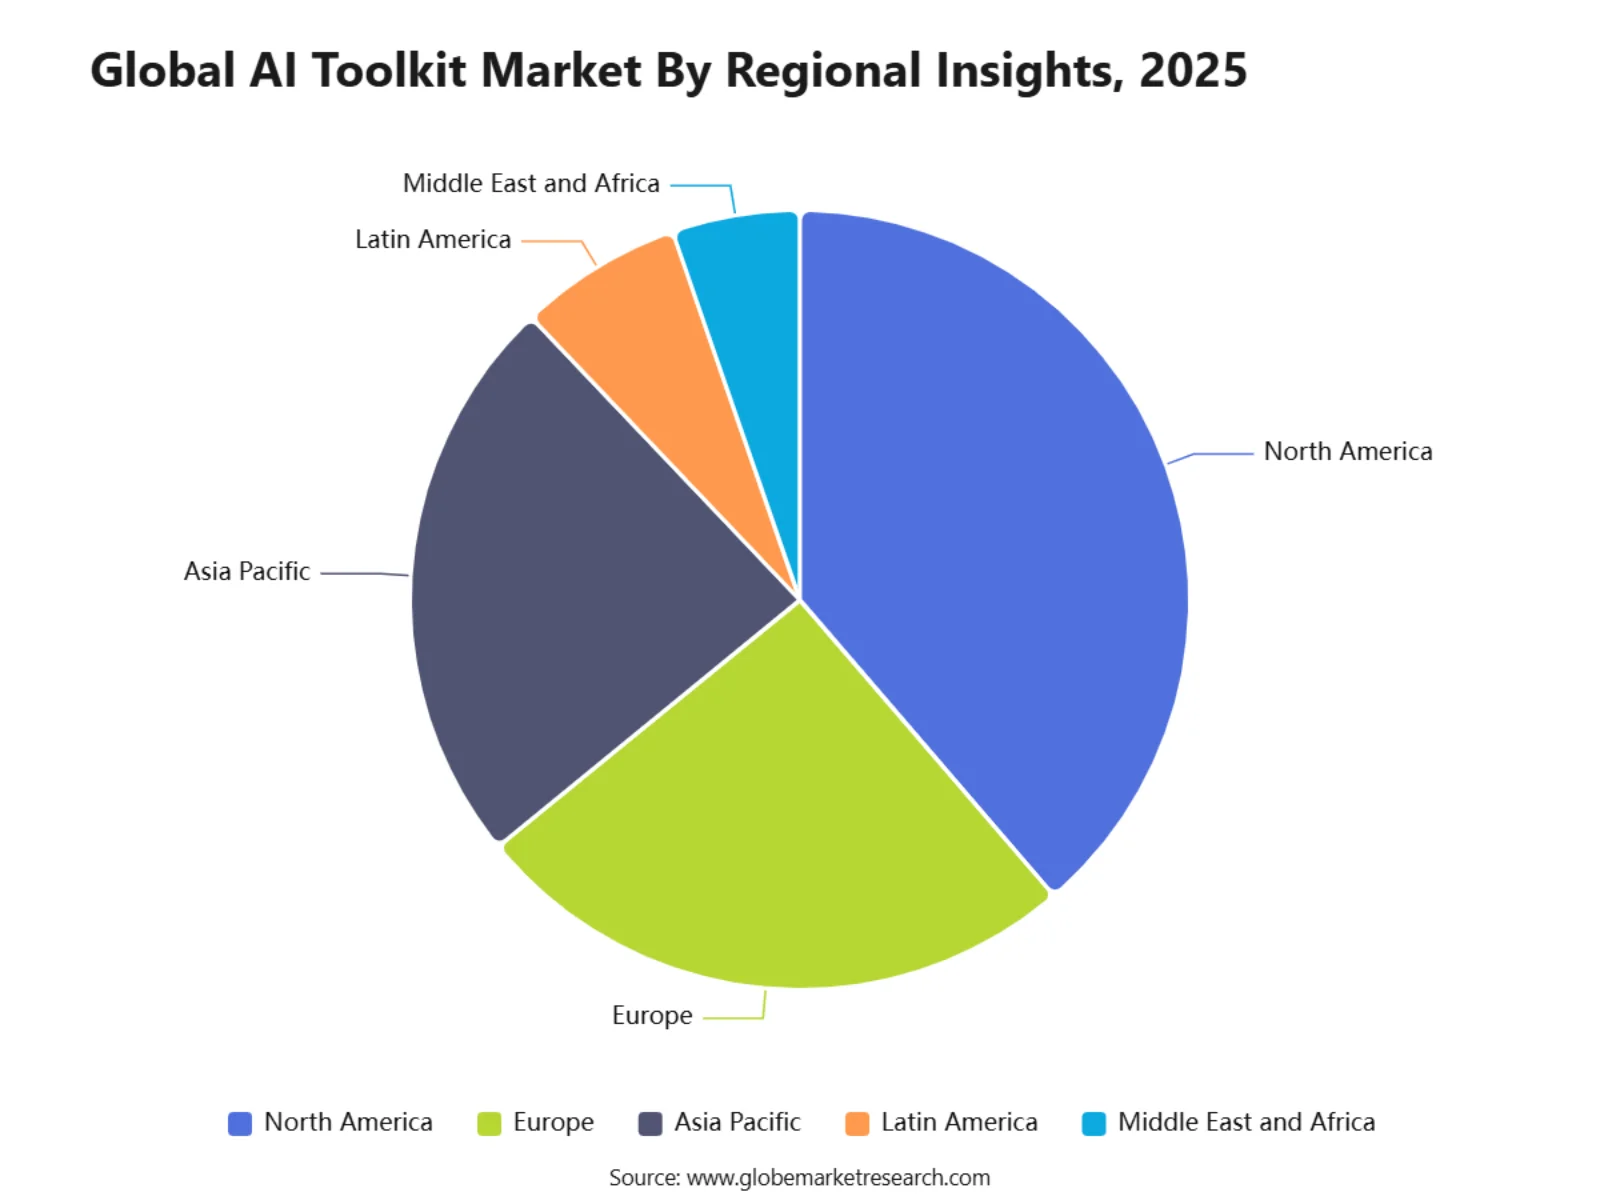
North America led the AI Toolkit Market with a 38.7% share, supported by strong technology infrastructure, high enterprise AI adoption, advanced cloud capacity, and a large base of AI software providers. The region benefits from early adoption across banking, healthcare, retail, manufacturing, technology, and public sector applications. In 2026, North America continues to show high usage of AI tools, with 70% of surveyed respondents in the region actively using AI.
Region | Market Share |
|---|---|
North America | 38.7% |
Europe | 25.4% |
Asia Pacific | 23.8% |
Latin America | 6.8% |
Middle East and Africa | 5.3% |
The region’s leadership is also supported by major investments in AI infrastructure, enterprise software, cloud platforms, and data-driven business transformation. Companies in North America are using AI toolkits to strengthen automation, software development, cybersecurity, analytics, and customer engagement. In 2026, AI has become a core part of business technology planning rather than a separate innovation project. This keeps North America ahead in AI toolkit adoption and commercial deployment.
 iThe graph shows projected market growth until 2035 based on CAGR analysis. Actual outcomes may vary depending on changing demand, competition, and economic factors.To gain greater insights - request a sample report PDF
Regional Impact Analysis
Impact Factor | Estimated CAGR Impact | Regional Relevance | Market Impact |
|---|---|---|---|
North America market leadership | +9.6% | U.S. and Canada | Leads enterprise adoption. |
Asia Pacific rapid AI expansion | +9.1% | China, India, Japan, South Korea, Southeast Asia | Driven by digital transformation. |
Europe responsible AI adoption | +7.4% | UK, Germany, France, Nordics | Supported by governance demand. |
Middle East AI investment growth | +5.8% | UAE, Saudi Arabia, Qatar | Builds AI infrastructure demand. |
Latin America emerging adoption | +4.6% | Brazil, Mexico, Chile, Colombia | Shows early growth potential. |
The U.S. AI Toolkit Market was valued at USD 10.6 billion and is expected to grow at a 36.4% CAGR, supported by strong enterprise AI adoption, cloud infrastructure expansion, and rising demand for AI-enabled software development. U.S. companies are using AI toolkits to build, test, deploy, and manage models across business functions. In 2026, the U.S. remains one of the most active markets for AI platforms, machine learning tools, developer assistants, and enterprise AI governance solutions.
 iThe graph shows projected market growth until 2035 based on CAGR analysis. Actual outcomes may vary depending on changing demand, competition, and economic factors.To gain greater insights - request a sample report PDF
Key Market Segments
By Component
Tools
Platforms
Services
By Deployment Mode
Cloud
On-Premise
Hybrid
By Application
Machine Learning
Natural Language Processing
Computer Vision
Big Data Analytics
Generative AI Tools
AI Code Assistants
Model Monitoring and Governance
By End User
Large Enterprises
Small and Medium Enterprises
Startups
Individual Developers
Academic and Research Institutions
By Region
North America
Europe
Asia Pacific
Latin America
Middle East & Africa
Market Dynamics
Drivers Impact Analysis
Impact Factor | Estimated CAGR Impact | Regional Relevance | Market Impact |
|---|---|---|---|
Rising enterprise AI adoption | +9.2% | North America, Europe, Asia Pacific | Expands AI toolkit usage. |
Growth in machine learning applications | +8.4% | U.S., China, India, UK, Germany | Drives model development demand. |
Increasing use of cloud AI platforms | +7.8% | Global | Supports scalable deployment. |
Demand for faster AI development | +7.1% | Global enterprises | Reduces development time. |
Expansion of generative AI projects | +6.9% | U.S., Europe, China, India | Strengthens toolkit demand. |
Restraints Impact Analysis
Impact Factor | Estimated CAGR Impact | Regional Relevance | Market Impact |
|---|---|---|---|
High implementation cost | -4.6% | SMEs, emerging markets | Limits adoption speed. |
Shortage of skilled AI professionals | -4.2% | Global | Delays toolkit deployment. |
Data privacy and security concerns | -3.9% | North America, Europe, developed Asia | Raises compliance pressure. |
Integration with legacy systems | -3.5% | Enterprises and public sector | Slows large-scale adoption. |
Limited AI readiness among firms | -3.1% | Emerging markets | Restricts early adoption. |
Opportunities Impact Analysis
Impact Factor | Estimated CAGR Impact | Regional Relevance | Market Impact |
|---|---|---|---|
Growth of no-code and low-code AI tools | +8.6% | Global | Expands non-technical adoption. |
Industry-specific AI toolkits | +7.9% | BFSI, healthcare, retail, manufacturing | Creates vertical growth. |
AI toolkit adoption by SMEs | +7.2% | Asia Pacific, Europe, Latin America | Opens new user segments. |
Expansion in data analytics automation | +6.8% | North America, Europe, Asia Pacific | Improves business insights. |
Rising demand for AI model monitoring | +6.3% | Global | Supports trusted AI use. |
Challenges Impact Analysis
Impact Factor | Estimated CAGR Impact | Regional Relevance | Market Impact |
|---|---|---|---|
Model bias and accuracy issues | -4.1% | Global | Reduces user confidence. |
Complex AI governance needs | -3.8% | U.S., Europe, Japan, South Korea | Increases compliance workload. |
Vendor lock-in risk | -3.2% | Global | Limits platform flexibility. |
Poor data quality | -3.6% | Global enterprises | Weakens model performance. |
Rapid technology changes | -3.0% | Global | Increases upgrade pressure. |
Recent Developments
May 2026 – IBM announced the next generation of watsonx Orchestrate at Think 2026. The platform is being developed as an agentic control plane for enterprise AI workflows. This development supports demand for AI toolkits that can manage agents, automate tasks, and connect business applications in a governed environment.
June 2026 – Microsoft introduced new AI development tools at Build 2026, including agent-focused capabilities, Copilot updates, and deeper Azure AI Foundry integration. Fireworks AI also became generally available on Microsoft Foundry, giving developers enterprise governance and Azure data residency for multiple model choices. This strengthens Microsoft’s position in enterprise AI toolkit adoption.
March 2026 – Hugging Face reported strong open-source ecosystem growth. In 2025, the platform reached 13 million users, more than 2 million public models, and over 500,000 public datasets. This growth shows rising demand for open AI toolkits, model hubs, datasets, and developer collaboration platforms.
March 2025 – OpenAI launched the Responses API, Agents SDK, and built-in tools such as web search, file search, and computer use. These tools were designed to help developers build production-ready AI agents with easier orchestration and observability. This marked a major shift from chatbot APIs toward agent-native AI toolkits.
Report Scope
Report Highlights | Details |
|---|---|
Market Revenue (2025) | USD 2.5 Bn |
Forecast Revenue (2035) | USD 7.8 Bn |
CAGR (2025-2035) | 12.1% |
Base Year for Estimation | 2025 |
Historic Data | 2020-2024 |
Forecast Period | 2025-2035 |
Report Coverage | AI impact Analysis, Revenue projections, company positioning, competitive analysis, growth drivers, and emerging market trends |
Segments Covered | By Subscription Type (Digital Subscription, Physical Subscription, Hybrid Subscription), By Content Type (Superhero Comics, Manga,Indie Comics, Graphic Novels), By Target Audience (Children, Teens, Adults, Collectors), By Pricing Model (Monthly Subscription, Annual Subscription, Pay-Per-Comic) |
Regional Analysis | North America – US, Canada; Europe – Germany, France, The UK, Spain, Italy, Russia, Netherlands, Rest of Europe; Asia Pacific – China, Japan, South Korea, India, New Zealand, Singapore, Thailand, Vietnam, Rest of Latin America; Latin America – Brazil, Mexico, Rest of Latin America; Middle East & Africa – South Africa, Saudi Arabia, UAE, Rest of MEA |
Key companies profiled | Marvel Unlimited, DC Universe Infinite, Amazon Comixology, GlobalComix, WEBTOON, Tapas Entertainment, Manga Plus by Shueisha, VIZ Media, Crunchyroll Manga, Kindle Unlimited, Scribd / Everand, Hoopla Digital, BookWalker, Izneo, Dark Horse Digital, Image Comics, Boom! Studios, IDW Publishing, Archie Comics, Midtown Comics, MyComicShop, Comic Garage, Comic Bento, The Comic Mystery Box, Shortboxed |
Customization Scope | Tailored insights for specific regions, countries, and market segments can be provided. Additional report customization is available upon request. |
Competitive Landscape
The market is characterized by intense competition among established players and emerging companies. Strategic partnerships, mergers and acquisitions, and product innovation are key strategies employed by market participants.
Key Market Players
Microsoft Corporation
Google LLC
IBM Corporation
Amazon Web Services, Inc.
NVIDIA Corporation
Salesforce, Inc.
Intel Corporation
Meta Platforms, Inc.
Oracle Corporation
Adobe Inc.
Thales Group
OpenAI
Other Key Players
Meet the Team
This report was prepared by our expert analysts with deep industry knowledge and research experience.
Kevin is a market research analyst with expertise in industry analysis, market sizing, competitive benchmarking, and growth opportunity assessment. Her work focuses on delivering clear, data-backed insights that help businesses understand market trends, customer demand, emerging technologies, and investment potential across global industries.
Suraj is a seasoned Senior Management Consultant with over 7 years of experience in market research, business strategy, and consulting. He has worked with Fortune 500 companies as well as emerging startups, supporting clients in cross-border expansion, market entry strategies, and growth planning. He has played a key role in delivering strategic viewpoints and actionable insights across various client projects. His expertise includes demand analysis, competitive analysis, market opportunity assessment, channel partner identification, and business expansion strategy. His analytical approach and industry understanding help clients make informed decisions and enter new markets with greater confidence.
Frequently Asked Questions
Related Reports
More in Information and Technology
Voice AI Agents Market to Hit USD 113.7 Billion by 2035
Global Voice AI Agents Market Size, Share Analysis Report By Solution (Voice AI Platform, Services (Professional Services(Implementation & Integration, Consulting & Training Services, Support and Maintenance Services), Managed Services)), By Deployment (Cloud Based, On Premises), By Enterprise Size (Small & Medium Enterprise Size, Large Enterprises), By Industry (BFSI, Automotive, Healthcare, Retail & E-commerce, IT & Telecom, Aerospace & Defence, Others (Utilities, Media & Entertainment)), By Regional Insights, Business plan and Project Report, Investment Opportunities, Profitability, Industry Trends, Leading Companies and Growth Forecasts by 2025-2035
AI Trust, Risk and Security Management (AI TRiSM) Market to hit USD 39.8 Bn by 2026
Global AI Trust, Risk and Security Management (AI TRiSM) Market Size, Share Analysis Report By Component (Solutions, Services), By Technology (ML based TRiSM, Natural Language Processing based TRiSM, Explainable AI (XAI), Federated Learning/Privacy-Preserving ML), By Application (Model Governance & Compliance, Model Monitoring & Observability, Data Privacy & Security, Bias Detection & Mitigation, Identity & Access Security for AI), By Deployment (On-premises, Cloud), By Organization Size (Large Enterprises, Small & Medium Enterprises), By Industry Vertical (BFSI, Healthcare, Retail & E-commerce, IT & Telecom, Government & Defense, Manufacturing, Transportation & Logistics), By Regional Insights, Business plan and Project Report, Investment Opportunities, Profitability, Industry Trends, Leading Companies and Growth Forecasts by 2025-2035
K-12 Education Technology (EdTech) Market to hit USD 491.5 Bn by 2035
Global K-12 Education Technology (EdTech) Market Size, Share Analysis Report By Component (Hardware, Software, Services), By Deployment Mode (Cloud-Based, On-Premises), By Technology Type (Learning Management Systems (LMS), Student Information Systems (SIS), Gamification & Game-based Learning, AR/VR in Education, AI-enabled Learning Tools, Adaptive & Personalized Learning, eContent & Digital Courseware), By Application (Classroom Learning, Remote Learning / Online Learning, Curriculum Management, Content Delivery & Digital Textbooks and Others), By End User (Public K-12 Schools, Private K-12 Schools, Charter Schools, Home Schools), By Regional Insights, Business plan and Project Report, Investment Opportunities, Profitability, Industry Trends, Leading Companies and Growth Forecasts by 2025-2035
US Esports Market to hit USD 29.3 Bn by 2035
US Esports Market Size, Share Analysis Report By Revenue Source (Advertising & Sponsorships, Media Rights, Merchandise & Tickets, Others), By Platform (PC Gaming Platforms, Console Gaming Platforms, Mobile & Tablet Platforms, Others), By Game Genre (MOBA Games, First-Person Shooter Games, Battle Royale Games, and Others), By Streaming Type (Live Streaming, On-Demand Streaming, Hybrid Streaming), By Device Type (Smartphones, PC, Console, Others), By End User (Advertisers & Sponsors, Game Publishers, Streaming Platforms, Tournament Organizers, Teams & Players, Viewers/Fans), By Regional Insights, Business plan and Project Report, Investment Opportunities, Profitability, Industry Trends, Leading Companies and Growth Forecasts by 2025-2035