

Revenue, 2025
$8.4 Tn
Forecast, 2035
$12.8Tn
CAGR, 2025-2035
4.3%
Report Coverage
Global
Market Size and Forecast
2025
$8.4 Tn
2035
$12.8Tn
CAGR
4.3%
The global Oil Market reached USD 8.4 trillion in 2025 and is expected to grow to USD 12.8 trillion by 2035, registering a CAGR of 4.3% from 2025 to 2035. The growth of the market can be attributed to steady demand from transportation, aviation, shipping, petrochemicals, power backup, industrial heating, and manufacturing activities. Oil continues to play a major role in global energy security, as it supports fuel supply chains, refinery operations, chemical production, and cross-border trade. Demand is also being supported by rising mobility, higher petrochemical feedstock use, aviation recovery, and energy needs in developing economies.
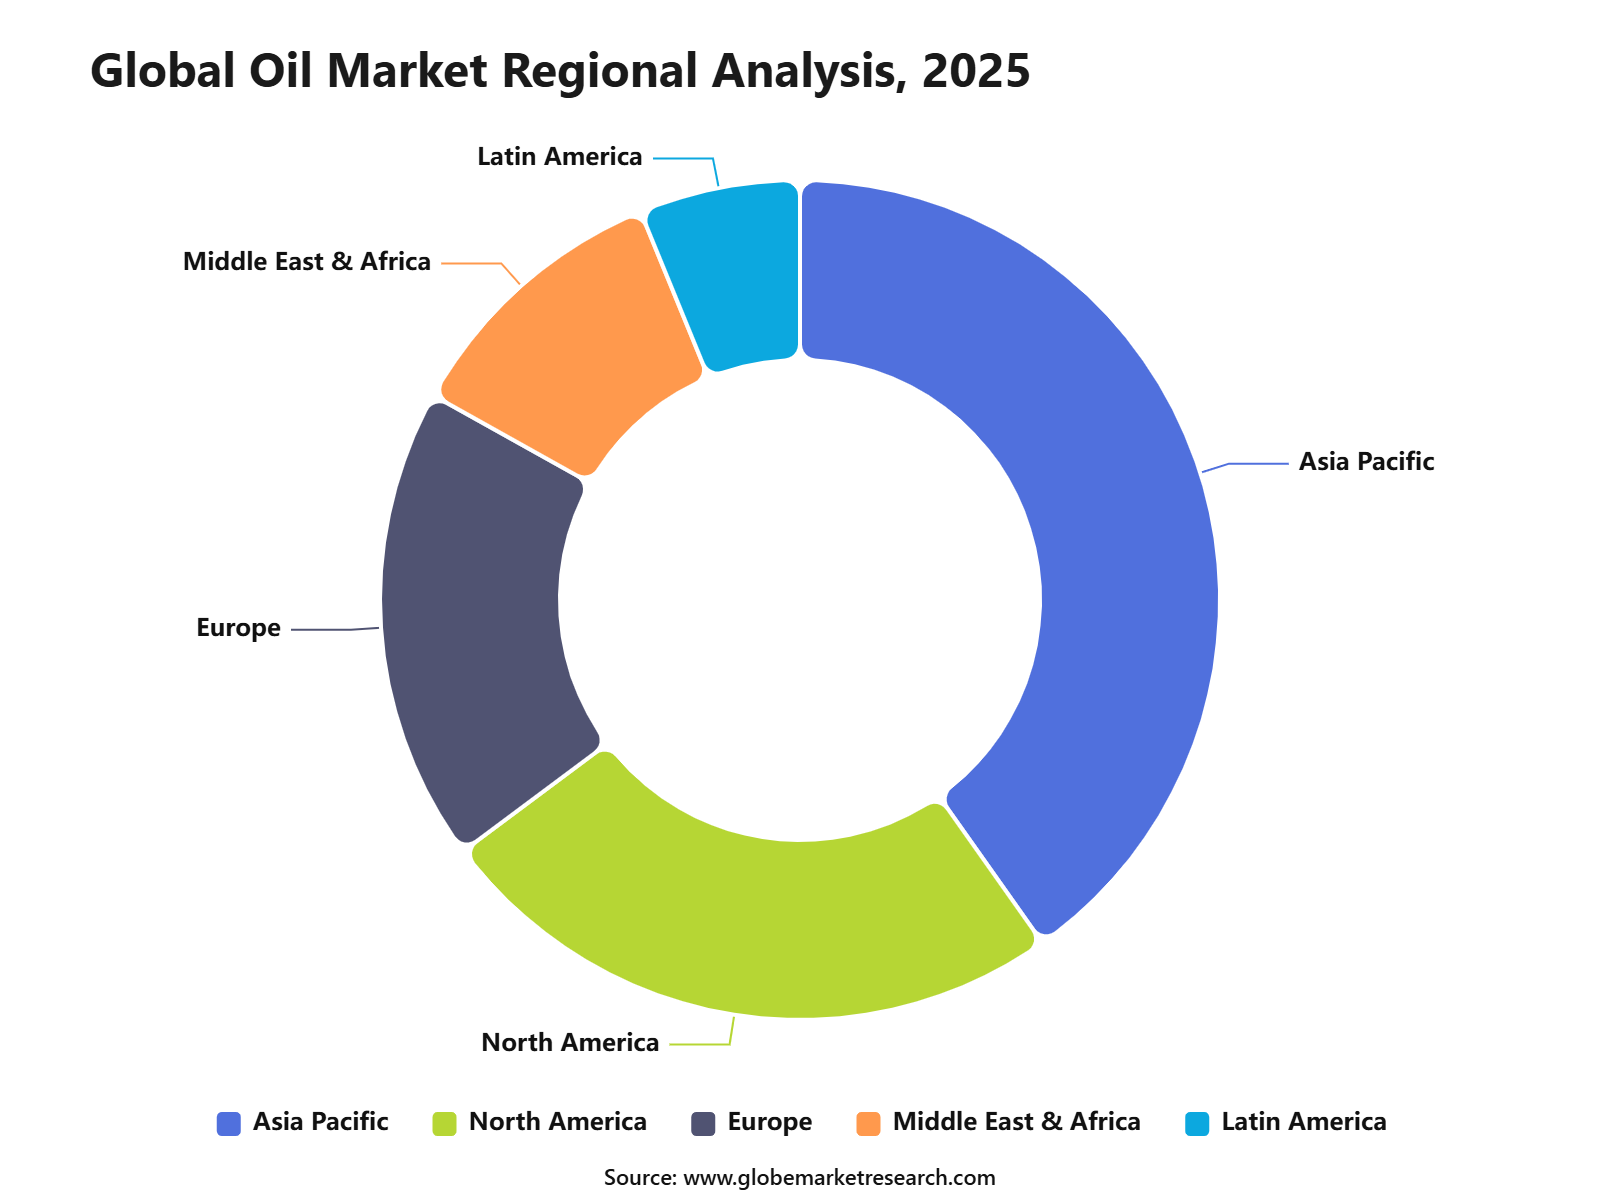
Asia Pacific held the largest regional share of 40.2% in 2025, supported by high fuel consumption, large refining capacity, growing petrochemical production, and strong industrial activity across China, India, Japan, South Korea, and Southeast Asia. The region remains a major demand center due to rising vehicle ownership, expanding air travel, urbanization, and higher consumption of plastics, synthetic fibers, fertilizers, and other oil-derived products. India and other Asian economies are expected to remain important long-term demand drivers as income levels, logistics activity, and manufacturing output continue to rise.
Key Market Insights
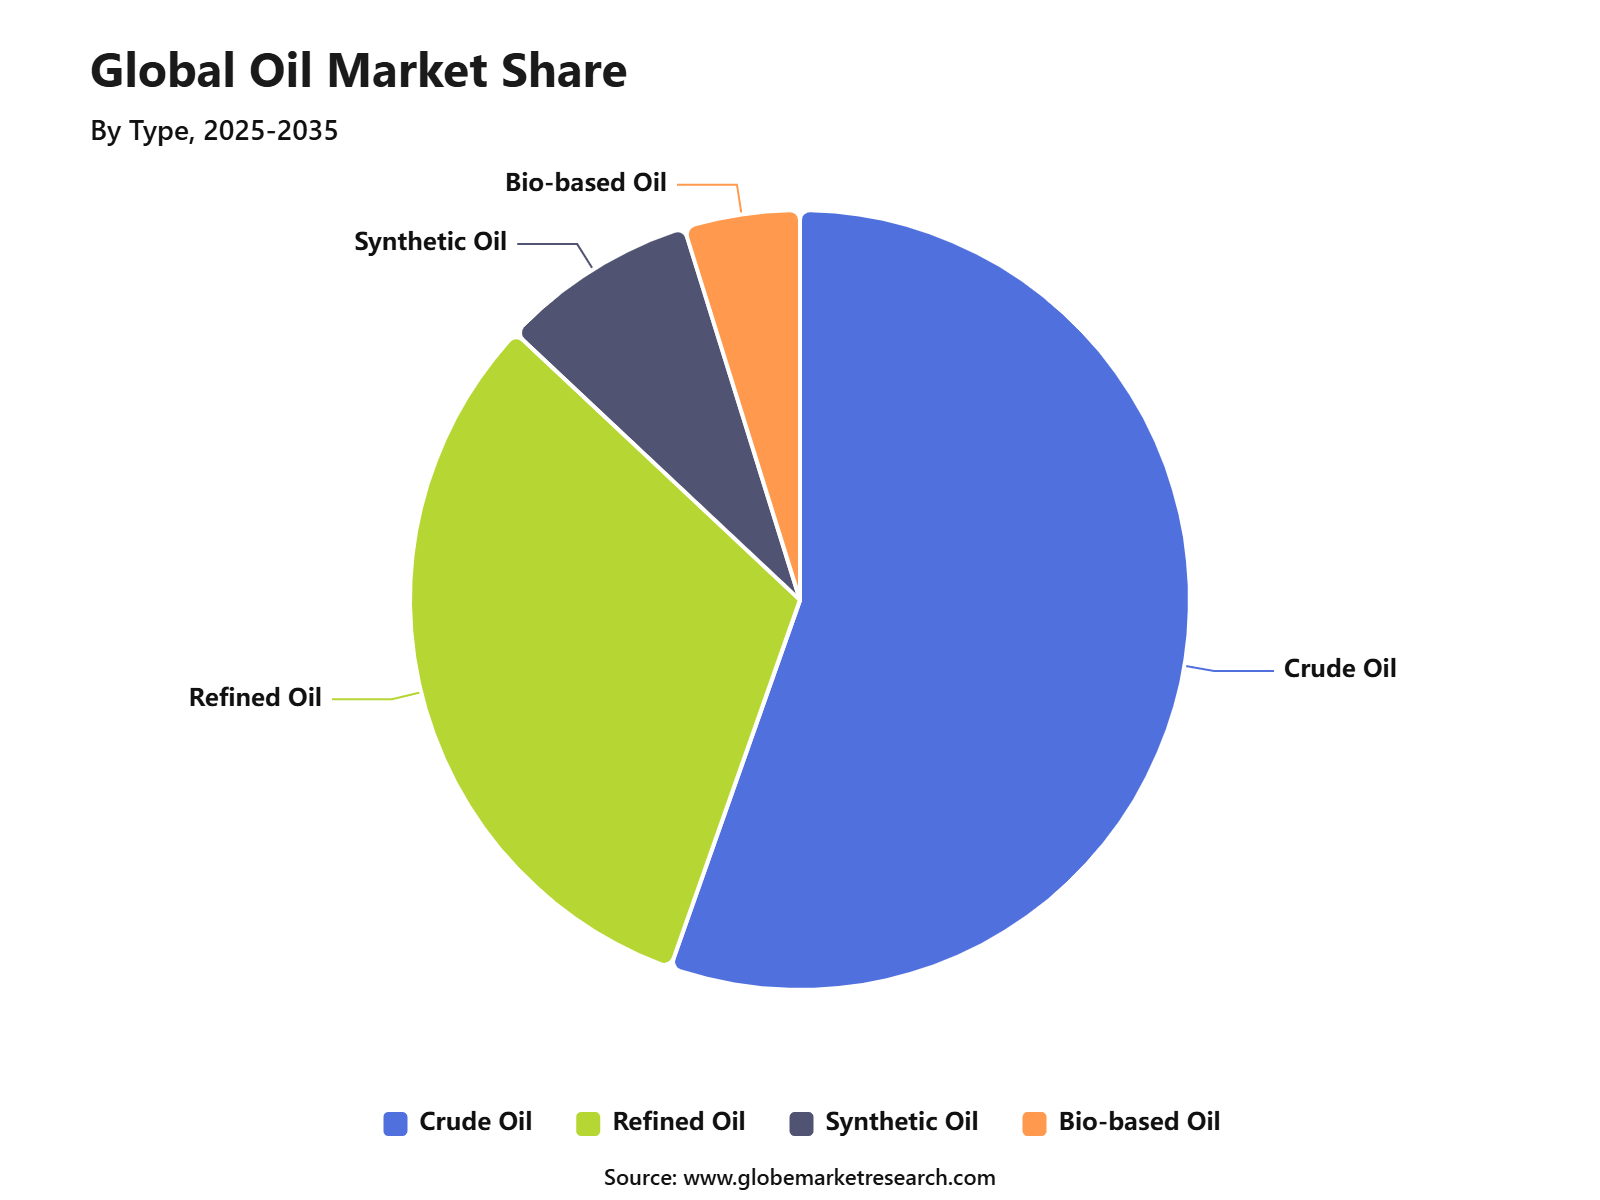
Crude oil led the type segment with 55.4% share, supported by its wide use in fuel production, petrochemicals, industrial processes, and global energy supply.
Transportation accounted for 47.8% share by application, driven by strong demand for gasoline, diesel, aviation fuel, and marine fuel across passenger and freight movement.
Conventional oil held 73.3% share by source, supported by established extraction infrastructure, large reserves, and lower production complexity compared with unconventional sources.
Direct distribution captured 64.4% share, driven by long-term supply contracts, bulk purchasing, and direct sales to refineries, industrial users, and large energy buyers.
Asia Pacific led the oil market with 40.2% share, supported by high energy consumption, rapid industrial activity, growing transportation demand, and strong refining capacity.
Oil Market Overview
The oil market refers to the global system through which crude oil, refined petroleum products, and related liquid fuels are produced, transported, refined, traded, and consumed. It covers upstream exploration and production, midstream storage and pipelines, downstream refining, fuel distribution, and end-use demand from transport, industry, power generation, petrochemicals, and households.
In 2026, the oil market remains highly sensitive to supply disruption, inventory levels, fuel prices, refinery operations, and geopolitical risk. Demand has been affected by high fuel prices, reduced availability of crude and refined products, and government measures to reduce fuel use. As a result, global oil demand is estimated at around 102.9 million barrels per day in 2026, after a forecast decline of 1.1 million barrels per day from 2025 levels.
The growth and movement of the oil market can be attributed to energy security needs, transport fuel consumption, industrial activity, petrochemical feedstock demand, and refinery utilization. Oil remains a key input for gasoline, diesel, jet fuel, marine fuel, plastics, chemicals, lubricants, and several industrial products, which keeps the market important across both developed and emerging economies.
Go-to-Market and Sales Economics
The oil market is being shaped by supply security, refinery access, price volatility, and stronger demand for reliable export partners. Producers and traders are giving higher priority to long-term supply agreements, flexible cargo routing, inventory planning, and regional price-linked contracts. In 2026, Brent crude prices remained elevated, with official forecasts placing Brent near USD 105 per barrel in June and July as tight inventories and Middle East supply disruption kept the market under pressure.
Sales economics are shifting in favor of suppliers that can offer stable delivery, diversified shipping routes, and refined product availability. U.S. crude oil and petroleum product net exports are expected to average 4.2 million barrels per day in 2026, up by 1.4 million barrels per day from 2025, supported by higher global demand for American supply. Refiners, distributors, and industrial buyers are also using shorter pricing cycles, inventory hedging, and alternative sourcing to protect margins from sudden crude and fuel price changes.
According to IEA, Global oil supply is also under pressure. Supply is forecast to fall by 3.9 million barrels per day to 102.4 million barrels per day in 2026 before rebounding strongly in 2027. May 2026 output dropped to 94.5 million barrels per day, which was 600,000 barrels per day lower than the previous month and 13.6 million barrels per day below pre-conflict levels. This indicates that production recovery may take time, even if geopolitical tensions ease.
Tariff Impact and America-Iran War Impact
Tariff pressure is affecting the oil market more through equipment, feedstock, and project-cost inflation than through direct crude oil tariffs. Oil, gas, and refined product imports were exempted from the broader U.S. tariff program in 2025, which helped protect energy supply flows and reduced the risk of immediate fuel-price shocks. However, tariffs on steel, aluminum, copper, valves, compressors, drilling rigs, and other oilfield inputs are raising the cost of exploration, production, transport, and refining infrastructure.
The impact is most visible in capital spending and contract pricing. Industry estimates indicate that tariffs on key materials and services could increase costs across the oil and gas value chain by 4% to 40%, while more than USD 50 billion in offshore greenfield projects and final investment decisions could face delays. As a result, oil companies are expected to renegotiate supplier contracts, shift toward domestic or non-tariffed suppliers, use foreign trade zones where possible, and add escalation clauses to protect project economics.
The America-Iran war has created one of the most important oil supply shocks in recent years because of its direct impact on the Strait of Hormuz, a key route for Middle East crude and fuel exports. The IEA estimated that more than 14 million barrels per day of Middle East oil output had been blocked or disrupted during the conflict. Global oil inventories have been drawn down sharply, and U.S. crude inventories, including commercial stocks and the Strategic Petroleum Reserve, fell to 758.5 million barrels in mid-June 2026, the lowest level since March 1985.
The recent U.S. - Iran interim agreement has eased near-term oil price pressure, as the deal includes steps to reopen the Strait of Hormuz and waive U.S. sanctions on Iranian oil exports. Brent crude fell to around USD 77.41 per barrel and WTI declined to about USD 74.43 per barrel on June 2026, as traders priced in the potential return of Iranian barrels. However, the recovery is expected to remain gradual because shipping insurance, tanker confidence, demining, port operations, and political risk must normalize before full-scale flows return.
Market Trend Analysis
Impact Factor | Estimated CAGR Impact | Regional Relevance | Market Impact |
|---|---|---|---|
Shift toward cleaner refining operations | +0.9% | Europe, North America, Asia Pacific | Supports compliance needs. |
Growth in petrochemical-linked oil demand | +1.0% | China, India, GCC, U.S. | Drives long-term usage. |
Rising demand for low-sulfur fuels | +0.7% | Marine, aviation, transport sectors | Improves fuel standards. |
Digitalization of upstream operations | +0.6% | Global oil producers | Reduces operating cost. |
Expansion of LNG and gas-linked portfolios | +0.5% | Global energy companies | Supports energy diversification. |
Investor Type Impact Matrix
Investor Type | Estimated CAGR Impact | Regional Relevance | Market Impact |
|---|---|---|---|
National Oil Companies | +1.1% | Middle East, Asia Pacific, Latin America | Supports production growth. |
Integrated Energy Companies | +0.9% | Global | Expands diversified portfolios. |
Private Equity Firms | +0.6% | North America, Europe, Asia Pacific | Supports asset development. |
Infrastructure Investors | +0.7% | Global storage and pipeline hubs | Improves logistics capacity. |
Sovereign Wealth Funds | +0.8% | GCC, Asia Pacific, Africa | Supports strategic energy assets. |
Type Analysis
Crude oil led the Oil Market with 55.4% share, supported by its central role as the primary raw material for refined petroleum products. It is processed into gasoline, diesel, jet fuel, marine fuel, petrochemical feedstocks, lubricants, asphalt, and other energy products used across transportation, industry, construction, and manufacturing.
The growth of this segment can be attributed to the continued need for liquid fuels in mobility, freight, aviation, shipping, and industrial operations. Although renewable energy and electric mobility are expanding, crude oil remains essential because many sectors still depend on high-energy-density fuels and existing refining infrastructure.
 iThe graph shows projected market growth until 2035 based on CAGR analysis. Actual outcomes may vary depending on changing demand, competition, and economic factors.To gain greater insights - request a sample report PDF
Application Analysis
Transportation accounted for 47.8% share of the Oil Market, driven by strong demand for gasoline, diesel, jet fuel, and marine fuel. Road transport, aviation, shipping, logistics, and public mobility continue to be major oil-consuming activities, especially in growing economies with rising vehicle ownership and trade movement.
The segment is supported by freight transport, air travel recovery, urban mobility, and expanding logistics networks. While electric vehicles are reducing oil demand growth in some passenger car markets, oil remains important for heavy-duty trucks, aviation, shipping, and long-distance transport where fuel substitution is slower.
Source Analysis
Conventional oil held 73.3% share, supported by large producing fields, established extraction methods, developed infrastructure, and lower production complexity compared with many unconventional resources. Conventional oil remains a major supply source because it can be produced through mature upstream systems and transported through existing pipeline, storage, and refinery networks.
The segment is expected to remain important as oil producers continue to maintain output from established basins. However, mature field decline, geopolitical risks, investment discipline, and environmental regulations are encouraging companies to improve recovery rates, reduce emissions intensity, and invest in more efficient production technologies.
Distribution Channel Analysis
Direct distribution accounted for 64.4% share, supported by large-volume transactions between producers, refiners, petrochemical companies, industrial buyers, fuel distributors, and government-linked buyers. Direct channels are preferred for long-term supply agreements, bulk oil movement, refinery feedstock procurement, and large commercial energy contracts.
The growth of this segment can be linked to the need for supply security, price visibility, and operational reliability. Direct distribution helps major buyers manage sourcing risks, reduce intermediary costs, and ensure stable access to crude oil and refined petroleum products.
Regional Analysis
Asia Pacific led the Oil Market with 40.2% share, supported by large population, rapid industrial activity, expanding transportation networks, rising petrochemical demand, and strong refining capacity. China, India, Japan, South Korea, and Southeast Asian countries remain major demand centers for crude oil, refined fuels, and petrochemical feedstocks.
Region | Market Share |
|---|---|
Asia Pacific | 40.2% |
North America | 24.6% |
Europe | 18.3% |
Middle East & Africa | 10.7% |
Latin America | 6.2% |
The region is expected to remain a key oil consumption hub due to rising mobility demand, aviation growth, manufacturing activity, and infrastructure development. India and Southeast Asia are likely to support long-term demand growth, while China’s demand pattern is expected to shift more toward petrochemicals as electric mobility expands.
 iThe graph shows projected market growth until 2035 based on CAGR analysis. Actual outcomes may vary depending on changing demand, competition, and economic factors.To gain greater insights - request a sample report PDF
Segments Covered in the Report
By Type
Crude Oil
Refined Petroleum Products
Synthetic Oil
Bio-based Oil
By Application
Transportation
Industrial
Residential
Commercial
Others
By Source
Conventional
Unconventional
By Distribution Channel
Direct
Indirect
By Region
Asia Pacific
North America
Europe
Middle East & Africa
Latin America
Drivers Impact Analysis
Impact Factor | Estimated CAGR Impact | Regional Relevance | Market Impact |
|---|---|---|---|
Rising energy demand from emerging economies | +1.2% | Asia Pacific, Middle East, Africa | Drives oil consumption. |
Growth in transportation fuel demand | +1.0% | Global | Supports refined product use. |
Expanding petrochemical feedstock demand | +0.9% | China, India, U.S., GCC | Increases crude oil usage. |
Industrialization and infrastructure growth | +0.8% | Asia Pacific, Africa, Latin America | Supports fuel demand. |
Aviation and marine fuel recovery | +0.7% | Global trade and travel hubs | Improves product demand. |
Restraints Impact Analysis
Impact Factor | Estimated CAGR Impact | Regional Relevance | Market Impact |
|---|---|---|---|
Energy transition toward renewables | -0.9% | Europe, North America, China | Reduces long-term oil reliance. |
Volatile crude oil prices | -0.8% | Global | Creates market uncertainty. |
Strict emission regulations | -0.7% | Europe, U.S., developed Asia | Pressures fossil fuel use. |
Rising EV adoption | -0.6% | China, Europe, U.S. | Slows gasoline demand. |
Geopolitical supply risks | -0.5% | Middle East, Russia, Africa | Disrupts supply stability. |
Opportunities Impact Analysis
Impact Factor | Estimated CAGR Impact | Regional Relevance | Market Impact |
|---|---|---|---|
Growth in petrochemical production | +1.1% | Asia Pacific, GCC, U.S. | Expands non-fuel demand. |
Investment in refining capacity | +0.9% | India, China, Middle East, Africa | Supports product availability. |
Expansion of strategic oil reserves | +0.8% | Asia Pacific, U.S., Europe | Strengthens energy security. |
Enhanced oil recovery projects | +0.7% | North America, Middle East | Improves production output. |
Digital oilfield technologies | +0.6% | Global producers | Improves operational efficiency. |
Challenges Impact Analysis
Impact Factor | Estimated CAGR Impact | Regional Relevance | Market Impact |
|---|---|---|---|
Carbon reduction pressure | -0.8% | Global | Limits fossil fuel expansion. |
Supply-demand imbalance risk | -0.7% | Global | Affects price stability. |
High exploration and production cost | -0.6% | Offshore and mature fields | Pressures margins. |
Political instability in producing regions | -0.5% | Middle East, Africa, Latin America | Raises supply risk. |
Refinery transition complexity | -0.4% | Europe, North America, Asia Pacific | Requires capital upgrades. |
Recent Developments
June 2026: ADNOC accelerated its oil expansion strategy in the UAE. The IEA forecast UAE total oil output at 5.2 million barrels per day in 2027, up 730,000 barrels per day year over year. ADNOC also confirmed AED 200 billion, or USD 55 billion, in project awards for 2026 to 2028, covering upstream and downstream operations.
June 2026: OPEC+ approved a production target increase of 188,000 barrels per day for July 2026. The decision was taken by seven members, including Saudi Arabia, Russia, Iraq, Kuwait, Kazakhstan, Algeria, and Oman. This marked another step in the gradual return of voluntary production cuts, although actual supply delivery remained affected by export-route disruptions.
Report Scope
Report Highlights | Details |
|---|---|
Market Revenue (2025) | USD 8.4 Trillion |
Forecast Revenue (2035) | USD 12.8 Trillion |
CAGR (2025-2035) | 4.3% |
Base Year for Estimation | 2025 |
Historic Data | 2020-2024 |
Forecast Period | 2025-2035 |
Report Coverage | AI market impact analysis, market surveys, trade analysis, Industry & competitive intelligence, Revenue projections, company positioning, competitive analysis, growth drivers, and emerging market trends, Strategic Consultation & Advisory Services |
Segments Covered | By Type (Crude Oil, Refined Oil, Synthetic Oil, and Bio-based Oil), Application (Transportation, Industrial, Residential, Commercial, and Others), By Source (Conventional, Unconventional), By Distribution Channel (Direct, Indirect), By Regional Insights |
Regional Analysis | North America - US, Canada; Europe - Germany, France, The UK, Spain, Italy, Russia, Netherlands, Rest of Europe; Asia Pacific - China, Japan, South Korea, India, New Zealand, Singapore, Thailand, Vietnam, Rest of Latin America; Latin America - Brazil, Mexico, Rest of Latin America; Middle East & Africa - South Africa, Saudi Arabia, UAE, Rest of MEA |
Key companies profiled | Saudi Aramco, ExxonMobil Corporation, Chevron Corporation, Shell plc, BP p.l.c., TotalEnergies SE, PetroChina Company Limited, China Petroleum & Chemical Corporation, Sinopec, China National Offshore Oil Corporation, CNOOC, Reliance Industries Limited, Indian Oil Corporation Limited, Bharat Petroleum Corporation Limited, Hindustan Petroleum Corporation Limited, QatarEnergy, Abu Dhabi National Oil Company, ADNOC, Kuwait Petroleum Corporation, Petrobras, Eni S.p.A., ConocoPhillips, Equinor ASA, and Other Key Players. |
Customization Scope | Tailored insights for specific regions, countries, and market segments can be provided. Additional report customization is available upon request. |
Competitive Landscape
The market is characterized by intense competition among established players and emerging companies. Strategic partnerships, mergers and acquisitions, and product innovation are key strategies employed by market participants.
Key Market Players
Saudi Aramco
ExxonMobil Corporation
Chevron Corporation
Shell plc
BP p.l.c.
TotalEnergies SE
PetroChina Company Limited
China Petroleum & Chemical Corporation, Sinopec
China National Offshore Oil Corporation, CNOOC
Reliance Industries Limited
Indian Oil Corporation Limited
Bharat Petroleum Corporation Limited
Hindustan Petroleum Corporation Limited
QatarEnergy
Other Key Players
Meet the Team
This report was prepared by our expert analysts with deep industry knowledge and research experience.
Pratiksha is market research analyst with strong experience in industry research, market forecasting, and competitive analysis. She specializes in identifying market trends, evaluating growth opportunities, and preparing data-driven insights across global industries. Her work supports businesses in understanding market dynamics, customer demand, regional opportunities, and strategic investment areas.
Sayali K. brings more than 5 years of experience to Globe Market Research, supporting the accuracy, clarity, and relevance of research content across multiple industries. She reviews market data, segment analysis, competitive insights, and industry trends to ensure each report meets strong quality standards and provides practical value to business decision-makers. Her expertise spans healthcare, information technology, consumer goods, and diverse cross-industry domains. With a strong focus on data reliability, structured analysis, and clear presentation, Sayali helps ensure that each research output delivers well-reviewed insights for clients, investors, consultants, and industry stakeholders.
Frequently Asked Questions
Related Reports
More in Energy and Power
Lithium-Ion Battery Market Revenue to Hit USD 1,097.2Bn by 2035
Global Lithium-Ion Battery Market Size and Trade Analysis Report By Product Type (LCO, LFP, NMC, NCA, LMO, LTO), By Form Factor (Cylindrical, Prismatic, Pouch), By Power Capacity (Up To 3, 000 MAh, 3, 000 To 10, 000 MAh, 10, 000 To 60, 000 MAh, Above 60, 000 MAh), By Voltage (Low (Below 12V), Medium (12V-36V), High (Above 36V)), By End-Use Industry (Automotive, Consumer Electronics, Industrial, Stationary Storage, Aerospace, Marine), By Regional Insights, Leading Companies and Growth Forecasts by 2025-2035
Power Purchase Agreement Market to hit 623.3 Bn by 2035
Global Power Purchase Agreement Market Size, Share and Trends Analysis Report By Agreement Type (Physical PPA, Virtual PPA, Sleeved PPA, On-site PPA and Others), By Energy Source (Solar, Wind, Hybrid Renewable and Storage-backed Projects, Hydro, Biomass, and Others), By Buyer Type (Commercial and Industrial Buyers, Utilities, Data Centers and Technology Companies, Government and Public Sector, Others), By Contract Duration (10 to 15 Years, Above 15 Years, 5 to 10 Years, Less than 5 Years), By Regional Insights, Leading Companies and Growth Forecasts By 2025-2035