

Revenue, 2025
$32.9 Bn
Forecast, 2035
$623.3 Bn
CAGR, 2025-2035
34.2%
Report Coverage
Global
Market Size and Forecast
The global Power Purchase Agreement Market was valued at USD 32.9 billion in 2025 and is projected to reach USD 623.3 billion by 2035, growing at a CAGR of 34.2%. North America led the market with a 40.8% share in 2025, while the U.S. market reached USD 11.9 billion and is expected to grow at a 34.6% CAGR, supported by strong renewable energy demand, clean energy policies, and long-term power cost stability needs.
Key Parameter | Report Details |
|---|---|
Current Revenue, 2025 | USD 32.9 Billion |
Projected Revenue, 2035 | USD 623.3 Billion |
CAGR, 2025 To 2035 | 34.2% |
Largest Region | North America |
Leading Segment | Commercial and industrial buyers accounted for 49.9% share |
Market Concentration/Market Structure | Medium/Moderately Fragmented |
Base Year | 2025 |
Forecast Period | 2025-2035 |
The market is gaining strong importance as companies and public institutions increase renewable energy procurement. Power purchase agreements are also being used to support clean energy targets, reduce exposure to volatile power prices, and improve energy security. According to the IEA, global annual renewable capacity additions reached about 666 GW in 2024 and are expected to rise to nearly 935 GW by 2030, with solar PV and wind accounting for most new additions.
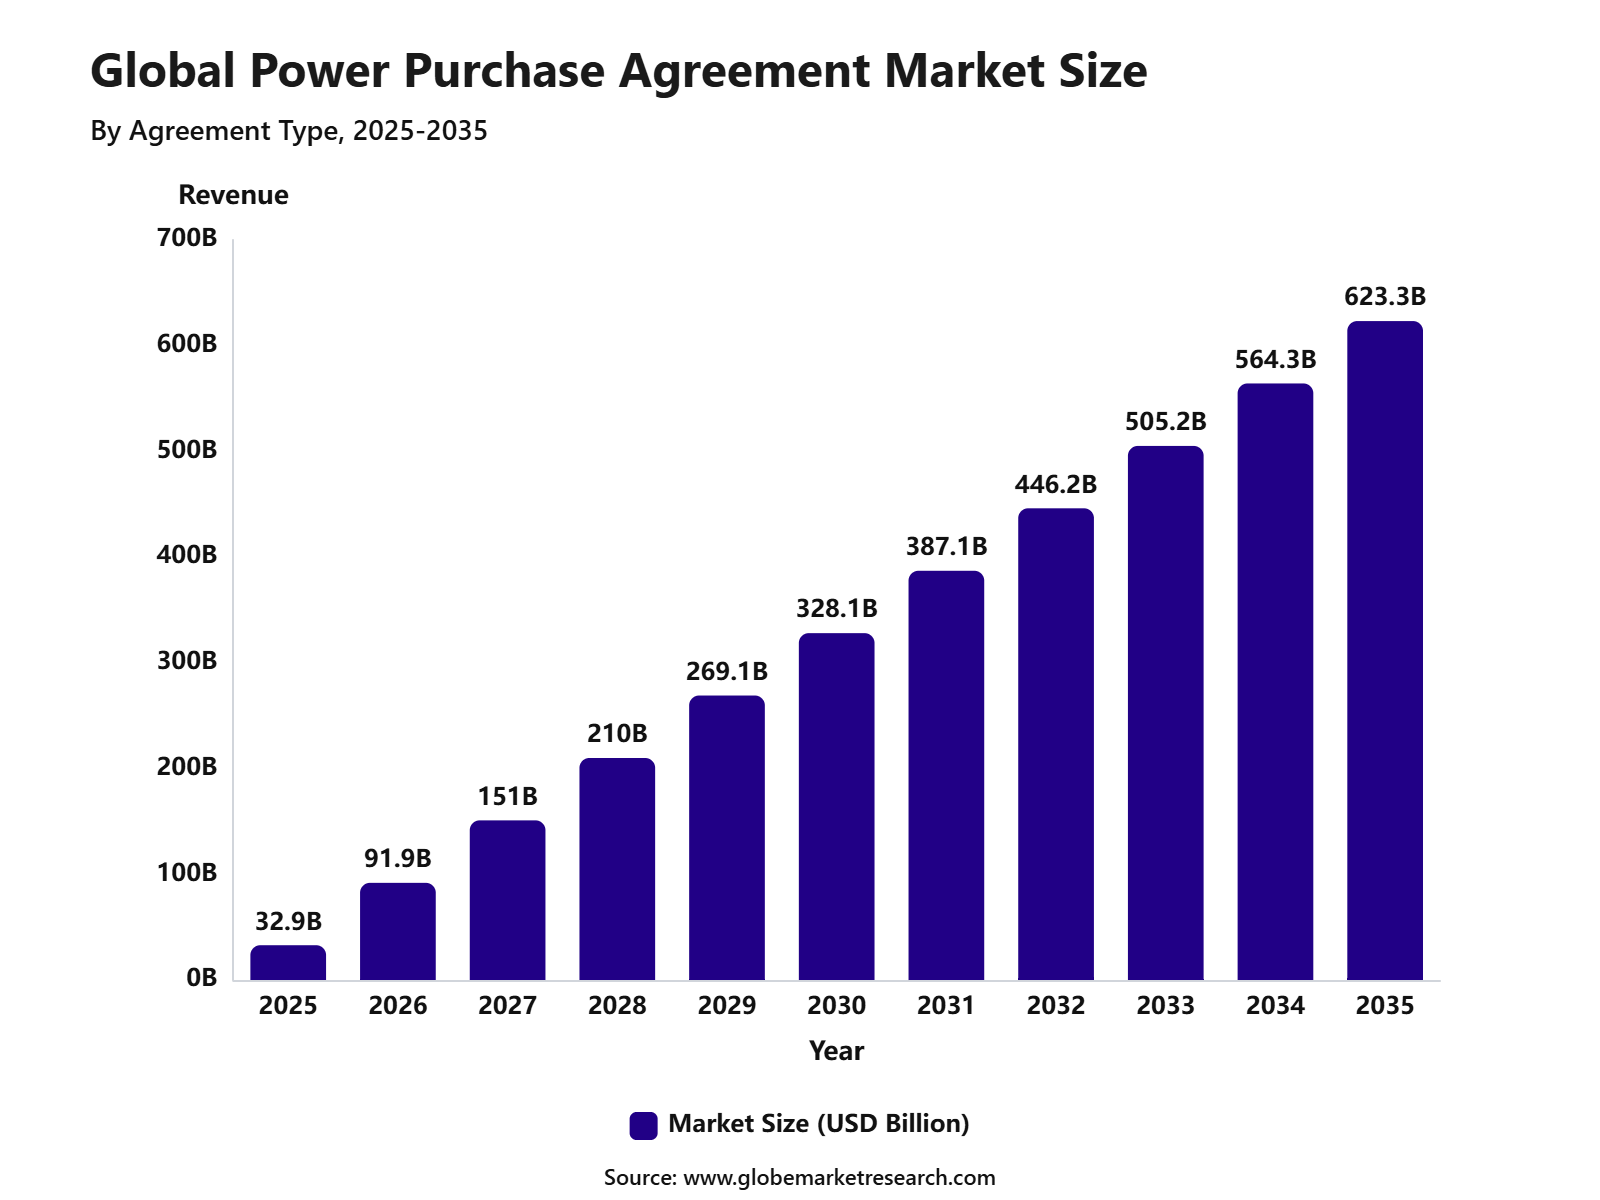 iThe graph shows projected market growth until 2035 based on CAGR analysis. Actual outcomes may vary depending on changing demand, competition, and economic factors.To gain greater insights - request a sample report PDF
Key Insight Summary
Physical PPAs dominated the market with 48.5% share in 2025, supported by direct electricity delivery, long-term price stability, and strong demand from large energy buyers.
Solar PPAs led by energy source with 47.2% share in 2025, driven by falling solar power costs, faster project development, and rising corporate renewable energy procurement.
Commercial and industrial buyers accounted for 49.9% share in 2025, supported by growing demand for clean electricity, cost control, and long-term energy security.
The 10 to 15 years contract duration segment held 43.6% share in 2025, as buyers and developers prefer balanced agreements with stable pricing and manageable contract risk.
North America dominated the power purchase agreement market with 40.8% share in 2025, supported by strong renewable energy projects, corporate clean energy targets, and favorable policy support.
The U.S. power purchase agreement market was valued at USD 11.9 billion and is projected to grow at a CAGR of 34.6%.
Key Power Purchase Agreement Statistics
BloombergNEF reported that companies signed 55.9 GW of clean energy PPAs in 2025, representing a 10% year-on-year decline.
2,916 corporate PPAs signed between 2015 and 2024, which supported around 301 GW of renewable energy projects.
The International Energy Agency expects global renewable electricity capacity additions to total 4,600 GW between 2025 and 2030
Renewables are projected to account for 43% of global electricity generation by 2030.
Solar PV and wind are expected to drive most of this growth, accounting for 96% of renewable capacity expansion.
RE-Source Platform reported that the number of renewable PPAs signed in Europe dropped by 60% compared with the same period in 2024, while contracted capacity declined by 40%.
80% of corporate renewable PPAs signed to date are linked to new renewable assets. These contracts usually have a duration of 10 to 20 years, which helps developers secure project financing and helps buyers access long-term renewable electricity.
RENA reported that in 2024, onshore wind had a global average levelized electricity cost of USD 0.034 per kWh, while solar PV averaged USD 0.043 per kWh.
By Agreement Type
Physical PPAs dominated the Power Purchase Agreement Market with 48.5% share in 2025. This segment is supported by buyers that want direct electricity supply from renewable energy projects, along with clearer energy delivery terms and stronger control over procurement.
Physical PPAs are widely used by commercial, industrial, and utility buyers because they can support long-term energy cost planning. They are also important where buyers want renewable electricity linked to specific projects, grid delivery points, and energy consumption needs.
By Energy Source
Solar PPAs led the market with 47.2% share in 2025. The segment is supported by lower solar project costs, faster installation timelines, and strong demand from corporate buyers seeking renewable electricity procurement.
Solar remains one of the most preferred sources for new PPA contracts because project supply is broad across utility-scale and distributed generation markets. The IEA stated that solar PV is expected to represent nearly 80% of global renewable electricity capacity expansion between 2025 and 2030, which supports the strong role of solar PPAs in future procurement.
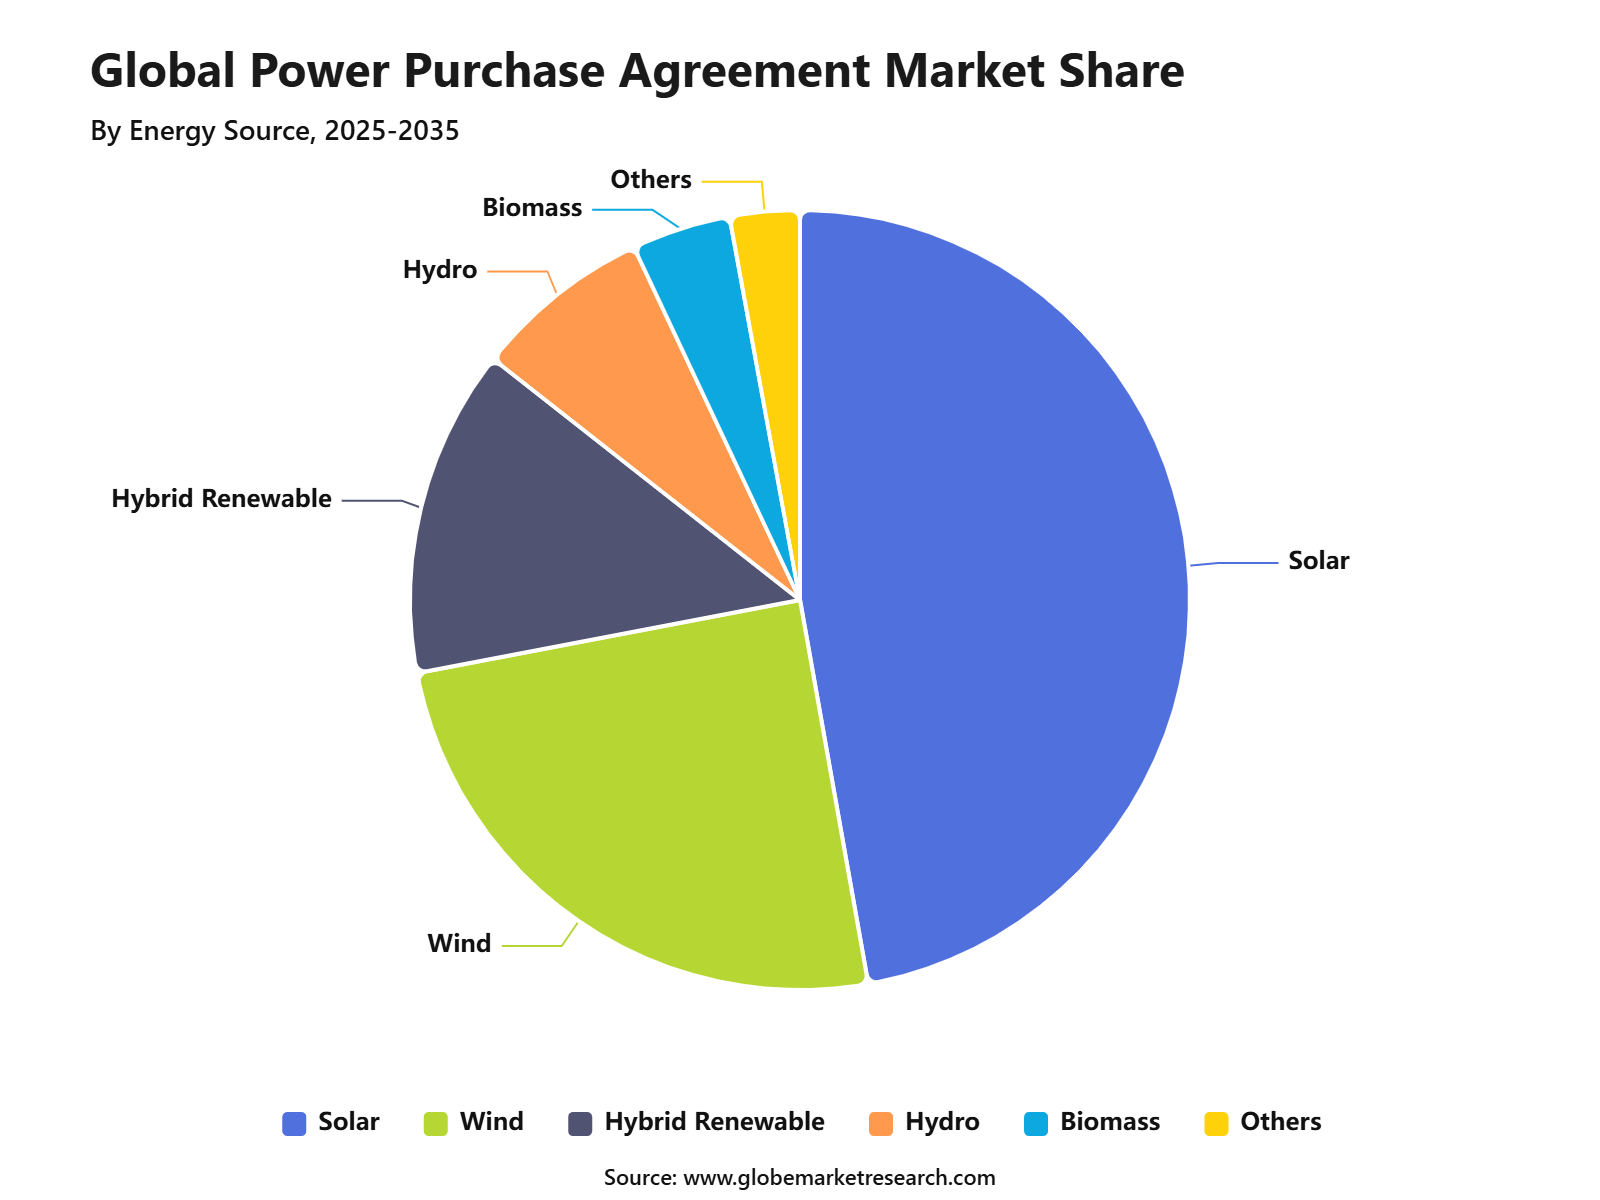 iThe graph shows projected market growth until 2035 based on CAGR analysis. Actual outcomes may vary depending on changing demand, competition, and economic factors.To gain greater insights - request a sample report PDF
By Buyer Type
Commercial and industrial buyers led the market with 49.9% share in 2025. This growth is supported by rising electricity demand from data centers, manufacturing units, retail chains, technology firms, logistics operators, and large office campuses.
These buyers prefer PPAs because they help manage electricity price risk and support renewable energy targets. The IEA has stated that corporate PPAs, utility contracts, and merchant plants are expected to account for 30% of global renewable capacity expansion to 2030, showing the growing importance of large electricity buyers in renewable project development.
By Contract Duration
The 10 to 15 years segment led the Power Purchase Agreement Market with 43.6% share in 2025. This duration is preferred because it gives buyers long-term price visibility while allowing developers to secure stable revenue for project financing.
A 10 to 15 years contract also offers flexibility compared with very long agreements. It is suitable for companies that want renewable electricity procurement, but still need room to adjust energy sourcing strategies as prices, regulations, and technology options change.
By Regional Analysis
North America dominated the Power Purchase Agreement Market with 40.8% share in 2025. The region’s leadership is supported by strong renewable energy procurement, large corporate power demand, advanced project development, and mature electricity contracting structures.
The U.S. remains the leading country in the region, supported by strong demand from data centers, technology companies, manufacturers, and large commercial electricity users. Reuters reported that the U.S. clean energy PPA market is being reshaped by AI-driven data center demand, while North American solar and wind PPA prices increased by 9% in Q4 2025.
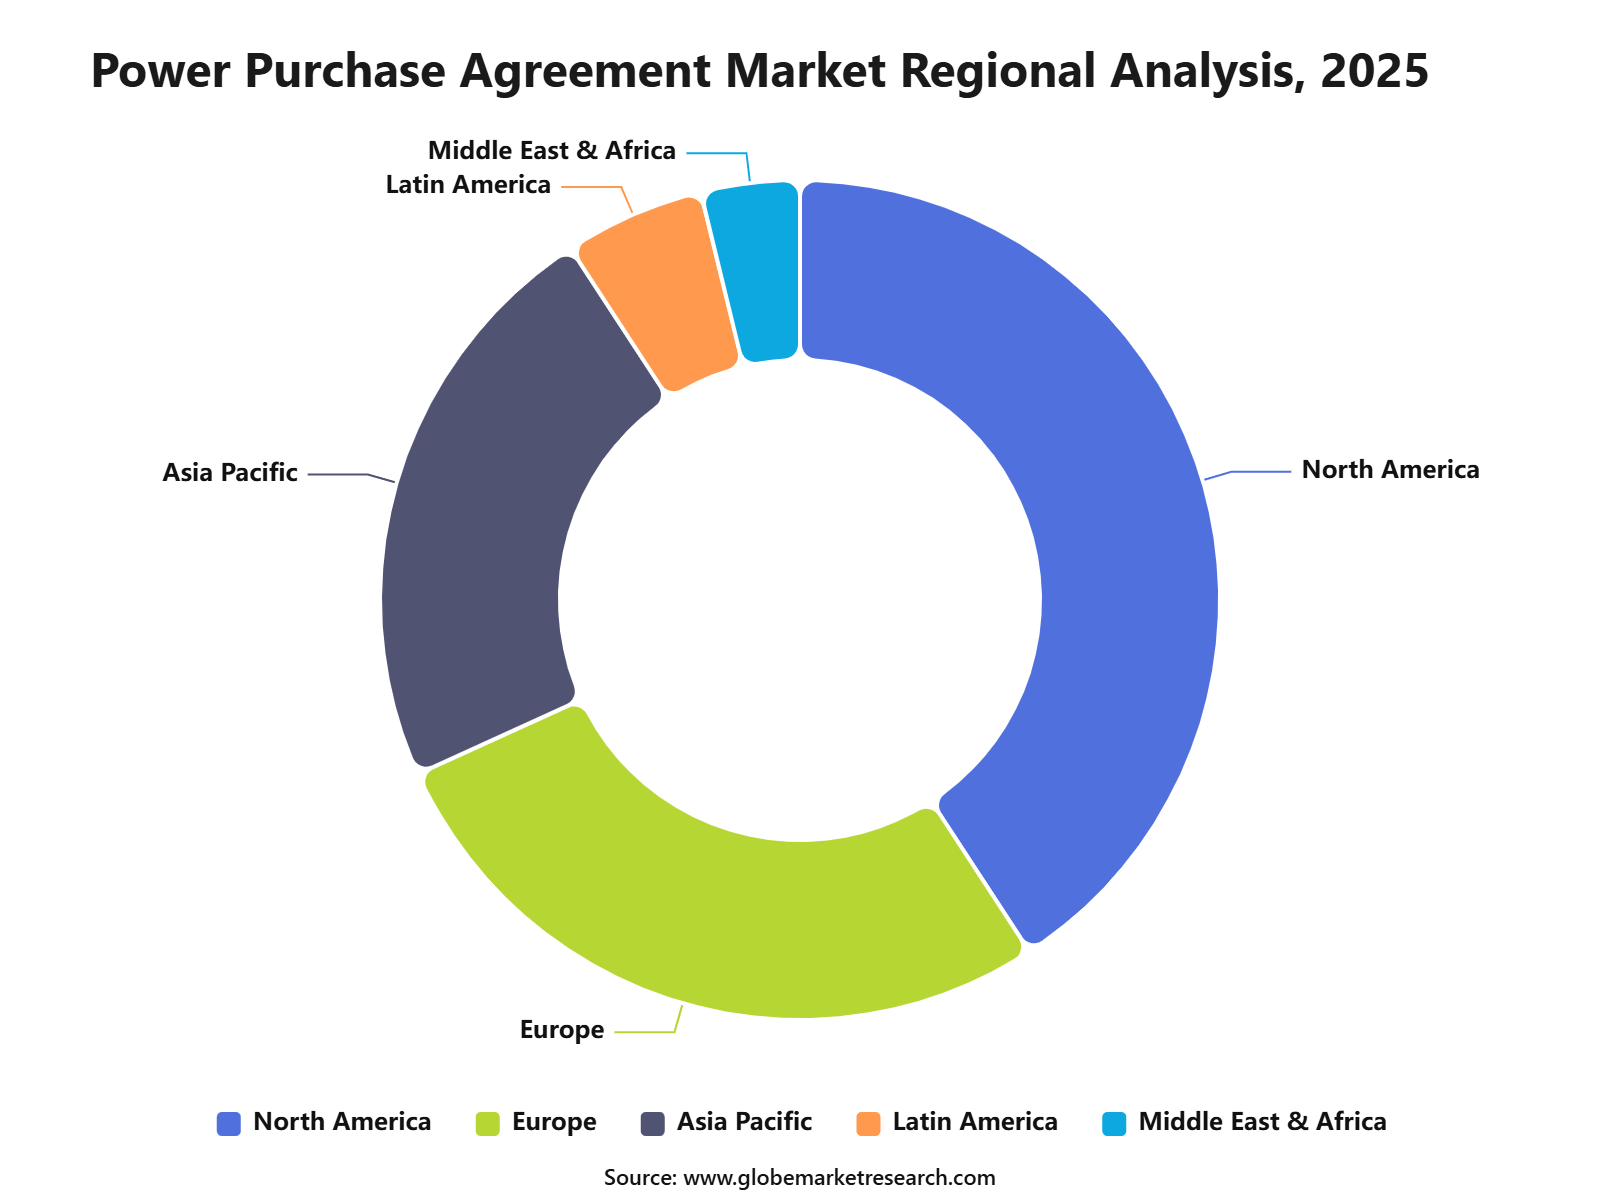 iThe graph shows projected market growth until 2035 based on CAGR analysis. Actual outcomes may vary depending on changing demand, competition, and economic factors.To gain greater insights - request a sample report PDF
The U.S. Power Purchase Agreement Market was valued at USD 11.9 billion in 2025 and is projected to grow at a CAGR of 34.6%. Growth is being supported by rising clean electricity procurement, corporate sustainability targets, and the need for long-term power supply security.
The country is also seeing stronger demand from energy-intensive sectors such as data centers, cloud infrastructure, manufacturing, and industrial operations. In Q2 2025, LevelTen Energy noted that load-serving entities, technology companies, and corporate buyers had a growing near-term need for power in the U.S., supported by data center buildout and grid demand pressures.
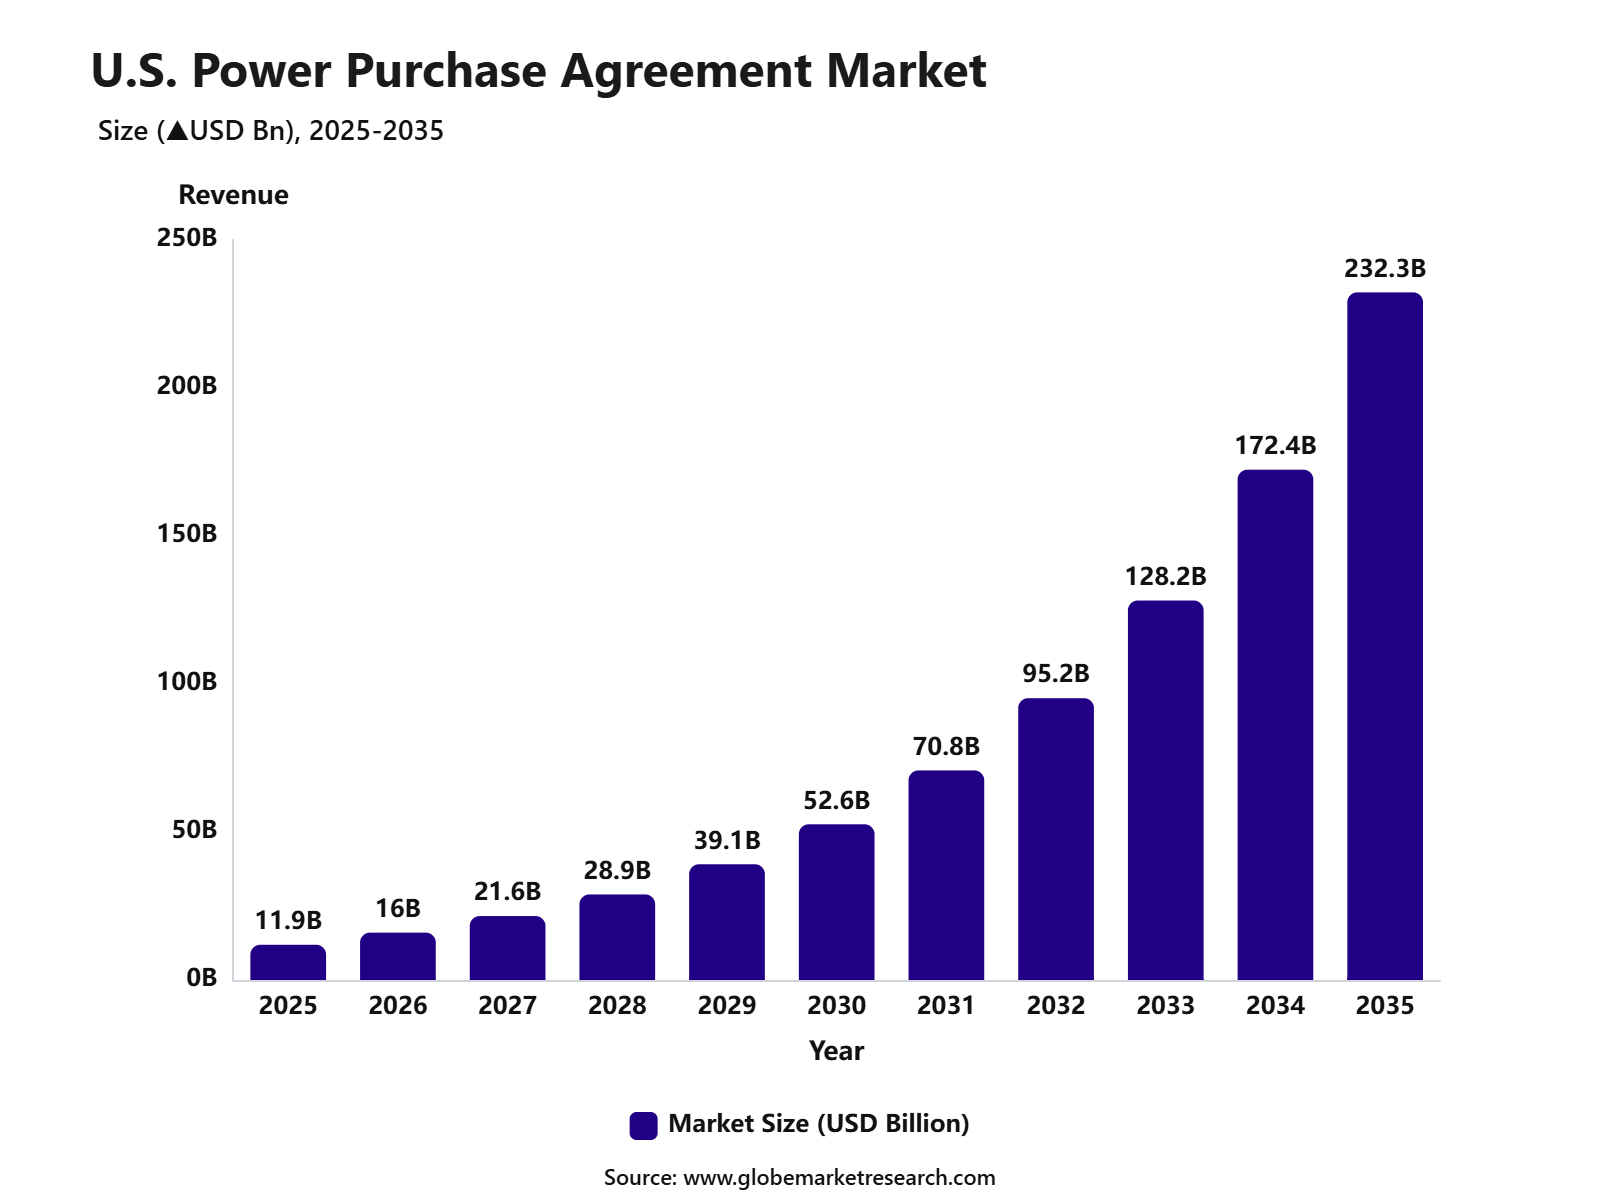 iThe graph shows projected market growth until 2035 based on CAGR analysis. Actual outcomes may vary depending on changing demand, competition, and economic factors.To gain greater insights - request a sample report PDF
Growth Factors
The market is supported by the rapid expansion of solar and wind power projects. Solar PPAs are becoming more attractive because solar projects can often be deployed faster than many conventional power assets. Wind PPAs remain important for buyers seeking large-scale renewable supply and stable generation profiles across regions.
The IEA expects solar PV and wind to account for 95% of all renewable capacity additions through 2030, which creates a strong project pipeline for future PPA activity. Policy support is another important growth factor for the Power Purchase Agreement Market. Clean energy standards, renewable procurement targets, tax incentives, grid modernization programs, and corporate climate commitments are improving the business case for long-term renewable contracts.
The IEA noted that climate and energy security policies in nearly 140 countries have helped make renewables more cost-competitive with fossil-fuel power plants. This policy environment is expected to strengthen the use of PPAs as a financing and procurement mechanism for renewable projects.
Top Emerging Trends
One of the top emerging trends is the rising adoption of corporate renewable PPAs. Large companies are increasingly signing long-term contracts directly with renewable power developers instead of relying only on utility-supplied electricity. This trend is being supported by stronger sustainability reporting, rising electricity demand, and the need for energy price stability. RE100 members continue to expand renewable electricity use, with strong progress reported in markets such as Japan, China, India, and Vietnam.
Another important trend is the growth of hybrid PPAs that combine solar, wind, and battery storage. These agreements help buyers manage intermittency and improve the reliability of renewable electricity supply. Battery storage is becoming more important because it can shift renewable power to periods of higher demand and improve grid flexibility. In the U.S., battery storage increased its share of PPA announcements in 2024, while solar PPAs rose strongly and remained a key driver of clean power contracting.
Drivers Impact Analysis
Impact Factor | Estimated CAGR Impact | Regional Relevance | Market Impact |
|---|---|---|---|
Rising corporate renewable energy procurement | +8.6% | North America, Europe, Asia Pacific | Drives long-term clean power contracts. |
Growth in utility-scale solar and wind projects | +7.9% | U.S., China, India, Europe, Australia | Expands renewable PPA availability. |
Demand for electricity price stability | +6.8% | Global, commercial and industrial buyers | Supports long-term contract adoption. |
Favorable clean energy policies | +6.4% | U.S., Europe, India, GCC | Encourages renewable power purchasing. |
Increasing decarbonization commitments | +6.1% | Global, large enterprises | Supports clean energy sourcing. |
Restraints Impact Analysis
Impact Factor | Estimated CAGR Impact | Regional Relevance | Market Impact |
|---|---|---|---|
Complex contract structures | -4.2% | Global | Slows buyer decision-making. |
Power price volatility | -3.8% | Europe, U.S., Asia Pacific | Raises contract risk. |
Grid connection delays | -3.5% | U.S., Europe, India, Australia | Delays project execution. |
Credit risk of offtakers | -3.1% | Emerging markets, SMEs | Limits contract bankability. |
Regulatory uncertainty | -2.9% | Europe, India, Latin America, MEA | Affects long-term planning. |
Opportunities Impact Analysis
Impact Factor | Estimated CAGR Impact | Regional Relevance | Market Impact |
|---|---|---|---|
Expansion of virtual PPAs | +7.8% | U.S., Europe, developed Asia | Supports flexible clean energy buying. |
Rising demand from data centers | +7.4% | U.S., Europe, India, Southeast Asia | Creates high-volume power demand. |
Growth in corporate net-zero targets | +7.1% | Global | Strengthens renewable procurement. |
Emerging market renewable deployment | +6.6% | India, Brazil, GCC, Southeast Asia | Opens new PPA opportunities. |
Hybrid renewable and storage projects | +6.2% | U.S., Europe, Australia, China | Improves power supply reliability. |
Challenges Impact Analysis
Impact Factor | Estimated CAGR Impact | Regional Relevance | Market Impact |
|---|---|---|---|
Contract negotiation complexity | -3.9% | Global | Extends deal closure timelines. |
Intermittency of renewable power | -3.4% | Solar and wind-heavy markets | Creates supply balancing needs. |
Limited buyer awareness | -2.8% | Emerging markets, SMEs | Slows adoption outside large firms. |
Transmission capacity constraints | -3.2% | U.S., Europe, India, Australia | Restricts project delivery. |
Changing energy market rules | -2.7% | Europe, North America, Asia Pacific | Increases compliance pressure. |
Key Market Segments
By Agreement Type
Physical PPA
Virtual PPA
Sleeved PPA
On-site PPA
Others
By Energy Source
Solar
Wind
Hybrid Renewable and Storage-backed Projects
Hydro
Biomass
Others
By Buyer Type
Commercial and Industrial Buyers
Utilities
Data Centers and Technology Companies
Government and Public Sector
Others
By Contract Duration
10 to 15 Years
Above 15 Years
5 to 10 Years
Less than 5 Years
Key Regions and Countries
North America
US
Canada
Europe
Germany
France
The UK
Spain
Italy
Rest of Europe
Asia Pacific
China
Japan
South Korea
India
Australia
Singapore
Rest of Asia Pacific
Latin America
Brazil
Mexico
Rest of Latin America
Middle East & Africa
South Africa
Saudi Arabia
UAE
Rest of MEA
Recent Developments
April 2026 – Amazon Australia signed nine renewable power purchase agreements across New South Wales and Victoria. The deals will add 430 MW of clean energy capacity and bring Amazon’s renewable capacity in Australia to nearly 990 MW. The agreements support rising electricity demand from cloud computing and AI data center operations.
January 2026 – Meta announced additional 20-year nuclear energy agreements to purchase more than 2.1 GW of energy from Vistra’s nuclear plants in Ohio and Pennsylvania. This development shows that large technology buyers are expanding PPA strategies beyond solar and wind to secure reliable clean power for AI infrastructure.
December 2025 – Google and ReNew Energy Global signed a long-term agreement for a 150 MW solar project in Rajasthan, India. The project is expected to generate around 425,000 MWh of clean electricity annually and is scheduled for commissioning in 2026.
Report Scope
Report Highlights | Details |
|---|---|
Market Revenue (2025) | USD 32.9 Bn |
Forecast Revenue (2035) | USD 623.3 Bn |
CAGR (2025-2035) | 34.2% |
Base Year for Estimation | 2025 |
Historic Data | 2020-2024 |
Forecast Period | 2025-2035 |
Report Coverage | AI impact analysis, Revenue projections, company positioning, competitive analysis, growth drivers, and emerging market trends |
Segments Covered | By Agreement Type (Physical PPA, Virtual PPA, Sleeved PPA, On-site PPA, Others), By Energy Source (Solar, Wind, Hybrid Renewable and Storage-backed Projects, Hydro, Biomass, and Others), By Buyer Type (Commercial and Industrial Buyers, Utilities, Data Centers and Technology Companies, Government and Public Sector, Others), By Contract Duration (10 to 15 Years, Above 15 Years, 5 to 10 Years, Less than 5 Years) |
Regional Analysis | North America – US, Canada; Europe – Germany, France, The UK, Spain, Italy, Russia, Netherlands, Rest of Europe; Asia Pacific – China, Japan, South Korea, India, New Zealand, Singapore, Thailand, Vietnam, Rest of Latin America; Latin America – Brazil, Mexico, Rest of Latin America; Middle East & Africa – South Africa, Saudi Arabia, UAE, Rest of MEA |
Key companies profiled | ENGIE, Iberdrola, Ørsted, NextEra Energy Resources, EDP Renewables, RWE, EDF Renewables, Enel Green Power, and Statkraft, LevelTen Energy, Schneider Electric, South Pole, 3Degrees, and Edison Energy, Other Key Players |
Customization Scope | Tailored insights for specific regions, countries, and market segments can be provided. Additional report customization is available upon request. |
Competitive Landscape
The market is characterized by intense competition among established players and emerging companies. Strategic partnerships, mergers and acquisitions, and product innovation are key strategies employed by market participants.
Key Market Players
ENGIE
Iberdrola S.A.
Ørsted A/S
NextEra Energy Resources
EDP Renewables
RWE AG
EDF Renewables
Statkraft AS
Enel Green Power
Vattenfall AB
BP Energy
Brookfield Renewable Partners
Others Key Players
Research Methodology
This market study is prepared using a combination of primary and secondary research. Primary research includes discussions with manufacturers, suppliers, distributors, consultants, industry experts, and end users. Secondary research covers company reports, government databases, trade associations, technical publications, regulatory sources, and trusted industry documents. The collected information is used to assess market demand, pricing trends, technology adoption, competitive activity, and regional performance.
AI language models are not used as primary data sources, and publicly available AI-generated content is not treated as market evidence. Computational tools may be used to support data processing, translation, data classification, and pattern identification. However, every published assessment is supported by verified sources, human review, and primary market discussions.
Market estimates are developed through top-down and bottom-up approaches and validated using data triangulation. Revenue, production, shipment, pricing, and application-level data are compared across multiple sources. Forecasts consider economic conditions, regulatory changes, investment activity, innovation, supply chain developments, and industry risks. All findings are reviewed through source verification and internal quality checks before publication.
Part I
Source Management & Input Data Standards
Who provides data, how sources are qualified, and what types of evidence are admissible.
Part II
Research Scope & Market Coverage
How we define the markets we assess and the parameters that govern each product.
Part III
Data Collection, Verification & Submission
The mechanics of gathering, cross-checking, and hierarchically ranking evidence.
Part IV
Assessment Determination & Quality Controls
How raw data becomes a published assessment — normalisation, expert judgement, and outlier exclusion.
Part V
Publication, Corrections & Revision
Our publication schedule, corrections policy, and methodology review cycle.
Part VI
Independence, Ethics & Complaints
Conflict-of-interest policies, editorial independence, and how clients raise concerns.
Google · Preferred Sources
Don't miss the latest market research insights and industry updates on Google.
Add Globe Market Research as a preferred source in the Google app to see our reports, analysis, and market stories in your news suggestions.
Meet the Team
This report was prepared by our expert analysts with deep industry knowledge and research experience.
Kimaya brings more than five years of experience in market research, content review, and industry analysis to Globe Market Research. She plays an important role in maintaining the accuracy, clarity, consistency, and relevance of research content across a wide range of industries. Her responsibilities include reviewing market data, segment analysis, competitive landscapes, industry trends, company developments, and strategic insights. Each report is carefully assessed to ensure that the findings are supported by reliable data, presented in a structured format, and aligned with the information needs of business decision-makers. Kimaya has research experience across healthcare, information technology, consumer goods, and several cross-industry domains.
Pratiksha K. is a Senior Research Analyst with more than five years of experience in market research, industry analysis, competitive intelligence, and business strategy. She has contributed to detailed market reports, customized research studies, company profiling, market sizing, trend analysis, and strategic consulting projects for clients across different regions. Her industry expertise covers Chemical and Material, Consumer Goods, Food & Beverages and Energy & Power. She closely evaluates changing customer requirements, technology developments, regulatory conditions, supply chain structures, investment activity, and competitive strategies to provide clear and practical market insights.
Frequently Asked Questions
Related Reports
More in Energy and Power
Smart Meter Market Size to hit USD 67.3 billion by 2035
Smart Meter Market Size, Share, Trends and Growth Analysis Report By Component (Hardware, Software), By Type (Smart Electric Meter, Smart Water Meter, Smart Gas Meter), By Technology (Automatic Meter Reading, Advanced Metering Infrastructure), By End Use (Residential, Commercial, Industrial), By Regional Insights, Technology Trends, Competitive Landscape, Strategic Opportunities and Growth Forecast, 2026-2035
Solar Energy Market to Hit USD 1,400.7 Billion by 2035
Solar Energy Market Size, Share, Analysis By Technology (Solar Photovoltaic, Concentrated Solar Power, Solar Thermal), By Module Type (Monocrystalline, Polycrystalline, Thin Film, Others), By Grid Connectivity (On-Grid, Off-Grid, Hybrid), By Application (Residential, Commercial, Industrial, Utility-Scale), By End Use (Electricity Generation, Heating and Cooling, Water Heating, Agricultural Applications, Others), By Regional Insights, Business plan and Project Report, Investment Opportunities, Profitability, Industry Trends, Leading Companies and Growth Forecasts by 2026-2035
Renewable Energy Market to Hit USD 5.3 Trillion by 2035
Renewable Energy Market Size, Share, Analysis By Energy Source (Solar Energy, Wind Energy, Hydropower, Bioenergy, Geothermal Energy, Ocean Energy), By Deployment Model (Utility-Scale Projects, Distributed Generation Systems), By Grid Integration (On-Grid Systems, Off-Grid Systems), By Energy Storage Coupling (Standalone Generation, Hybrid Systems with Energy Storage), By End User (Utilities, Commercial and Industrial, Residential), By Regional Insights, Business plan and Project Report, Investment Opportunities, Profitability, Industry Trends, Leading Companies and Growth Forecasts by 2026-2035
Green Hydrogen Market to Hit USD 158.9 Billion by 2035
Green Hydrogen Market Size, Share, Analysis By Technology (Alkaline Electrolyzer, PEM Electrolyzer, Solid Oxide Electrolyzer Cell), By Distribution Channel (Pipeline, Cargo), By Application (Transport, Power Generation, Industrial, Building Heat, Others), By Regional Insights, Business plan and Project Report, Investment Opportunities, Profitability, Industry Trends, Leading Companies and Growth Forecasts by 2026-2035