

Revenue, 2025
$650.4 Bn
Forecast, 2035
$3,075.6 Bn
CAGR, 2025-2035
16.8%
Report Coverage
Global
Market Size and Forecast
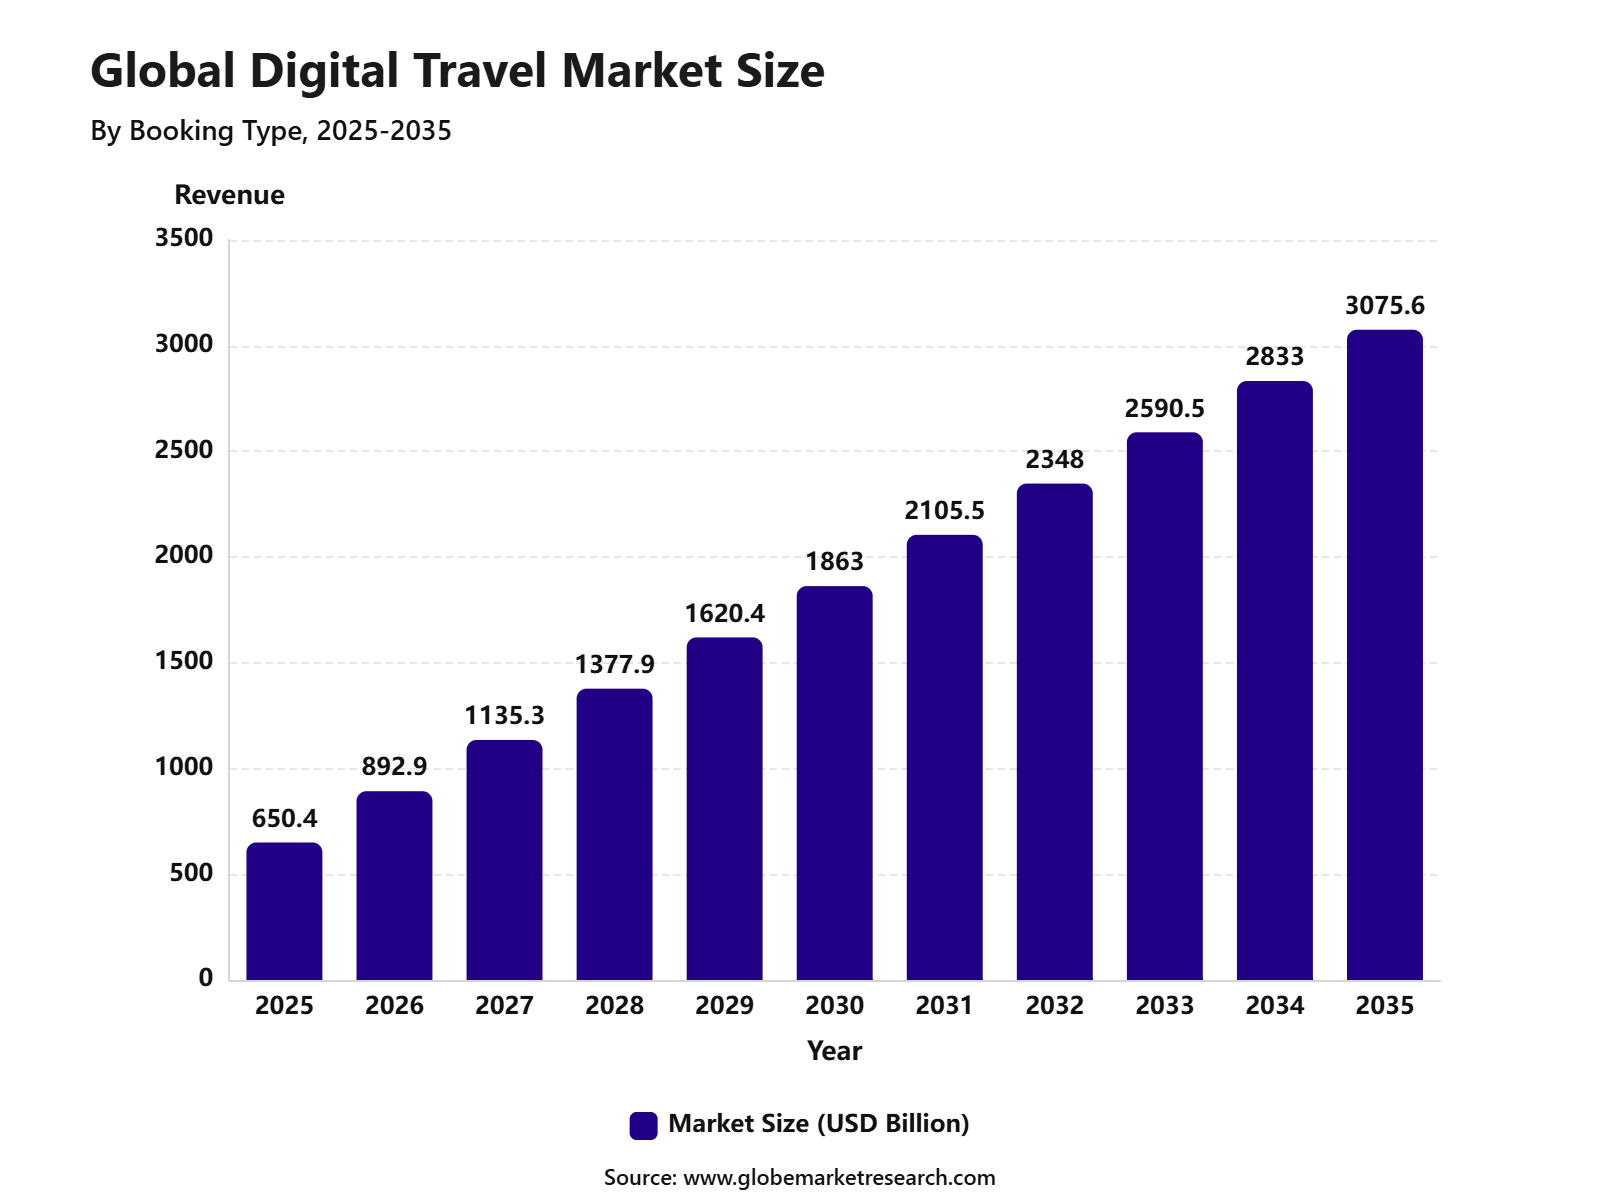
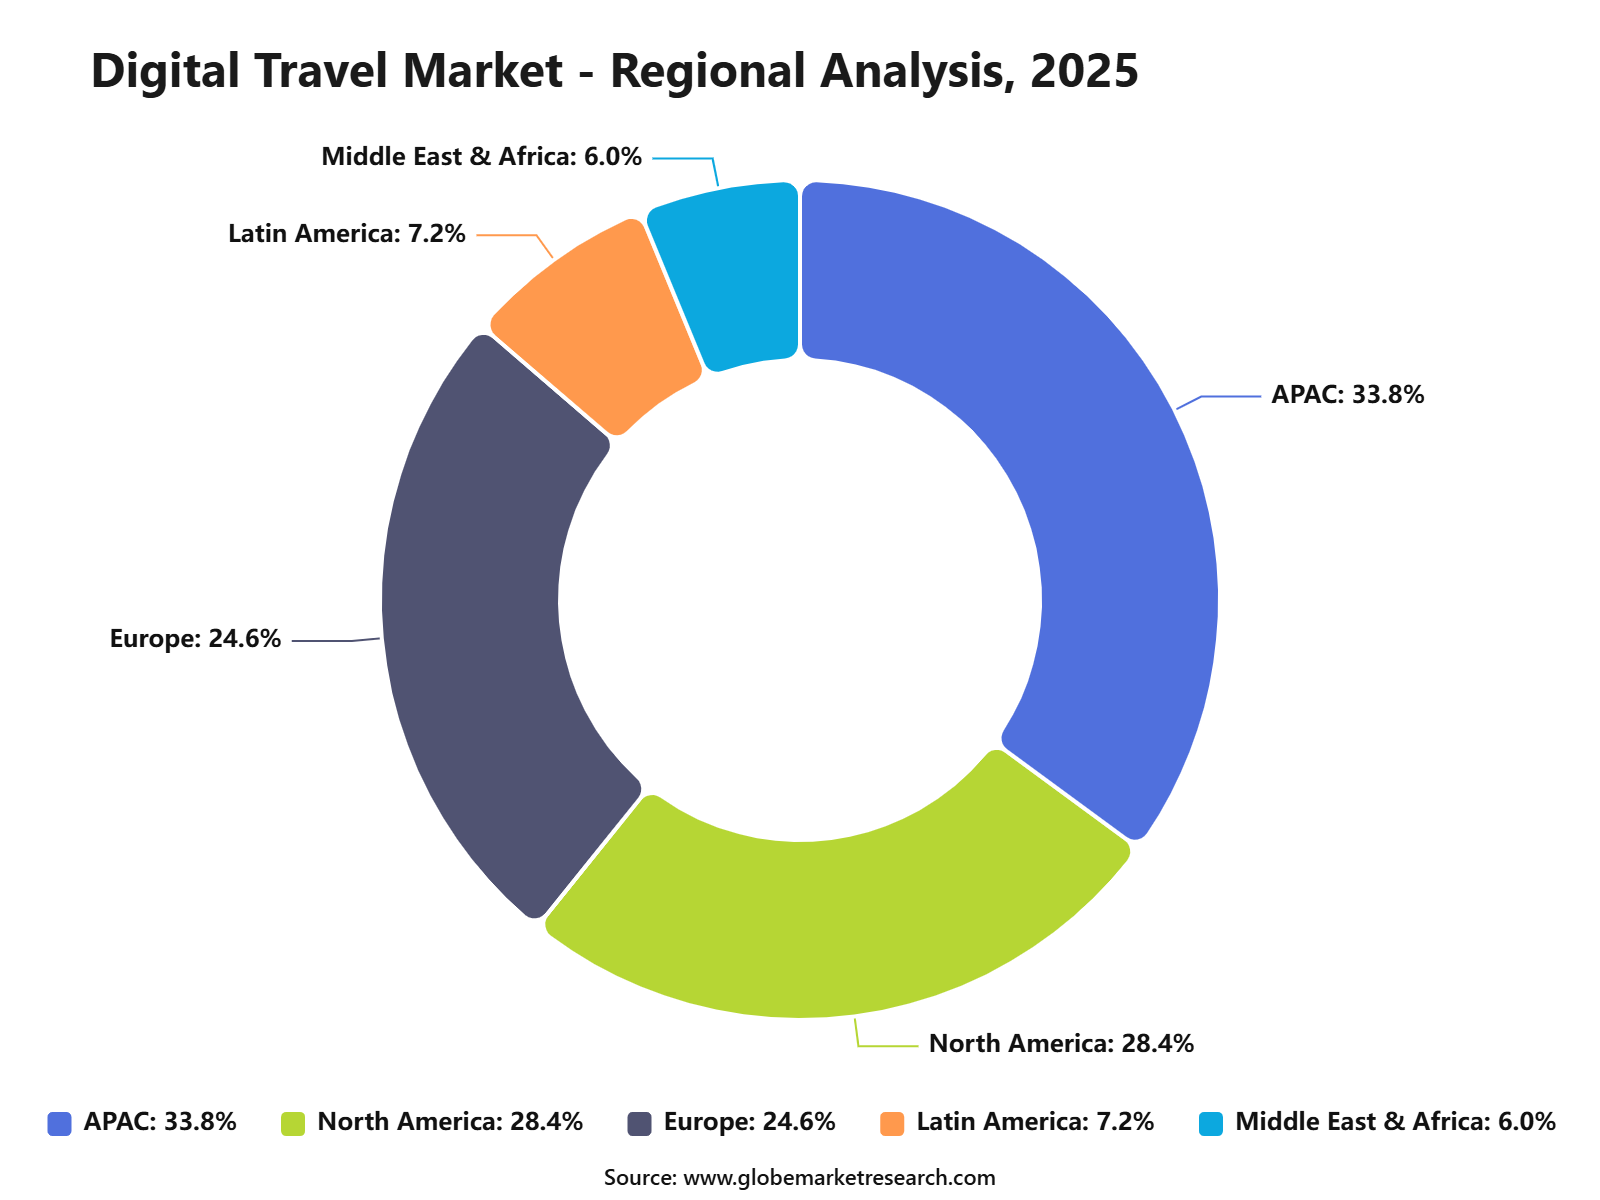
The Global Digital Travel Market reached USD 650.4 billion in 2025 and is expected to grow to USD 3,075.6 billion by 2035, registering a CAGR of 16.8%. Asia Pacific held the largest regional share of 33.8% in 2025, supported by rising internet access, mobile-first booking behavior, expanding middle-class travel demand, strong domestic tourism, and rapid adoption of online travel platforms across China, India, Japan, South Korea, and Southeast Asia.
The Digital Travel Market refers to the online ecosystem used for planning, comparing, booking, paying for, and managing travel services through websites, mobile apps, and digital platforms. It includes online flight booking, hotel booking, vacation packages, car rentals, travel insurance, experience booking, digital itinerary tools, travel marketplaces, and AI-based customer support. The market connects travelers with airlines, hotels, tour operators, transport providers, online travel agencies, and destination service providers through digital channels.
 iThe graph shows projected market growth until 2035 based on CAGR analysis. Actual outcomes may vary depending on changing demand, competition, and economic factors.To gain greater insights - request a sample report PDF
The market outlook remains positive as travel demand, mobile internet use, and online payment adoption continue to increase across both leisure and business travel. Global internet users reached 5.56 billion at the start of 2025, while smartphones accounted for almost 87% of mobile handsets in use, creating a strong base for app-based travel booking. Air travel demand also remained strong, with global passenger traffic rising 5.3% in 2025 and Asia Pacific airlines recording 10.9% growth in international passenger traffic.
Top Market Takeaways
Transportation booking led the market with 44.8% share. Growth was supported by online booking for flights, trains, buses, car rentals, and ride services.
Desktop held the largest platform share at 69.3%. Consumers preferred desktops for price comparison, secure payments, and detailed trip planning.
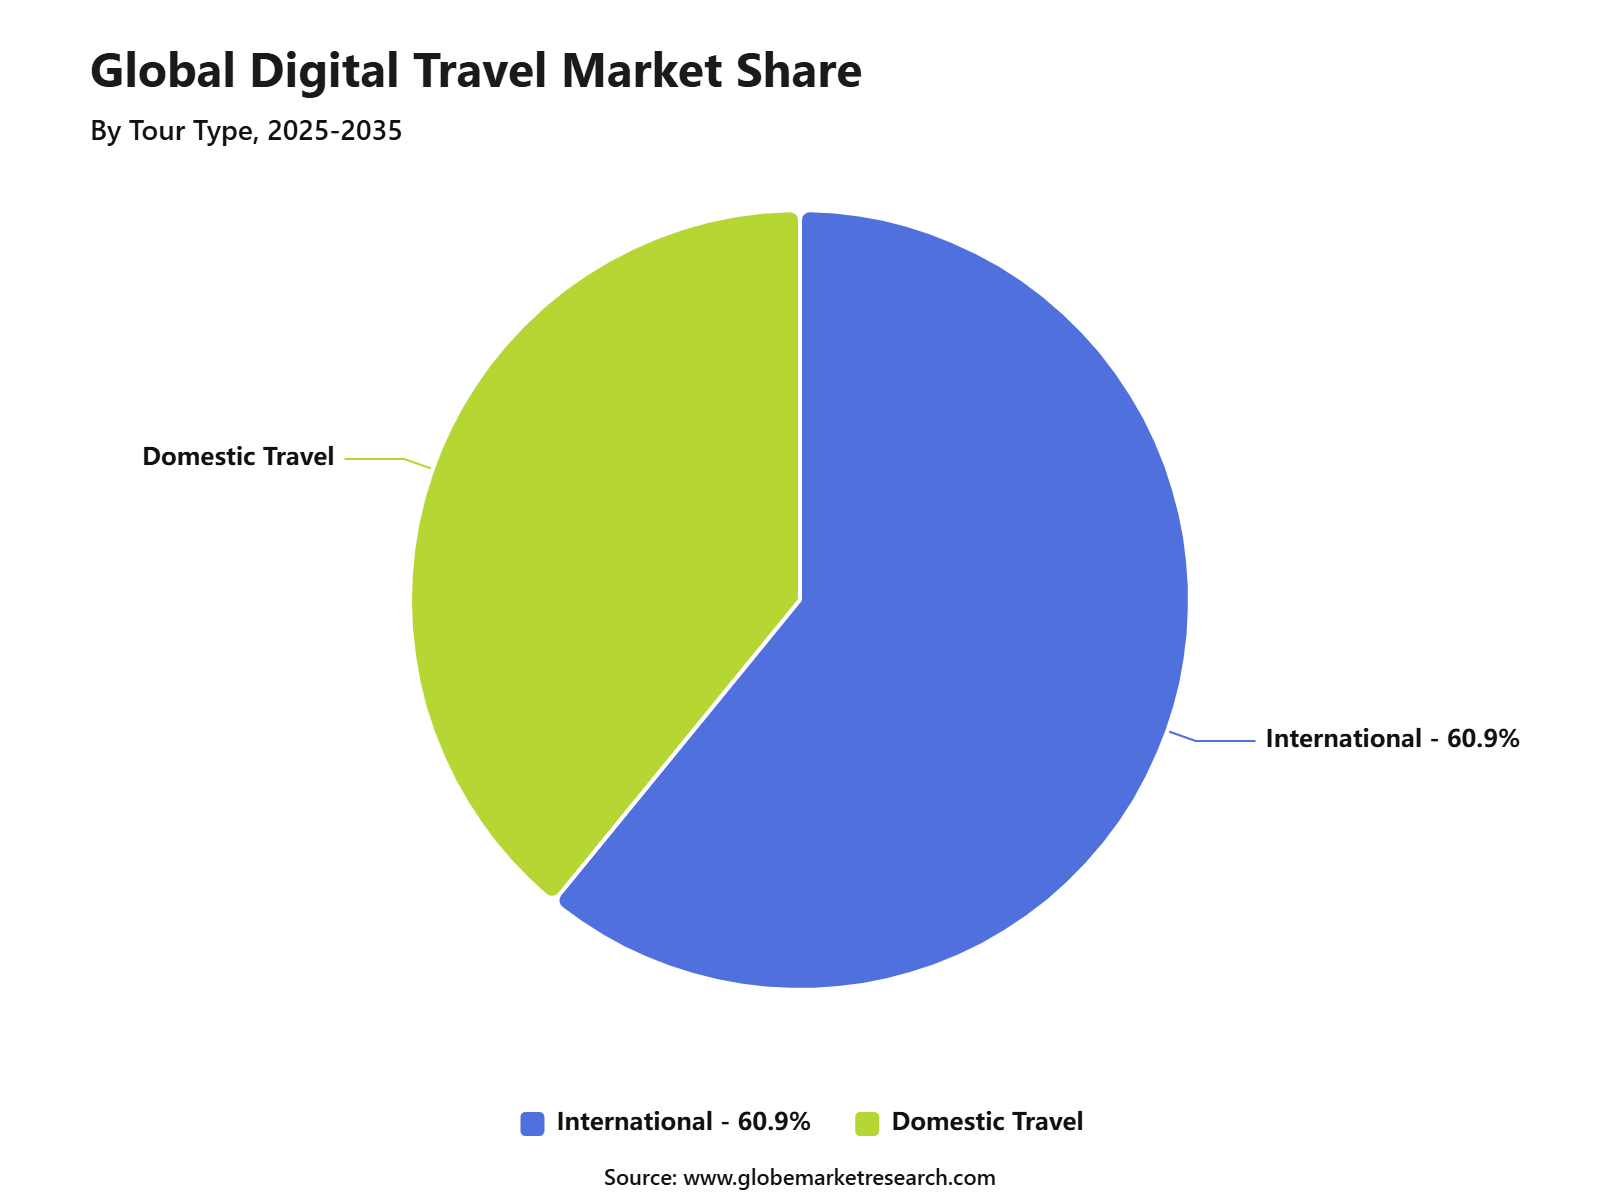
International travel accounted for 60.9% share. This was driven by rising overseas tourism, business travel, and easy online booking access.
Women held 54.2% share in the consumer orientation segment. Higher use of digital travel platforms supported this lead.
The 32 to 43 years age group held 35.1% share. This group showed strong demand due to higher income and frequent travel needs.
Asia Pacific led the market with 33.8% share. Growth was supported by rising internet use, mobile payments, and increasing travel demand.
Role of AI in Digital Travel
Artificial intelligence is becoming a core part of digital travel because travelers now expect faster planning, personalized choices, real-time support, and easier booking. The need is strong because global travel demand remains high. International tourist arrivals grew by 4% in 2025 and reached about 1.52 billion travelers, while international tourism was expected to grow another 3% to 4% in 2026. This gives travel platforms a clear reason to use AI for better search, smarter recommendations, and faster customer service.
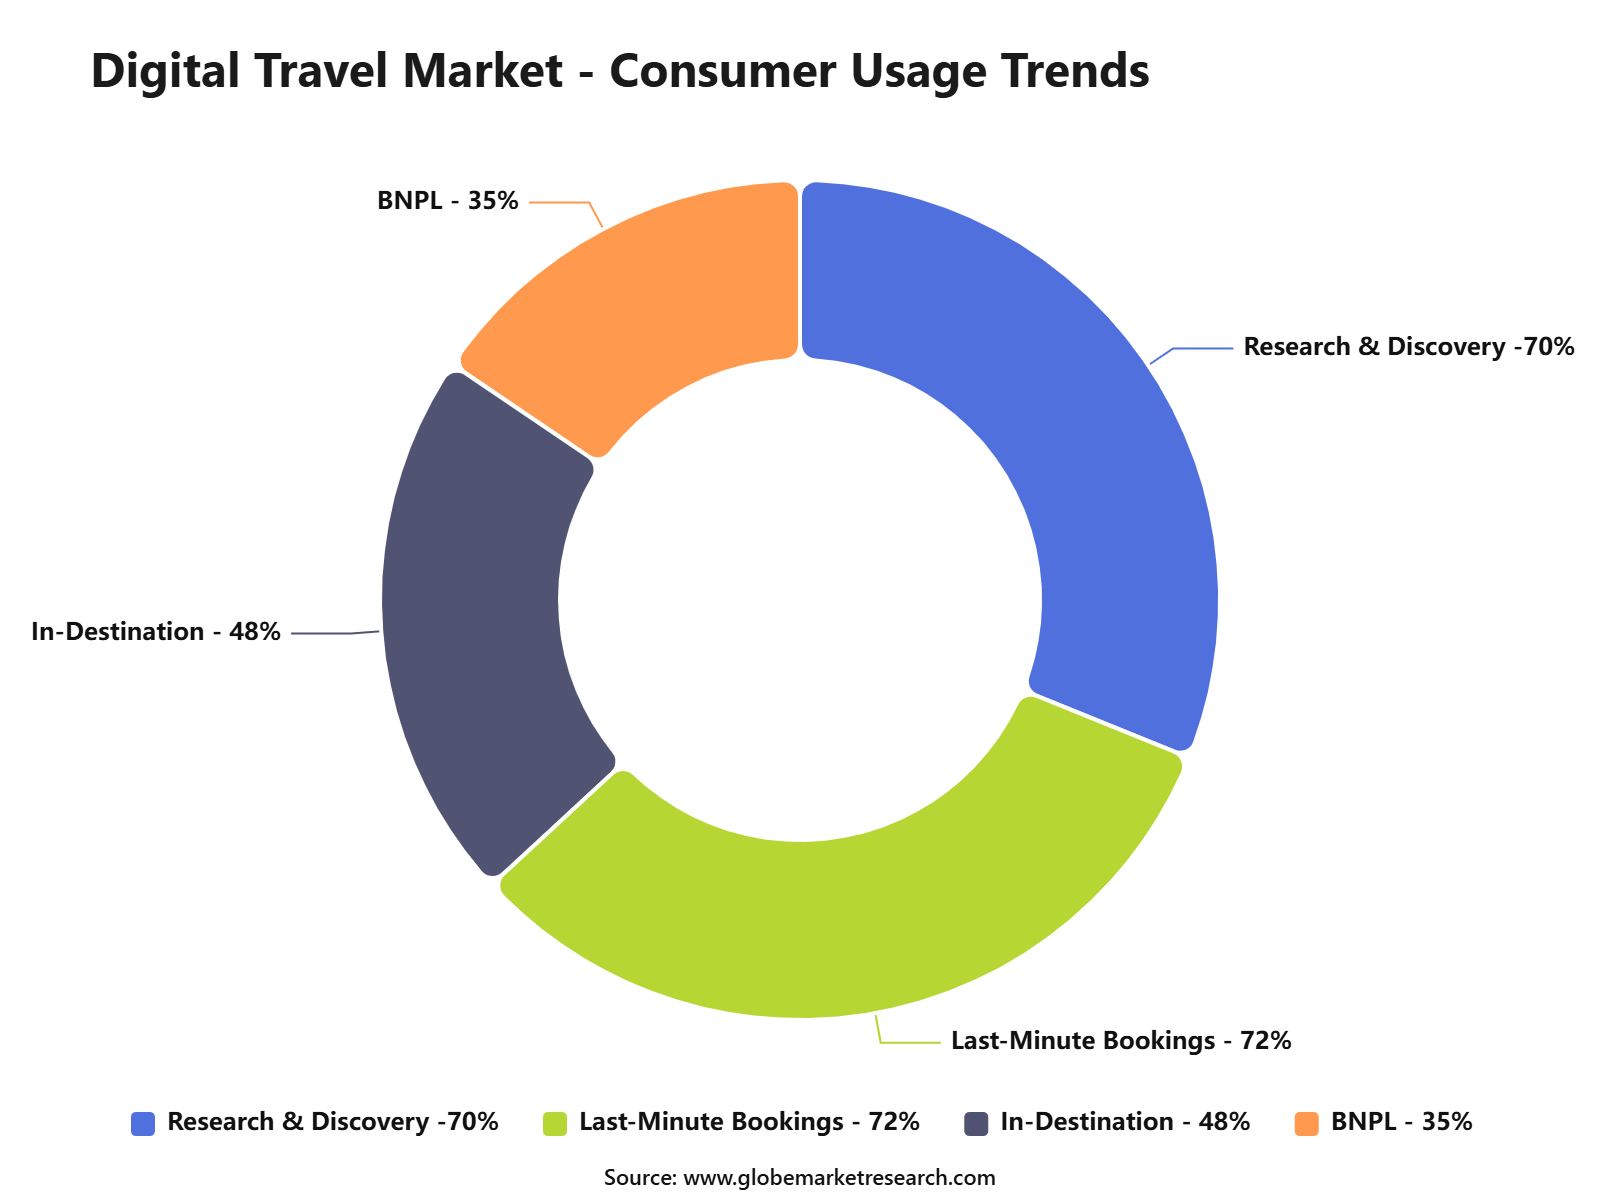
AI is changing the way travelers discover destinations. Instead of searching through many websites, users can ask AI tools for trip ideas, hotel comparisons, flight options, local food, transport, and full itineraries. In May 2026, traffic from AI sources to U.S. travel websites increased by 194% year-on-year and was up 2,215% compared with October 2024. AI-referred travelers also spent 70% longer on websites, showed 21% higher engagement, and had 41% lower bounce rates, showing that AI is sending more informed users to travel platforms.
AI is also improving trip planning and booking decisions. A 2025 global AI travel sentiment report found that 67% of consumers had already used AI in some part of travel, and among those users, 98% used it for planning or booking. Travelers used AI mainly to research destinations and the best time to visit, find local experiences, and get restaurant suggestions. This shows that AI is not only a support tool, but also an early-stage decision engine in the digital travel journey.
 iThe graph shows projected market growth until 2035 based on CAGR analysis. Actual outcomes may vary depending on changing demand, competition, and economic factors.To gain greater insights - request a sample report PDF
By Booking Type
Transportation booking accounted for the leading share of 44.8% in the Digital Travel Market. The segment includes online booking of flights, trains, buses, rental cars, ride-hailing services, and other mobility options used by travelers before and during their trips. The growth of transportation booking can be attributed to the rising use of digital platforms for route comparison, fare tracking, seat selection, instant ticketing, and flexible cancellation options.
Air passenger demand, cross-border travel recovery, and stronger adoption of mobile and web-based ticketing systems have supported the segment’s high share. The segment is expected to remain important as travelers increasingly prefer integrated travel planning. Platforms that combine transport, accommodation, insurance, loyalty benefits, and real-time travel updates are likely to improve customer retention and booking conversion.
By Platform
Desktop held the dominant platform share of 69.3% in the Digital Travel Market. The segment remained strong because many travelers still prefer larger screens while comparing destinations, checking multiple tabs, reviewing policies, and completing high-value bookings. Desktop usage is especially relevant for international trips, family travel, business travel, and multi-city itineraries where users need detailed information before payment.
Public digital data shows that laptops and desktops continue to be widely used in developed regions, including Europe and the United States, supporting their role in complex online travel purchases. The continued strength of desktop platforms also shows the importance of website performance, secure payment design, transparent pricing, and easy comparison tools. Travel brands that optimize desktop journeys with fast checkout, visible trust signals, and clear refund information are better positioned to convert research-heavy users.
By Tour Type
International travel led the tour type segment with a 60.9% share in the Digital Travel Market. The segment benefits from rising outbound tourism, higher air connectivity, easier visa processes in several destinations, and stronger consumer interest in culture, leisure, events, wellness, and business travel. International travelers are more likely to use digital platforms because trip planning often involves flights, hotels, local transport, insurance, foreign exchange, destination activities, and documentation.
This makes online travel platforms valuable because they help users compare prices, read reviews, check availability, and manage bookings from one place. The segment outlook remains positive as global tourist arrivals continue to recover and travelers become more confident in cross-border movement. Demand is expected to be supported by premium leisure travel, experiential tourism, group holidays, and personalized travel packages across major global destinations.
 iThe graph shows projected market growth until 2035 based on CAGR analysis. Actual outcomes may vary depending on changing demand, competition, and economic factors.To gain greater insights - request a sample report PDF
By Consumer Orientation
Women accounted for the leading consumer orientation share of 54.2% in the Digital Travel Market. This reflects the growing role of women in travel planning, destination selection, budget comparison, accommodation choice, and final booking decisions. Women travelers are increasingly influencing leisure travel, family travel, solo trips, wellness tourism, cultural tours, and women-only travel experiences.
Recent travel industry coverage also highlights that women influence a large share of travel decisions globally, which supports their strong position in digital travel demand. The segment is expected to create opportunities for platforms offering safety-focused information, verified reviews, flexible booking options, transparent pricing, and personalized destination recommendations. Travel companies that address convenience, trust, safety, and experience quality are likely to gain stronger engagement among women travelers.
By Region
Asia Pacific accounted for the leading regional share of 33.8% in the Digital Travel Market. The region’s strong position can be linked to its large internet user base, rising middle-class travel spending, strong airline connectivity, and fast adoption of online booking platforms across China, India, Japan, South Korea, Southeast Asia, and Australia.
The regional outlook remains positive as mobile payments, travel apps, digital wallets, loyalty programs, and AI-based trip planning tools become more widely used. Online travel companies are expected to gain from demand for affordable flights, flexible accommodation, personalized packages, and short-haul international trips across the region. This makes Asia Pacific a key growth center for digital travel platforms, especially among younger travelers, working professionals, and urban households.
 iThe graph shows projected market growth until 2035 based on CAGR analysis. Actual outcomes may vary depending on changing demand, competition, and economic factors.To gain greater insights - request a sample report PDF
Customer Acquisition Strategy
The Digital Travel Market is driven by rising online travel planning, higher use of mobile apps, wider digital payment adoption, and growing demand for simple booking across flights, hotels, transport, travel insurance, and destination activities. The go-to-market strategy should focus on online travel agencies, airline and hotel direct-booking platforms, metasearch engines, travel apps, loyalty programs, and bundled travel services. International tourism continued to improve in 2026, with global tourist arrivals rising 2% in Q1 2026, despite uncertainty in some regions.
Sales economics are shaped by commission income, service fees, advertising revenue, payment charges, cancellation policies, supplier margins, and customer acquisition costs. Stronger revenue conversion can be achieved through personalized offers, transparent pricing, verified reviews, flexible refund options, and smooth mobile-to-desktop booking journeys. Air travel remains a major transaction driver, as IATA forecast 4.9% year-on-year passenger traffic growth in 2026, led by 7.3% growth in Asia Pacific, which supports higher booking activity across air tickets, hotels, and local travel services.
Revenue Potential Analysis
Revenue Landscape Across
Revenue opportunities in the Digital Travel Market are spread across transportation booking, hotel booking, vacation packages, online travel agencies, metasearch platforms, travel insurance, visa support, local mobility, and destination activities. Transportation booking led with 44.8% share in 2025, supported by strong online demand for flights, rail, buses, ride-hailing, airport transfers, and multimodal travel planning. Global travel demand remained positive in 2026, as international tourist arrivals grew 2% in Q1 2026, reaching around 307 million arrivals despite regional uncertainty.
Platform and consumer behavior also support revenue growth across multiple booking touchpoints. Desktop accounted for 69.3% share in 2025, as many travelers still prefer larger screens for comparing fares, hotels, cancellation policies, and package details. International travel held 60.9% share, while women accounted for 54.2% share and the 32 to 43 years age group held 35.1% share, showing strong demand from working-age travelers, family planners, and frequent online comparison users.
Financial Impact
The financial impact remains strong because digital travel platforms earn through booking commissions, service fees, supplier margins, advertising, premium listings, insurance attachments, payment partnerships, and loyalty programs. Long-term financial growth is also supported by higher passenger traffic and stronger digital booking habits.
IATA forecast 4.9% year-on-year passenger traffic growth in 2026, led by Asia Pacific at 7.3%, which aligns with the region’s leading 33.8% share in the Digital Travel Market. However, profitability can be affected by rising customer acquisition costs, refunds, fraud prevention, payment gateway fees, discount-led competition, and supplier commission pressure.
Segment Covered in the Report
By Booking Type
Transportation Booking
Accommodation Booking
Vacation Packages
Activities and Experiences
Others
By Platform
Desktop
Mobile Application
Tablet
By Tour Type
International Travel
Domestic Travel
By Consumer Orientation
Women
Men
By Age Group
Below 21 Years
22-31 Years
32-43 Years
Above 43 Years
Drivers Impact Analysis
Impact Factor | Estimated CAGR Impact | Regional Relevance | Market Impact |
|---|---|---|---|
Rising online travel booking adoption | +4.4% | Asia Pacific, North America, Europe | Drives digital bookings. |
Growth in smartphone-based travel planning | +3.8% | Global | Improves booking access. |
Increasing demand for personalized travel experiences | +3.4% | U.S., Europe, China, India | Supports platform engagement. |
Expansion of digital payment systems | +3.0% | Asia Pacific, Latin America, Middle East | Simplifies travel transactions. |
Growth in international tourism | +2.7% | Asia Pacific, Europe, Middle East | Boosts travel platform use. |
Restraints Impact Analysis
Impact Factor | Estimated CAGR Impact | Regional Relevance | Market Impact |
|---|---|---|---|
High competition among travel platforms | -2.2% | Global | Pressures margins. |
Data privacy and payment security concerns | -1.9% | North America, Europe, Asia Pacific | Affects user trust. |
Travel disruption and cancellation risks | -1.6% | Global | Impacts booking confidence. |
Dependence on airline and hotel inventory | -1.4% | Global travel markets | Limits pricing control. |
Digital access gaps in rural markets | -1.1% | Emerging regions | Slows adoption. |
Opportunities Impact Analysis
Impact Factor | Estimated CAGR Impact | Regional Relevance | Market Impact |
|---|---|---|---|
Growth in AI-based travel planning | +4.0% | North America, Europe, Asia Pacific | Improves trip personalization. |
Expansion of mobile travel apps | +3.6% | Global | Builds direct customer access. |
Rising demand for international travel booking | +3.3% | Asia Pacific, Europe, North America | Supports higher booking value. |
Growth in bundled travel packages | +2.9% | Global | Increases transaction size. |
Digital travel services for women travelers | +2.4% | Asia Pacific, Europe, North America | Expands targeted demand. |
Challenges Impact Analysis
Impact Factor | Estimated CAGR Impact | Regional Relevance | Market Impact |
|---|---|---|---|
Managing real-time pricing accuracy | -1.8% | Global | Affects customer satisfaction. |
Cybersecurity risks in travel platforms | -1.6% | Global | Raises protection needs. |
Customer service issues during disruptions | -1.4% | Global | Impacts brand loyalty. |
Regulatory variation across countries | -1.2% | International travel markets | Increases compliance burden. |
Platform dependency on supplier APIs | -1.0% | Online travel agencies | Creates service risk. |
Recent Developments
June 2026: Tripadvisor entered an agreement to sell TheFork to American Express in an all-cash transaction valued at USD 700 million. The deal is expected to help Tripadvisor focus more strongly on travel experiences, while American Express gains a restaurant reservation platform with over 50,000 restaurants across 11 countries.
May 2026: Airbnb expanded its travel platform by adding car rentals, grocery delivery, airport pickups, luggage storage, boutique hotels, and AI-powered trip tools. The rollout included grocery delivery in more than 25 U.S. cities, airport pickups in over 160 cities, and luggage storage across more than 15,000 locations in 175 cities.
May 2026: Yanolja acquired InnKey, an India-based hospitality technology platform, through Yanolja Cloud Solution. The acquisition strengthened Yanolja’s hotel management and enterprise hospitality software presence in India.
March 2026: MakeMyTrip completed the acquisition of a majority stake in Flamingo Transworld and made a strategic minority investment in Atlys, a visa processing platform. The company also merged redBus India into MakeMyTrip India Pvt. Ltd., while expanding its AI-led trip planner Myra, which handled over 55,000 daily conversations during the reported period.
February 2026: HBX Group and Traveloka expanded their strategic partnership to improve hotel supply and travel distribution across Asia Pacific. Under the agreement, Traveloka will integrate more than 40,000 Asia Pacific hotels into HBX Group’s supply ecosystem.
Report Scope
Report Highlights | Details |
|---|---|
Market Revenue (2025) | USD 650.4 billion |
Forecast Revenue (2035) | USD 3,075.6 billion |
CAGR (2025-2035) | 16.8% |
Base Year for Estimation | 2025 |
Historic Data | 2020-2024 |
Forecast Period | 2025-2035 |
Report Coverage | AI market impact analysis, market surveys, trade analysis, Industry & competitive intelligence, Revenue projections, company positioning, competitive analysis, growth drivers, and emerging market trends, Strategic Consultation & Advisory Services |
Segments Covered | By Booking Type (Transportation Booking, Accommodation Booking, Vacation Packages, Activities and Experiences, Others), By Platform (Desktop, Mobile Application, Tablet), By Tour Type (International Travel, Domestic Travel), By Consumer Orientation (Women, Men), By Age Group (Below 21 Years, 22-31 Years, 32-43 Years, Above 43 Years) |
Regional Analysis | North America - US, Canada; Europe - Germany, France, The UK, Spain, Italy, Russia, Netherlands, Rest of Europe; Asia Pacific - China, Japan, South Korea, India, New Zealand, Singapore, Thailand, Vietnam, Rest of Latin America; Latin America - Brazil, Mexico, Rest of Latin America; Middle East & Africa - South Africa, Saudi Arabia, UAE, Rest of MEA |
Key companies profiled | Booking Holdings, Expedia Group, Airbnb, Trip.com Group, Tripadvisor, MakeMyTrip, Skyscanner, Trivago, Traveloka, Despegar and Other Key Players |
Customization Scope | Tailored insights for specific regions, countries, and market segments can be provided. Additional report customization is available upon request. |
Competitive Landscape
The market is characterized by intense competition among established players and emerging companies. Strategic partnerships, mergers and acquisitions, and product innovation are key strategies employed by market participants.
Key Market Players
Booking Holdings
Expedia Group
Airbnb
Trip.com Group
Tripadvisor
MakeMyTrip
Skyscanner
Trivago
Traveloka
Other Key Players
Meet the Team
This report was prepared by our expert analysts with deep industry knowledge and research experience.
Pratiksha is market research analyst with strong experience in industry research, market forecasting, and competitive analysis. She specializes in identifying market trends, evaluating growth opportunities, and preparing data-driven insights across global industries. Her work supports businesses in understanding market dynamics, customer demand, regional opportunities, and strategic investment areas.
Sayali brings more than 5 years of experience to Globe Market Research, supporting the accuracy, clarity, and relevance of research content across multiple industries. She reviews market data, segment analysis, competitive insights, and industry trends to ensure each report meets strong quality standards and provides practical value to business decision-makers. Her expertise spans healthcare, information technology, consumer goods, and diverse cross-industry domains. With a strong focus on data reliability, structured analysis, and clear presentation, Sayali helps ensure that each research output delivers well-reviewed insights for clients, investors, consultants, and industry stakeholders.
Frequently Asked Questions
Related Reports
More in Smart Technologies
Humanoid Robot Market to hit USD 263.6 billion by 2035
Global Humanoid Robot Market Size, Go-to-Market Strategy Analysis By Component (Actuators, Sensors), By Motion Type (Bipedal Humanoid Robots, Upper-Body Humanoid Robots, Wheeled Humanoid Robots), By Application (Underwater Systems, Military and Defense, Construction, Healthcare, Hospitality, Education and Scientific Research, Residential, Retail, Others), By Regional Insights, Business plan and Project Report, Investment Opportunities, Profitability, Industry Trends, Leading Companies and Growth Forecasts By 2025-2035
Comic Book Subscription Service Market to hit USD 7.8 Bn by 2035
Global Comic Book Subscription Service Market By Subscription Type (Digital Subscription, Physical Subscription, Hybrid Subscription), By Content Type (Superhero Comics, Manga,Indie Comics, Graphic Novels), By Target Audience (Children, Teens, Adults, Collectors), By Pricing Model (Monthly Subscription, Annual Subscription, Pay-Per-Comic), By Regional Insights, Leading Companies and Growth Forecasts By 2025-2035
Esports Market to Surpass USD 84.0 Billion by 2035
Global Esports Market By Revenue Model (Sponsorship, Advertising, Media Rights, Merchandise & Tickets, Publisher Fees, Others), By Platform (PC-Based Esports, Mobile & Tablet Esports, Console-Based Esports), By Streaming Type (Live Streaming, Video-on-Demand), By Audience Type (Casual Viewers, Esports Enthusiasts, Professional Players, Amateur Players), By End User (Game Publishers, Tournament Organizers, Esports Teams, Streaming Platforms, Advertisers & Sponsors, Fans), By Regional Insights, Leading Companies and Growth Forecasts By 2025-2035
Virtual Tour Market to Exceed USD 308.2 Billion by 2035
Global Virtual Tour Market By Component (Software, Hardware, Services), By Technology (Semi & Fully Immersive, Non-Immersive), By Type (360-Degree Video, 3D Virtual Tours, Interactive Virtual Tours), By Application (Real Estate, Tourism & Hospitality, Art Galleries & Museums, Education, Retail, Others), By Platform / Deployment (Cloud-Based, On-Premise), By Regional Insights, Leading Companies and Growth Forecasts By 2025-2035