

Revenue, 2025
$10.1Bn
Forecast, 2035
$84.0Bn
CAGR, 2025-2035
23.6%
Report Coverage
Global
Market Size and Forecast
The Global Esports Market was valued at USD 10.1 billion in 2025 and is projected to reach USD 84.0 billion by 2035, growing at a CAGR of 23.6%. North America led the market with a 45.2% share in 2025, while the U.S. market reached USD 3.2 billion and is expected to grow at a 24.8% CAGR, supported by rising game streaming viewership, strong sponsorship spending, professional league expansion, and growing investment from media, technology, and entertainment companies.
The growth of the esports market can be attributed to rising game streaming, higher internet access, increasing smartphone usage, and the expansion of professional esports leagues. Live gaming content has become a major entertainment habit, especially among younger audiences. YouTube Gaming reached 8.8 billion hours watched in 2025, showing a 12% year-on-year increase and accounting for about 25% of gaming live-streaming hours.
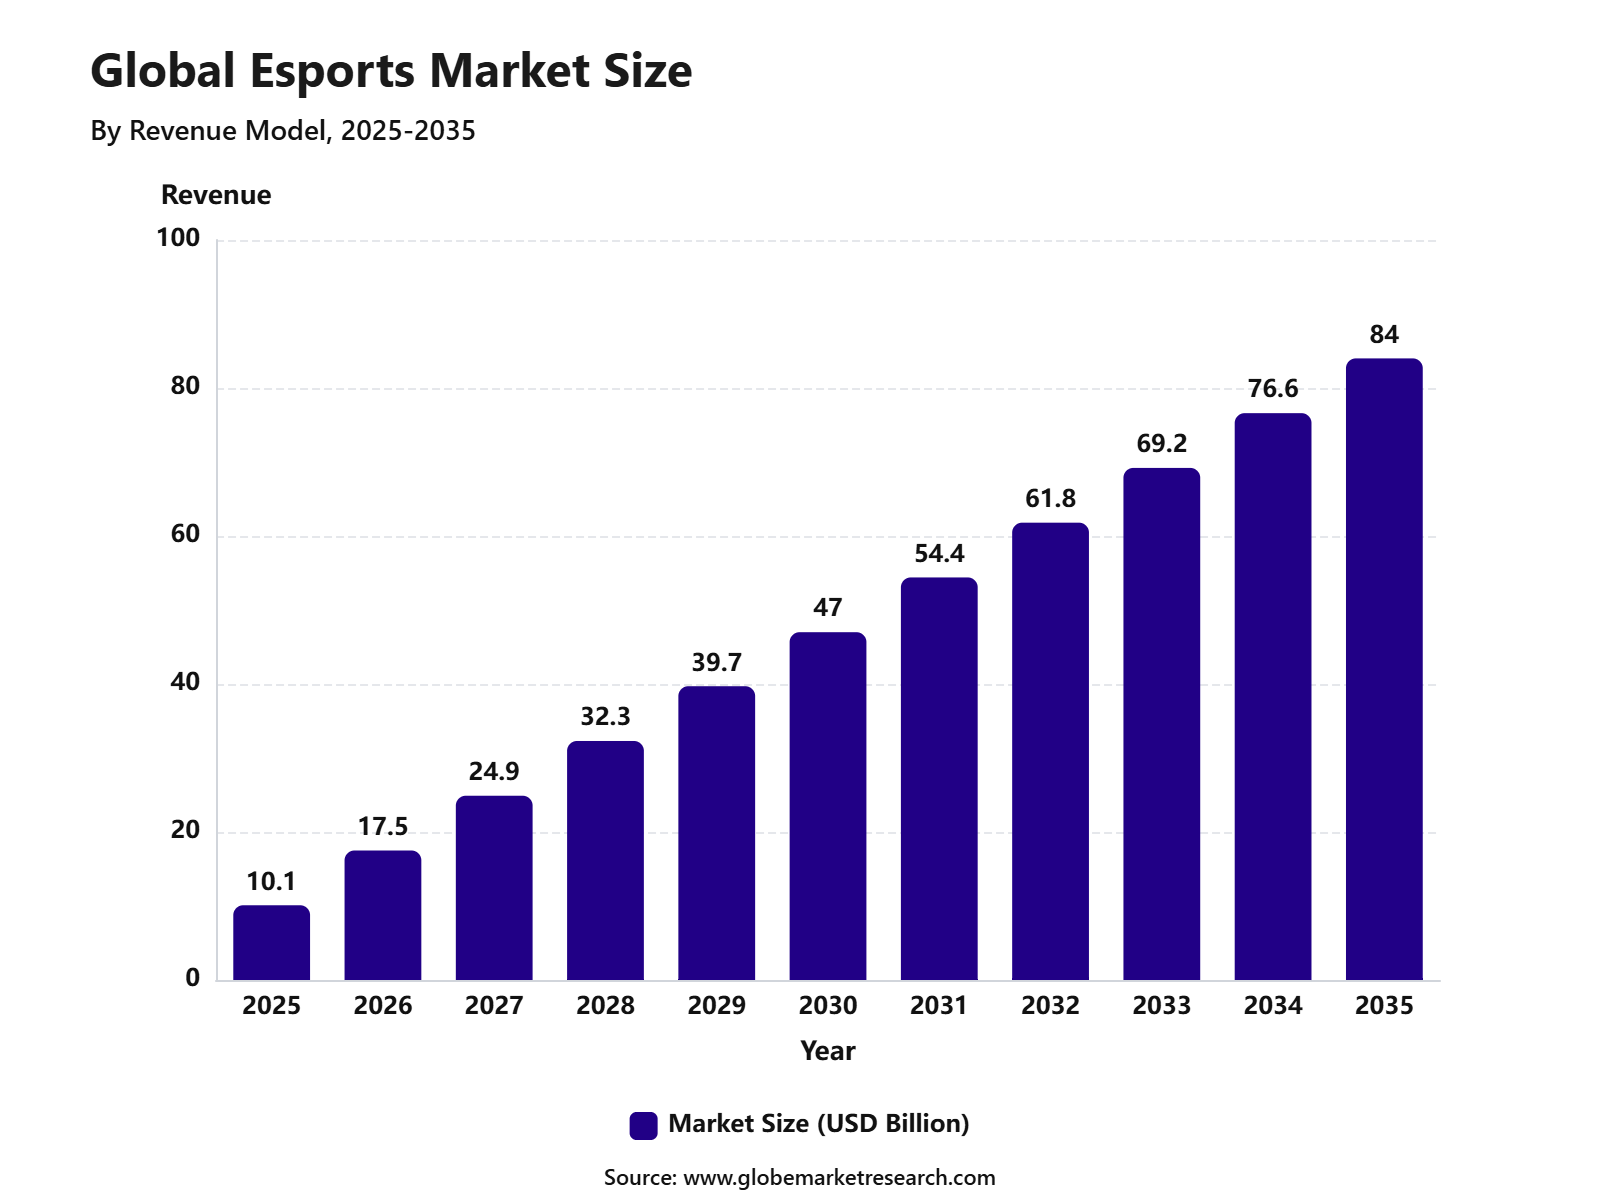 iThe graph shows projected market growth until 2035 based on CAGR analysis. Actual outcomes may vary depending on changing demand, competition, and economic factors.To gain greater insights - request a sample report PDF
Top Market Takeaways
Sponsorship led the esports revenue model with 43.6% share, supported by strong brand partnerships, team sponsorships, tournament deals, and media visibility.
PC-based esports held the leading platform share of 49.3%, driven by high-performance gaming, professional tournament formats, and strong adoption among competitive players.
MOBA games led by game type with 35.4% share, supported by large fan communities, team-based competition, and frequent global tournaments.
Live streaming accounted for 52.8% share, driven by real-time viewer engagement, influencer-led content, and growing esports broadcast audiences.
Casual viewers represented the leading audience type with 39.4% share, supported by wider access to streaming platforms and growing interest in esports entertainment.
Advertisers and sponsors accounted for 42.3% share by end user, driven by strong demand for youth-focused digital marketing and gaming audience reach.
North America led the esports market with 45.2% share, supported by large gaming populations, mobile and PC gaming growth, and strong tournament ecosystems.
The U.S. esports market was valued at USD 2.6 billion and is projected to grow at a CAGR of 22.8%.
Esports Market Overview
The esports market refers to the business ecosystem built around professional and competitive video gaming. It includes tournaments, teams, players, publishers, streaming platforms, sponsors, advertisers, media rights, ticketing, merchandise, and digital fan engagement. The market is growing because gaming has become a mainstream entertainment format, supported by a large global player base and strong online viewing behavior.
The esports market is adopting technologies such as cloud gaming, artificial intelligence, 5G connectivity, live streaming tools, data analytics, and immersive viewing formats. These technologies are improving match delivery, player performance analysis, content production, and fan interaction. AI is being used to support automated highlights, performance tracking, content moderation, and audience insights.
Investment opportunities in the esports market are increasing across tournament platforms, team ownership, streaming content, gaming infrastructure, and fan engagement tools. The market offers opportunities for investors looking at digital entertainment, youth media, and interactive content. Mobile esports is especially attractive because it can reach large audiences in Asia Pacific, Latin America, the Middle East, and other high-growth regions.
Esports Statistics
Global live esports content reached a record 3.3 billion hours watched in 2025, excluding mainland China. This marked a 1.5% increase compared with the previous year.
The wider global games market reached USD 188.8 billion in 2025, supported by around 3.6 billion players worldwide. This large gaming base continues to support esports viewership, tournament participation, and brand investment.
The global player base is expected to reach 3.58 billion in 2025, representing a 4.4% year-on-year increase. Mobile gaming accounts for about 3.0 billion players, equal to nearly 83% of the total player base.
Asia Pacific remained the largest games region in 2025, supported by strong mobile gaming, competitive gaming culture, and high user participation. China and the U.S. together accounted for about 50% of global consumer games spending.
YouTube Gaming recorded 8.8 billion hours watched in 2025, showing a 12% year-on-year increase. The platform accounted for nearly 25% of total gaming live-streaming hours, showing its strong role in esports and gaming content distribution.
Sponsored gaming streams rebounded in Q4 2025, reaching 4.5 million hours watched. This shows that brand-backed gaming and esports content continues to gain value across streaming platforms.
Esports Charts tracks more than 87,000 tournaments and events, 362,000 matches, 55,000 teams, 91,000 players, and 159 games. This reflects the scale and depth of organized esports competition worldwide.
By Revenue Model: Sponsorship
Sponsorship led the Esports Market with 43.6% share, supported by strong brand interest in competitive gaming audiences. Sponsors are using esports teams, tournaments, live events, player content, and digital campaigns to reach young and highly engaged viewers. This revenue model works well because esports audiences often follow teams, creators, and leagues with high loyalty. As a result, sponsorship remains one of the most important income streams for the esports ecosystem.
The segment is also supported by the wider shift of advertising budgets toward digital video, gaming, and live online content. In the U.S., digital video ad spend reached USD 64 billion in 2024 and was projected to reach USD 72 billion in 2025, showing strong advertiser demand for video-led environments. This benefits esports because tournaments and creator-led broadcasts offer measurable engagement, live interaction, and brand visibility. Sponsorship demand is expected to remain steady as brands focus on gaming-native audiences.
By Platform: PC-Based Esports
PC-based esports held 49.3% share, driven by the strong presence of competitive titles that depend on high-performance systems, precise controls, and professional tournament formats. PC gaming remains important for esports because it supports advanced graphics, keyboard and mouse control, custom settings, and stable competitive play. Many major esports titles and professional leagues continue to be closely linked with PC-based competition. This keeps the platform strong across both professional and amateur esports.
The segment is also supported by the wider strength of the global games industry. Public gaming industry data showed that global games revenue was expected to reach USD 188.8 billion in 2025, with 3.6 billion players worldwide. PC gaming continues to benefit from strong engagement in Asia, Europe, and North America, especially across competitive multiplayer titles. This large gaming base supports PC-based esports participation, viewership, and tournament development.
By Game Type: MOBA
MOBA games accounted for 35.4% share in the Esports Market, supported by their strong tournament structure, team-based gameplay, and large global fan communities. These games are well suited for esports because they combine strategy, skill, teamwork, and live match unpredictability. Viewers are attracted to the format because each match includes clear roles, tactical decisions, and high-pressure moments. This makes MOBA one of the most watched and commercially valuable esports categories.
The leadership of MOBA is also visible in global event viewership. League of Legends recorded the highest peak viewership among esports games in 2025, reaching around 6.75 million peak viewers. Mobile Legends: Bang Bang also ranked among the leading esports games by peak viewers, showing the strength of MOBA formats across both PC and mobile ecosystems. These viewership levels support strong sponsorship, media rights, and fan engagement around MOBA competitions.
By Streaming Type: Live Streaming
Live streaming dominated the Esports Market with 52.8% share, supported by real-time match viewing, live chat, creator co-streams, and tournament broadcasts. Esports is naturally suited to live viewing because audiences want to watch matches as they happen, follow team performance, and react with other fans. Live streaming also allows sponsors and advertisers to reach viewers during high-attention moments. This has made live broadcast formats central to esports monetisation.
The strength of live streaming is also reflected in wider gaming and entertainment events. The 2025 Game Awards recorded an estimated 171 million global livestreams, up from 154 million in 2024, showing continued growth in live gaming-related viewing. Twitch also recorded more than 1.8 million peak concurrent viewers during the event, while YouTube reached 2.4 million concurrent viewers across co-streaming channels. These figures show how live streaming supports large-scale audience reach across gaming and esports content.
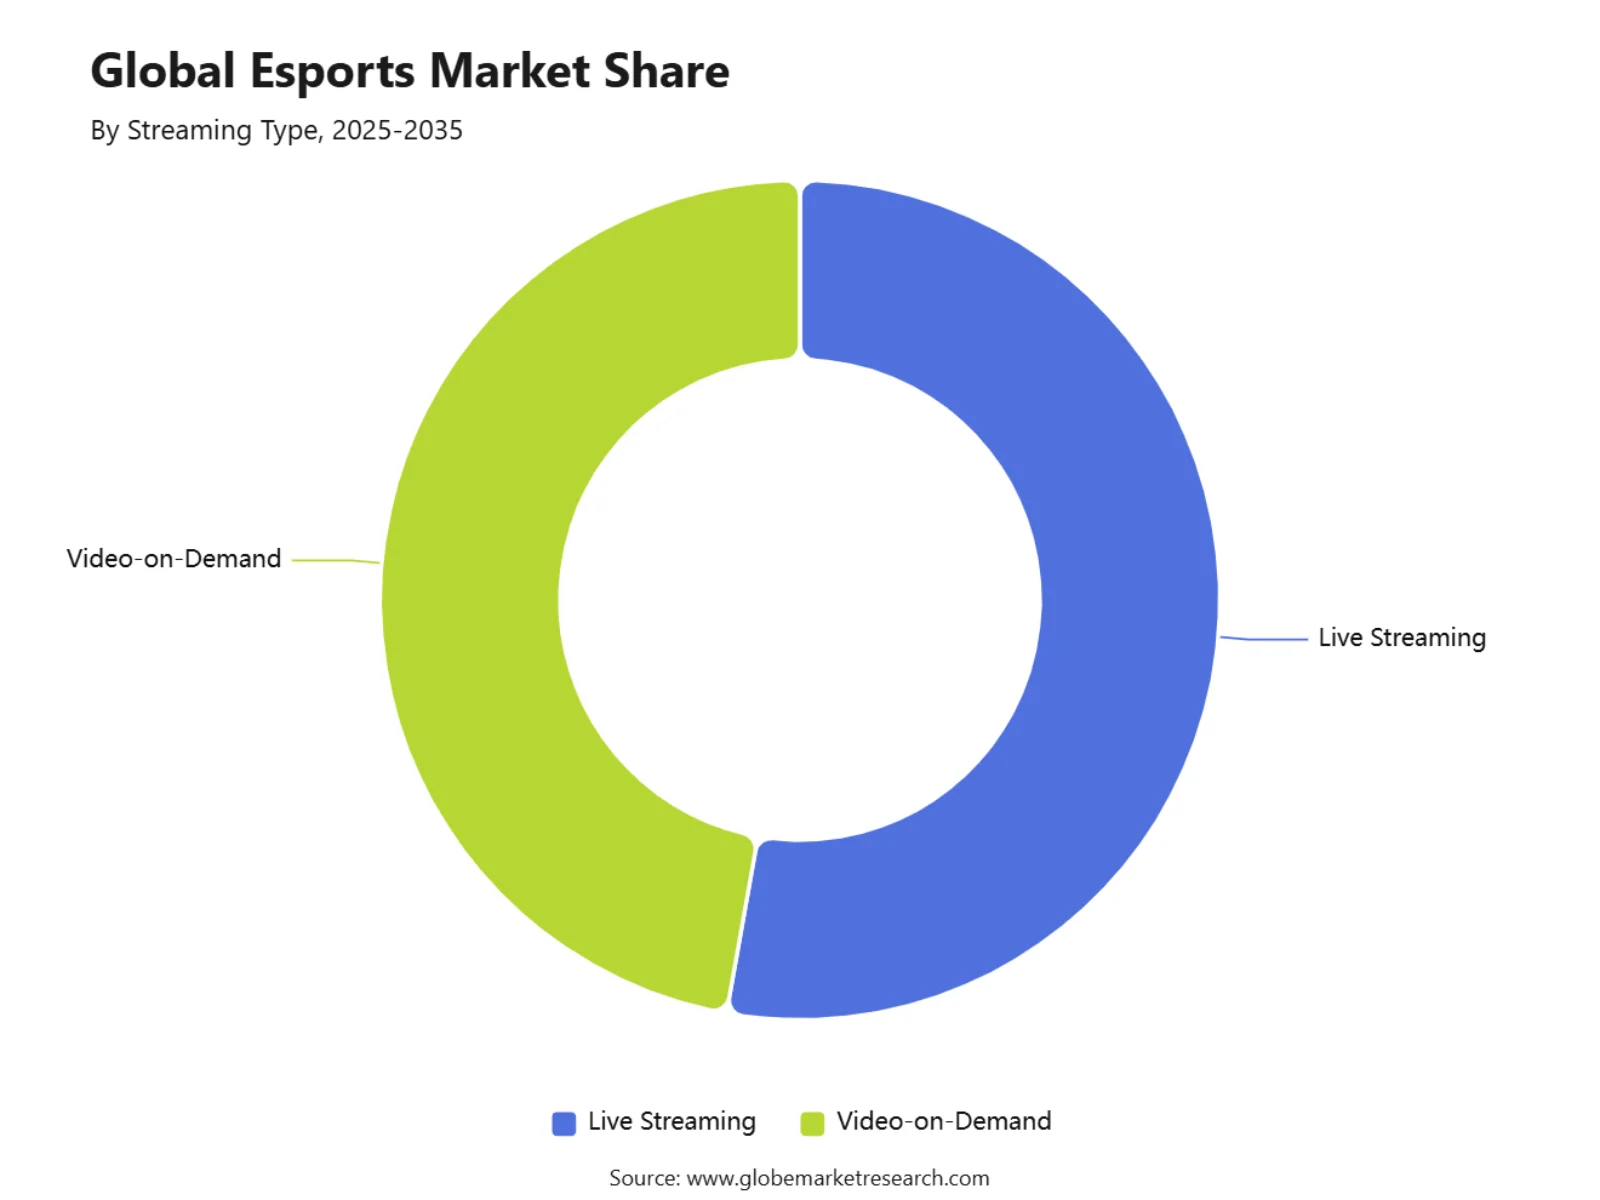 iThe graph shows projected market growth until 2035 based on CAGR analysis. Actual outcomes may vary depending on changing demand, competition, and economic factors.To gain greater insights - request a sample report PDF
By Audience Type: Casual Viewers
Casual viewers held 39.4% share of the Esports Market, supported by easy access to free streams, short clips, highlights, and creator-led content. Many viewers do not follow every tournament closely but still watch popular matches, finals, influencer streams, or major game events. This makes casual viewers an important audience group for platforms and advertisers. Their presence helps esports reach beyond core fans and professional gaming communities.
The casual viewer segment is also supported by the large base of video game players. In the U.S., 205.1 million people played video games in 2025, while 89% of players had played games online either alone or with others. This broad gaming culture creates a strong pool of potential esports viewers, especially when major tournaments are promoted through social media and streaming platforms. Casual viewing is expected to remain important as esports content becomes easier to discover across short video and live streaming channels.
By End User: Advertisers and Sponsors
Advertisers and sponsors accounted for 42.3% share, supported by rising demand for direct access to gaming audiences. These end users use esports to promote products through team sponsorships, tournament branding, in-stream ads, creator partnerships, and event activations. Esports offers strong value because it combines entertainment, community, competition, and measurable digital engagement. This makes it useful for brands targeting younger and digitally active consumers.
The segment is also benefiting from higher advertiser confidence in gaming and esports media. Video games and esports advertising revenue grew 22.0% in 2025, supported by expanded in-game formats, better measurement, and rising demand for high-attention environments. This reflects the increasing role of esports within the wider digital advertising mix. Advertisers are expected to focus more on performance tracking, audience quality, and long-term sponsorship value.
By Regional Analysis
North America held 45.2% share in the Esports Market, supported by strong gaming culture, advanced streaming platforms, professional leagues, and high advertiser spending. The region benefits from a mature digital entertainment ecosystem and strong participation across PC, console, and mobile gaming. Esports events, college-level competitions, gaming creators, and brand sponsorships continue to support regional growth. This has positioned North America as one of the leading commercial hubs for esports.
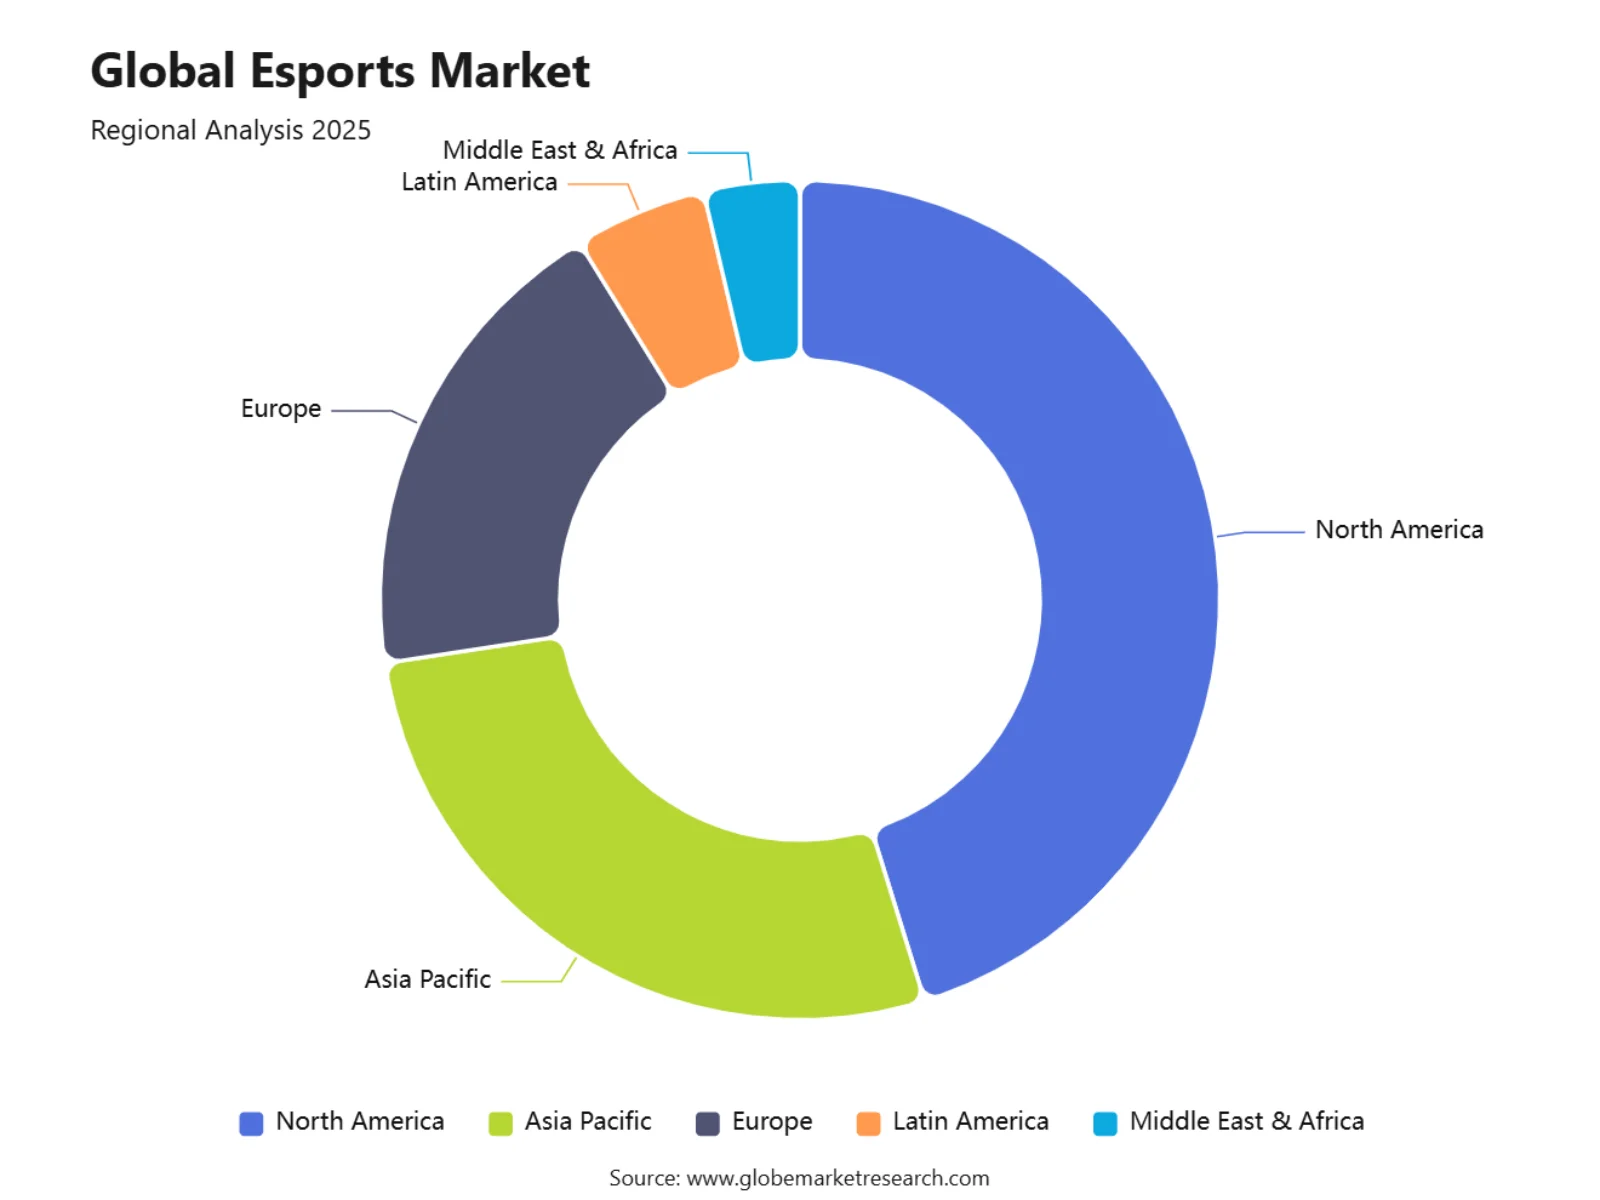 iThe graph shows projected market growth until 2035 based on CAGR analysis. Actual outcomes may vary depending on changing demand, competition, and economic factors.To gain greater insights - request a sample report PDF
Regional Impact Analysis
Impact Factor | Estimated CAGR Impact | Regional Relevance | Market Impact |
|---|---|---|---|
North America market leadership | +6.0% | U.S. and Canada | Leads revenue generation. |
U.S. esports market expansion | +5.4% | United States | Supports sponsorship and media growth. |
Asia Pacific gaming ecosystem strength | +5.8% | China, South Korea, Japan, India, Southeast Asia | Drives player and viewer growth. |
Europe esports commercialization | +4.1% | UK, Germany, France, Nordics, Spain | Supports league and brand activity. |
Latin America and MEA emerging adoption | +2.9% | Brazil, Mexico, UAE, Saudi Arabia, South Africa | Builds future audience demand. |
The U.S. Esports Market was valued at USD 3.2 Bn and is expected to grow at a CAGR of 24.8%, supported by rising streaming viewership, sponsorship demand, and organized tournament activity. The country also has a large gaming base, with video games contributing strongly to entertainment, social connection, and digital engagement. U.S. digital advertising revenue reached USD 259 billion in 2024, reflecting a strong media buying environment for esports-related campaigns. This supports continued investment by advertisers, sponsors, platforms, and event organizers.
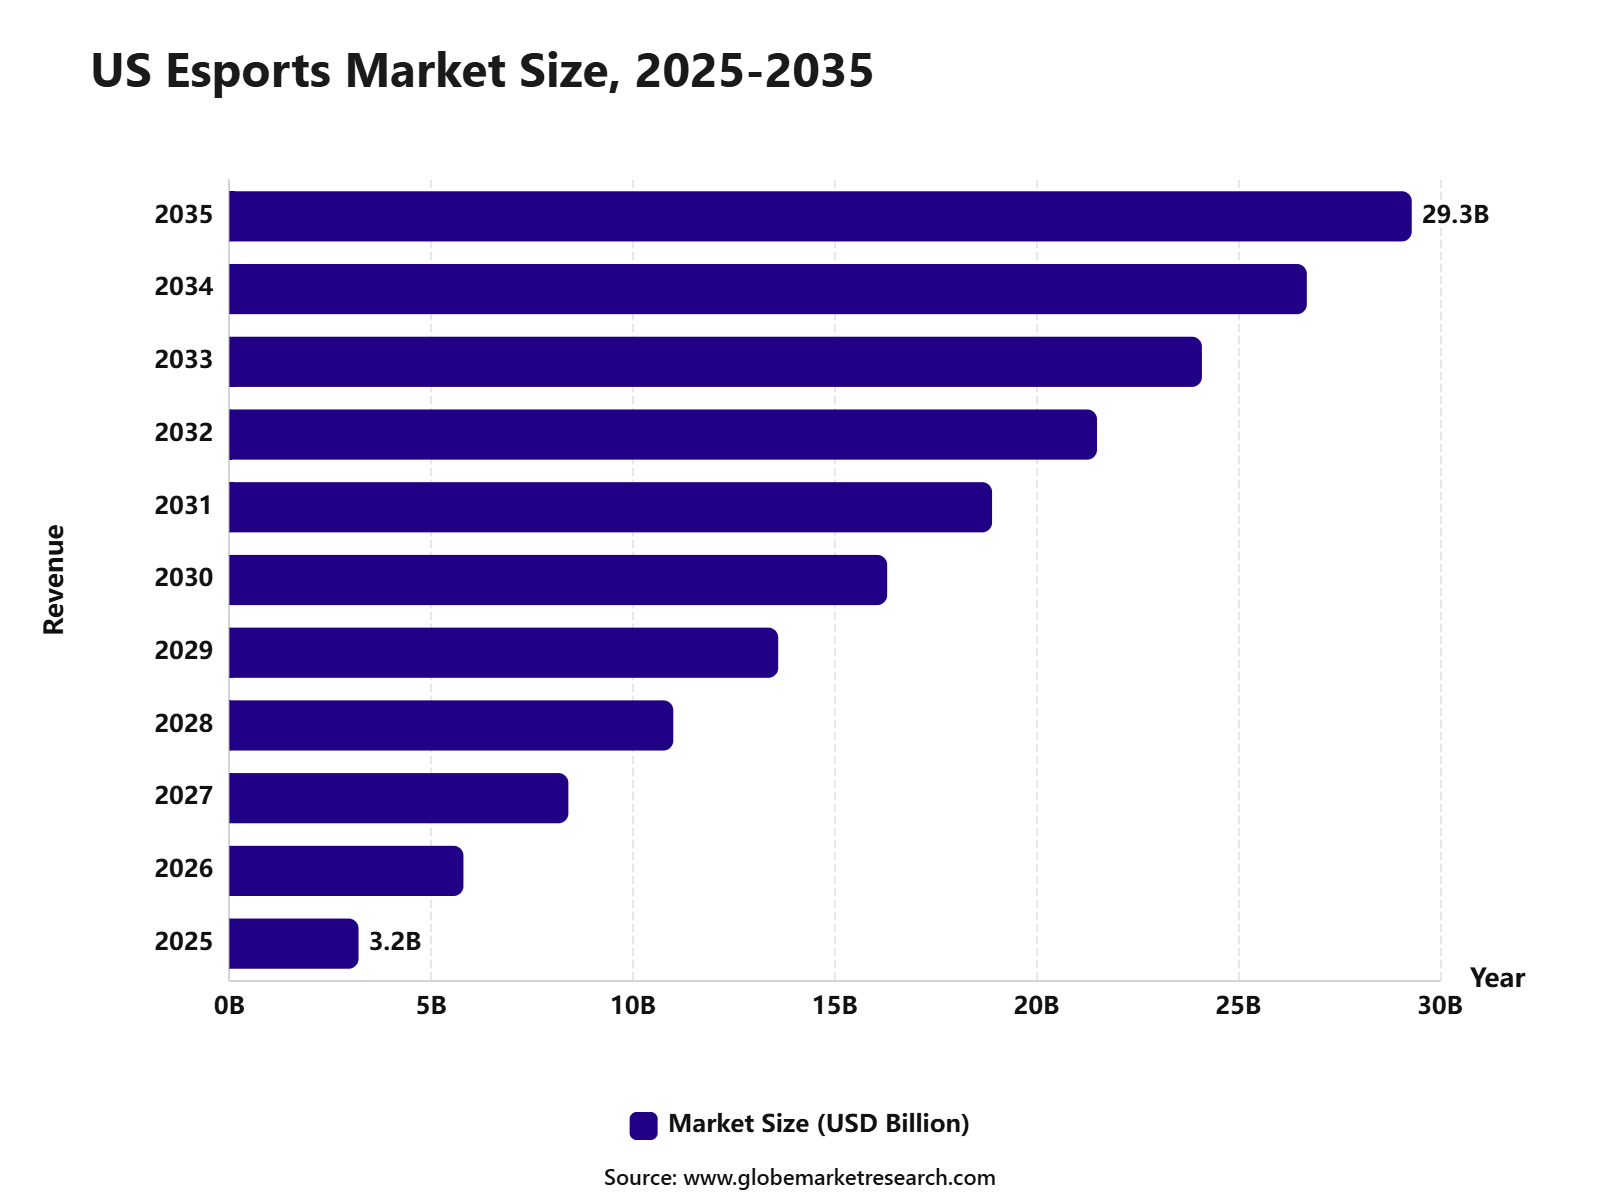 iThe graph shows projected market growth until 2035 based on CAGR analysis. Actual outcomes may vary depending on changing demand, competition, and economic factors.To gain greater insights - request a sample report PDF
Key Market Segments
By Revenue Model
Sponsorship
Advertising
Media Rights
Merchandise & Tickets
Publisher Fees
Others
By Platform
PC-Based Esports
Mobile & Tablet Esports
Console-Based Esports
By Game Type
MOBA
FPS
Battle Royale
Sports Simulation
Real-Time Strategy
Fighting Games
Others
By Streaming Type
Live Streaming
Video-on-Demand
By Audience Type
Casual Viewers
Esports Enthusiasts
Professional Players
Amateur Players
By End User
Game Publishers
Tournament Organizers
Esports Teams
Streaming Platforms
Advertisers & Sponsors
Fans
By Region
North America
Europe
Asia Pacific
Latin America
Middle East & Africa
Drivers Impact Analysis
Impact Factor | Estimated CAGR Impact | Regional Relevance | Market Impact |
|---|---|---|---|
Rising esports viewership | +5.8% | North America, Asia Pacific, Europe | Expands audience monetization. |
Growth in sponsorship spending | +5.4% | U.S., China, South Korea, Europe | Drives market revenue. |
Expansion of professional leagues | +4.7% | U.S., China, South Korea, Japan | Strengthens competitive ecosystem. |
Increasing live streaming adoption | +4.5% | Global | Boosts fan engagement. |
Rising youth participation in gaming | +4.1% | Global | Builds long-term audience base. |
Restraints Impact Analysis
Impact Factor | Estimated CAGR Impact | Regional Relevance | Market Impact |
|---|---|---|---|
High tournament operating cost | -2.8% | Global | Pressures event profitability. |
Limited monetization in emerging markets | -2.3% | Asia Pacific, Latin America, MEA | Slows revenue conversion. |
Regulatory concerns around gaming | -2.1% | China, India, Europe, Middle East | Affects market expansion. |
Player burnout and short careers | -1.8% | Global | Impacts team stability. |
Dependence on game publishers | -1.7% | Global | Limits ecosystem control. |
Opportunities Impact Analysis
Impact Factor | Estimated CAGR Impact | Regional Relevance | Market Impact |
|---|---|---|---|
Growth in mobile esports | +5.2% | Asia Pacific, Latin America, MEA | Expands mass participation. |
Rising media rights opportunities | +4.8% | North America, Europe, Asia Pacific | Builds premium revenue. |
Expansion of esports betting and fantasy platforms | +4.2% | U.S., Europe, Latin America | Increases fan monetization. |
Brand partnerships with esports teams | +4.5% | U.S., Europe, China, South Korea | Strengthens sponsorship value. |
College and school esports programs | +3.7% | U.S., Canada, Europe, India | Builds structured talent pipeline. |
Challenges Impact Analysis
Impact Factor | Estimated CAGR Impact | Regional Relevance | Market Impact |
|---|---|---|---|
Revenue concentration among top events | -2.4% | Global | Limits smaller tournament growth. |
Cybersecurity and cheating risks | -2.0% | Global | Affects competitive trust. |
Unclear athlete protection standards | -1.7% | Global | Raises player welfare concerns. |
Brand safety concerns | -1.6% | North America, Europe, Asia Pacific | Slows advertiser decisions. |
Fragmented tournament structure | -1.8% | Emerging esports markets | Reduces market consistency. |
Recent Developments
January 2026 – Esports World Cup Foundation announced a USD 75 million prize pool for the Esports World Cup 2026. The Club Championship will award USD 30 million to the top 24 clubs, including USD 7 million for the winning club. This supports higher professional team participation and stronger global brand interest.
October 2025 – IOC and Saudi Arabia mutually ended their 12-year Olympic Esports Games partnership after 14 months. The IOC stated that it will develop a new Olympic esports model independently. This development may reshape future governance, sponsorship, and host-country strategy for global esports events.
July 2025 – NODWIN Gaming planned to raise fresh capital from existing shareholders as Nazara Technologies moved to de-subsidiarise the esports unit. NODWIN reported INR 523.8 crore revenue in FY2025 and contributed 32.3% of Nazara’s total revenue. This supports independent growth in esports, youth media, and live gaming events.
August 2025 – Shikenso was named the official sponsorship analytics provider for the Esports World Cup 2025. The company measured brand exposure across 25 tournaments, 24 game titles, broadcasts, streaming platforms, and social channels. This shows rising demand for data-led sponsorship valuation in esports.
Report Scope
Report Highlights | Details |
|---|---|
Market Revenue (2025) | USD 10.1 Bn |
Forecast Revenue (2035) | USD 84.0 Bn |
CAGR (2025-2035) | 23.6% |
Base Year for Estimation | 2025 |
Historic Data | 2020-2024 |
Forecast Period | 2025-2035 |
Report Coverage | AI impact Analysis, Revenue projections, company positioning, competitive analysis, growth drivers, and emerging market trends |
Segments Covered | By Revenue Model (Sponsorship, Advertising, Media Rights, Merchandise & Tickets, Publisher Fees, Others), By Platform (PC-Based Esports, Mobile & Tablet Esports, Console-Based Esports), By Streaming Type (Live Streaming, Video-on-Demand), By Audience Type (Casual Viewers, Esports Enthusiasts, Professional Players, Amateur Players), By End User (Game Publishers, Tournament Organizers, Esports Teams, Streaming Platforms, Advertisers & Sponsors, Fans) |
Regional Analysis | North America – US, Canada; Europe – Germany, France, The UK, Spain, Italy, Russia, Netherlands, Rest of Europe; Asia Pacific – China, Japan, South Korea, India, New Zealand, Singapore, Thailand, Vietnam, Rest of Latin America; Latin America – Brazil, Mexico, Rest of Latin America; Middle East & Africa – South Africa, Saudi Arabia, UAE, Rest of MEA |
Key companies profiled | Tencent Holdings, Activision Blizzard, Electronic Arts, Riot Games, Valve Corporation, Epic Games, Nintendo, Take-Two Interactive, Sony Interactive Entertainment, Microsoft Gaming, ESL FACEIT Group, DreamHack, Gfinity, Huya, DouYu, Twitch, YouTube Gaming, Team Liquid, Cloud9, FaZe Clan, T1, Fnatic, G2 Esports, Natus Vincere, 100 Thieves, Gen.G Esports. |
Customization Scope | Tailored insights for specific regions, countries, and market segments can be provided. Additional report customization is available upon request. |
Competitive Landscape
The market is characterized by intense competition among established players and emerging companies. Strategic partnerships, mergers and acquisitions, and product innovation are key strategies employed by market participants.
Key Market Players
Tencent Holding Limited
Nintendo of America Inc.
Activision Blizzard
Electronic Arts
Valve Corporation
Modern Times Group (MTG)
Riot Games
Epic Games
Nintendo
Gfinity
Huya
G2 Esports
Natus Vincere
Others
Research Methodology
This market study is prepared using a combination of primary and secondary research. Primary research includes discussions with manufacturers, suppliers, distributors, consultants, industry experts, and end users. Secondary research covers company reports, government databases, trade associations, technical publications, regulatory sources, and trusted industry documents. The collected information is used to assess market demand, pricing trends, technology adoption, competitive activity, and regional performance.
AI language models are not used as primary data sources, and publicly available AI-generated content is not treated as market evidence. Computational tools may be used to support data processing, translation, data classification, and pattern identification. However, every published assessment is supported by verified sources, human review, and primary market discussions.
Market estimates are developed through top-down and bottom-up approaches and validated using data triangulation. Revenue, production, shipment, pricing, and application-level data are compared across multiple sources. Forecasts consider economic conditions, regulatory changes, investment activity, innovation, supply chain developments, and industry risks. All findings are reviewed through source verification and internal quality checks before publication.
Part I
Source Management & Input Data Standards
Who provides data, how sources are qualified, and what types of evidence are admissible.
Part II
Research Scope & Market Coverage
How we define the markets we assess and the parameters that govern each product.
Part III
Data Collection, Verification & Submission
The mechanics of gathering, cross-checking, and hierarchically ranking evidence.
Part IV
Assessment Determination & Quality Controls
How raw data becomes a published assessment — normalisation, expert judgement, and outlier exclusion.
Part V
Publication, Corrections & Revision
Our publication schedule, corrections policy, and methodology review cycle.
Part VI
Independence, Ethics & Complaints
Conflict-of-interest policies, editorial independence, and how clients raise concerns.
Google · Preferred Sources
Don't miss the latest market research insights and industry updates on Google.
Add Globe Market Research as a preferred source in the Google app to see our reports, analysis, and market stories in your news suggestions.
Meet the Team
This report was prepared by our expert analysts with deep industry knowledge and research experience.
Kimaya brings more than five years of experience in market research, content review, and industry analysis to Globe Market Research. She plays an important role in maintaining the accuracy, clarity, consistency, and relevance of research content across a wide range of industries. Her responsibilities include reviewing market data, segment analysis, competitive landscapes, industry trends, company developments, and strategic insights. Each report is carefully assessed to ensure that the findings are supported by reliable data, presented in a structured format, and aligned with the information needs of business decision-makers. Kimaya has research experience across healthcare, information technology, consumer goods, and several cross-industry domains.
Pratiksha K. is a Senior Research Analyst with more than five years of experience in market research, industry analysis, competitive intelligence, and business strategy. She has contributed to detailed market reports, customized research studies, company profiling, market sizing, trend analysis, and strategic consulting projects for clients across different regions. Her industry expertise covers Chemical and Material, Consumer Goods, Food & Beverages and Energy & Power. She closely evaluates changing customer requirements, technology developments, regulatory conditions, supply chain structures, investment activity, and competitive strategies to provide clear and practical market insights.
Frequently Asked Questions
Related Reports
More in Smart Technologies
Digital Travel Market Size to hit USD 3,075.6 billion by 2035
Global Digital Travel Market Size, Go-to-Market Strategy Analysis By Booking Type (Transportation Booking, Accommodation Booking, Vacation Packages, Activities and Experiences, Others), By Platform (Desktop, Mobile Application, Tablet), By Tour Type (International Travel, Domestic Travel), By Consumer Orientation (Women, Men), By Age Group (Below 21 Years, 22-31 Years, 32-43 Years, Above 43 Years), By Regional Insights, Business plan and Project Report, Investment Opportunities, Profitability, Industry Trends, Leading Companies and Growth Forecasts By 2025-2035
Humanoid Robot Market to hit USD 263.6 billion by 2035
Global Humanoid Robot Market Size, Go-to-Market Strategy Analysis By Component (Actuators, Sensors), By Motion Type (Bipedal Humanoid Robots, Upper-Body Humanoid Robots, Wheeled Humanoid Robots), By Application (Underwater Systems, Military and Defense, Construction, Healthcare, Hospitality, Education and Scientific Research, Residential, Retail, Others), By Regional Insights, Business plan and Project Report, Investment Opportunities, Profitability, Industry Trends, Leading Companies and Growth Forecasts By 2025-2035
Comic Book Subscription Service Market to hit USD 7.8 Bn by 2035
Global Comic Book Subscription Service Market By Subscription Type (Digital Subscription, Physical Subscription, Hybrid Subscription), By Content Type (Superhero Comics, Manga,Indie Comics, Graphic Novels), By Target Audience (Children, Teens, Adults, Collectors), By Pricing Model (Monthly Subscription, Annual Subscription, Pay-Per-Comic), By Regional Insights, Leading Companies and Growth Forecasts By 2025-2035
Virtual Tour Market to Exceed USD 308.2 Billion by 2035
Global Virtual Tour Market By Component (Software, Hardware, Services), By Technology (Semi & Fully Immersive, Non-Immersive), By Type (360-Degree Video, 3D Virtual Tours, Interactive Virtual Tours), By Application (Real Estate, Tourism & Hospitality, Art Galleries & Museums, Education, Retail, Others), By Platform / Deployment (Cloud-Based, On-Premise), By Regional Insights, Leading Companies and Growth Forecasts By 2025-2035