

Revenue, 2025
$56.8Bn
Forecast, 2035
$192.1Bn
CAGR, 2026-2035
12.9%
Report Coverage
Global
Market Size and Forecast
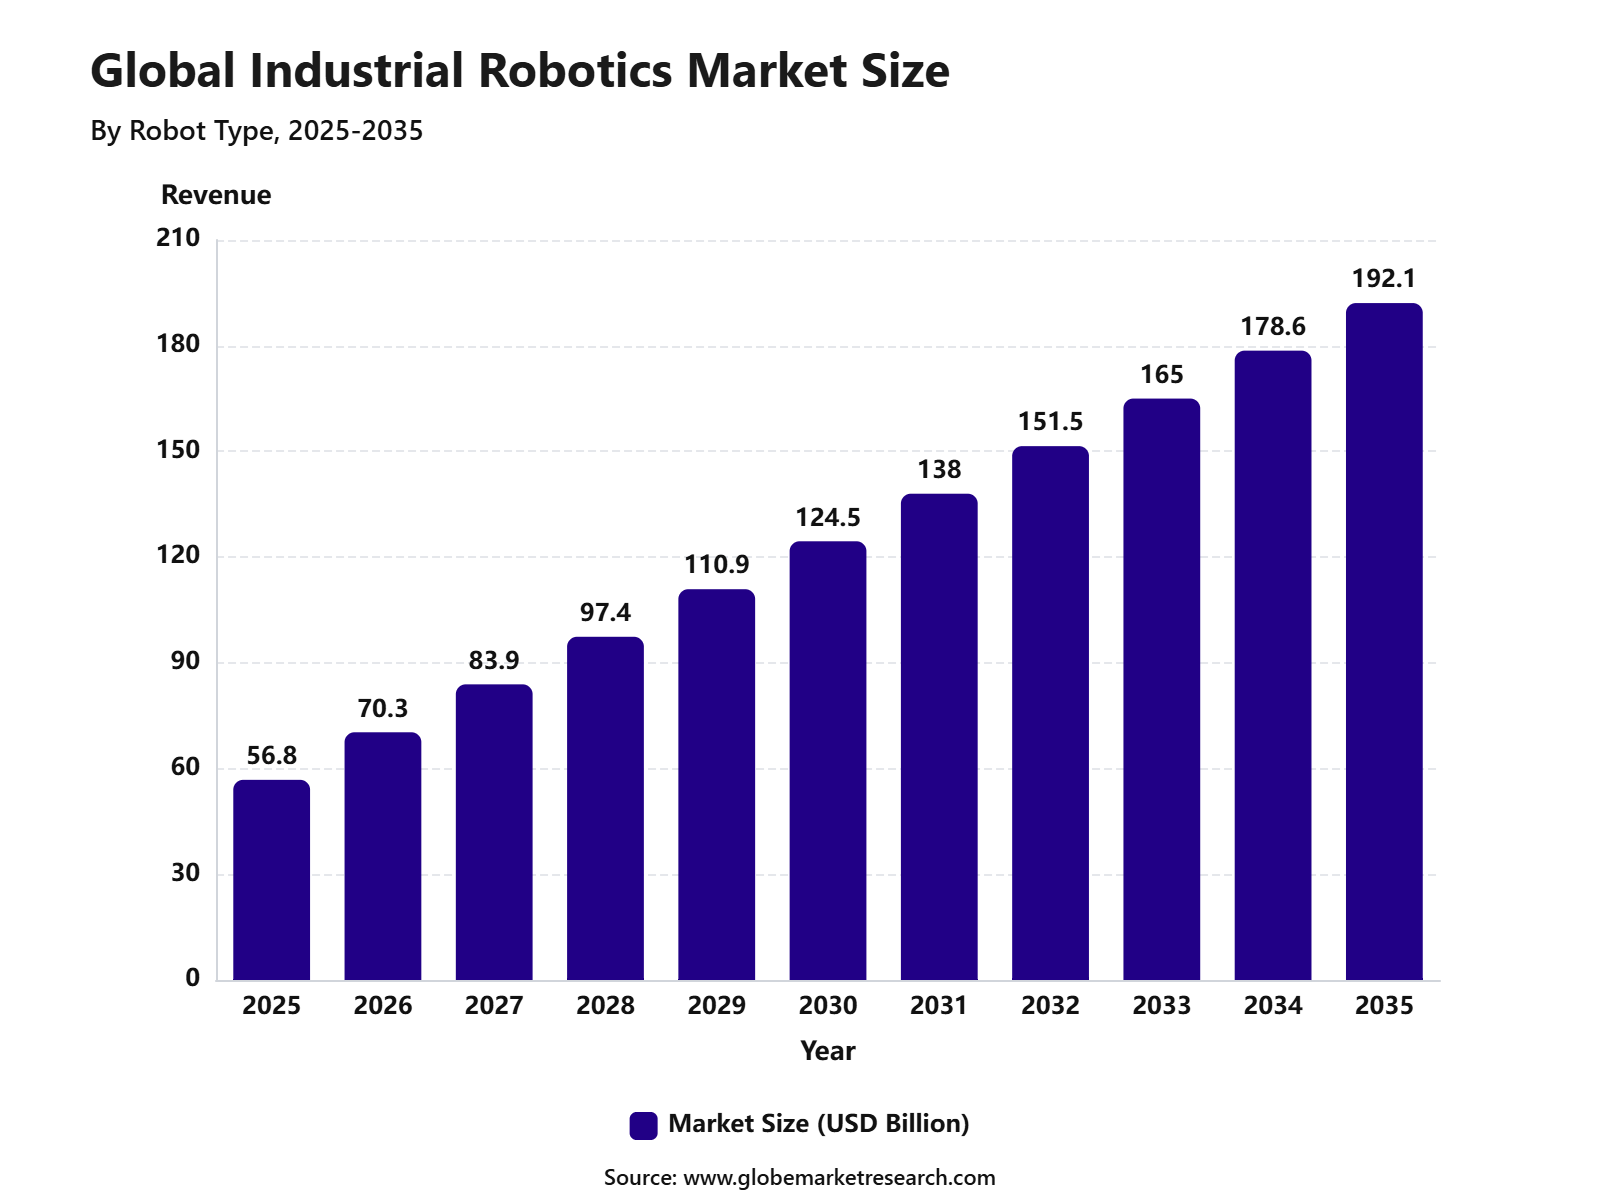
The Global Industrial Robotics Market was valued at USD 56.8 billion in 2025 and is projected to reach USD 192.1 billion by 2035, growing at a CAGR of 12.9% during the forecast period. Asia Pacific led the market with 46.3% share in 2025, supported by large-scale manufacturing activity, strong electronics and automotive production, rising factory automation, and increasing labor cost pressure across major industrial economies.
Industrial robotics refers to automated machines used in manufacturing and industrial operations for tasks such as welding, assembly, material handling, painting, packaging, palletizing, inspection, and machine tending. The growth of the market can be attributed to the rising need for higher productivity, better precision, safer workplaces, and consistent product quality. Manufacturers are increasingly adopting robots to reduce manual errors, improve production speed, and manage repetitive or hazardous tasks more efficiently.
The market outlook remains strong as industries continue to invest in smart factories, collaborative robots, AI-enabled automation, and advanced robotic vision systems. Asia Pacific is expected to maintain its leading position due to strong demand from automotive, semiconductor, electronics, metals, food processing, and logistics sectors. As companies focus on flexible production, cost control, and supply chain resilience, industrial robots are expected to become a core part of modern manufacturing operations.
 iThe graph shows projected market growth until 2035 based on CAGR analysis. Actual outcomes may vary depending on changing demand, competition, and economic factors.To gain greater insights - request a sample report PDF
Key Market Insights
Articulated robots led the robot type segment with 65.1% share in 2025, supported by their flexibility, wide motion range, and strong use in welding, assembly, handling, and manufacturing automation.
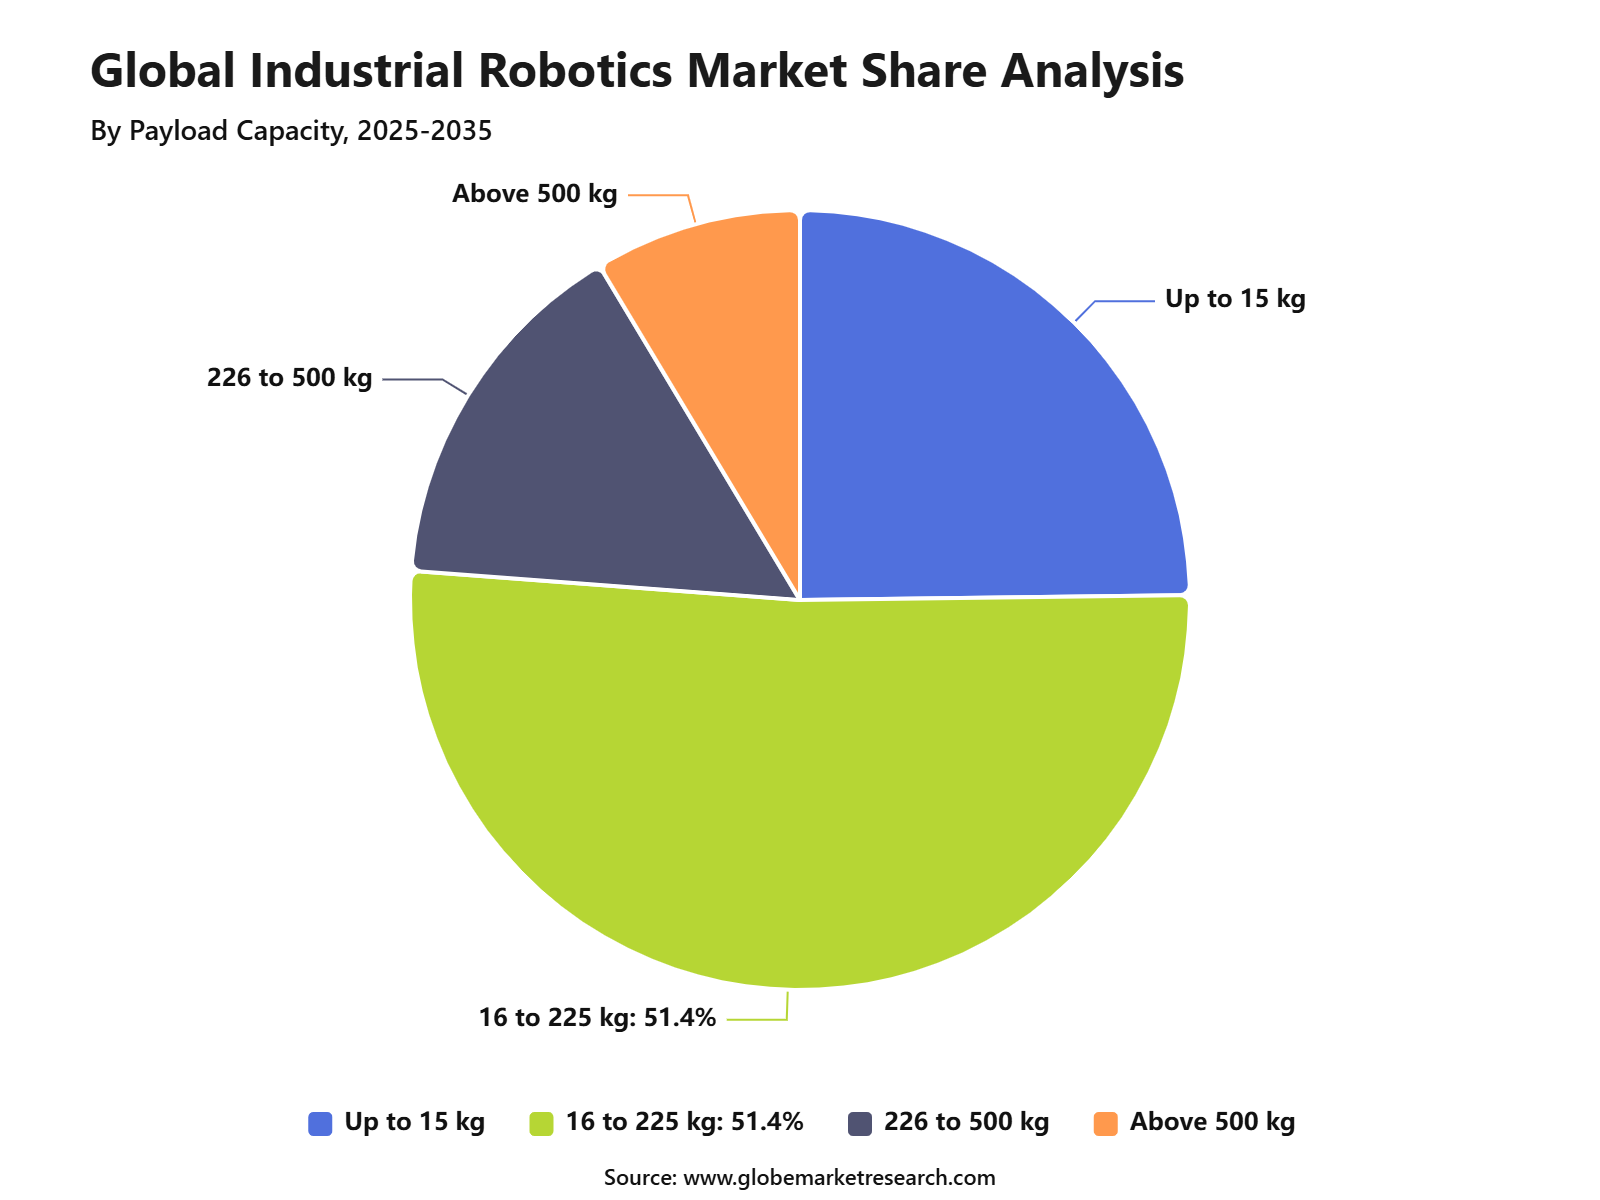
Robots with 16 to 225 kg payload capacity accounted for 51.4% share in 2025, driven by their suitability for medium-duty industrial tasks across automotive, electronics, metalworking, and packaging operations.
Material handling and packaging captured 33.4% share by application in 2025, supported by rising demand for faster movement, sorting, picking, palletizing, and packaging automation.
Automotive led the end-user industry with 36.3% share in 2025, driven by high adoption of robots in vehicle assembly, welding, painting, component handling, and quality inspection.
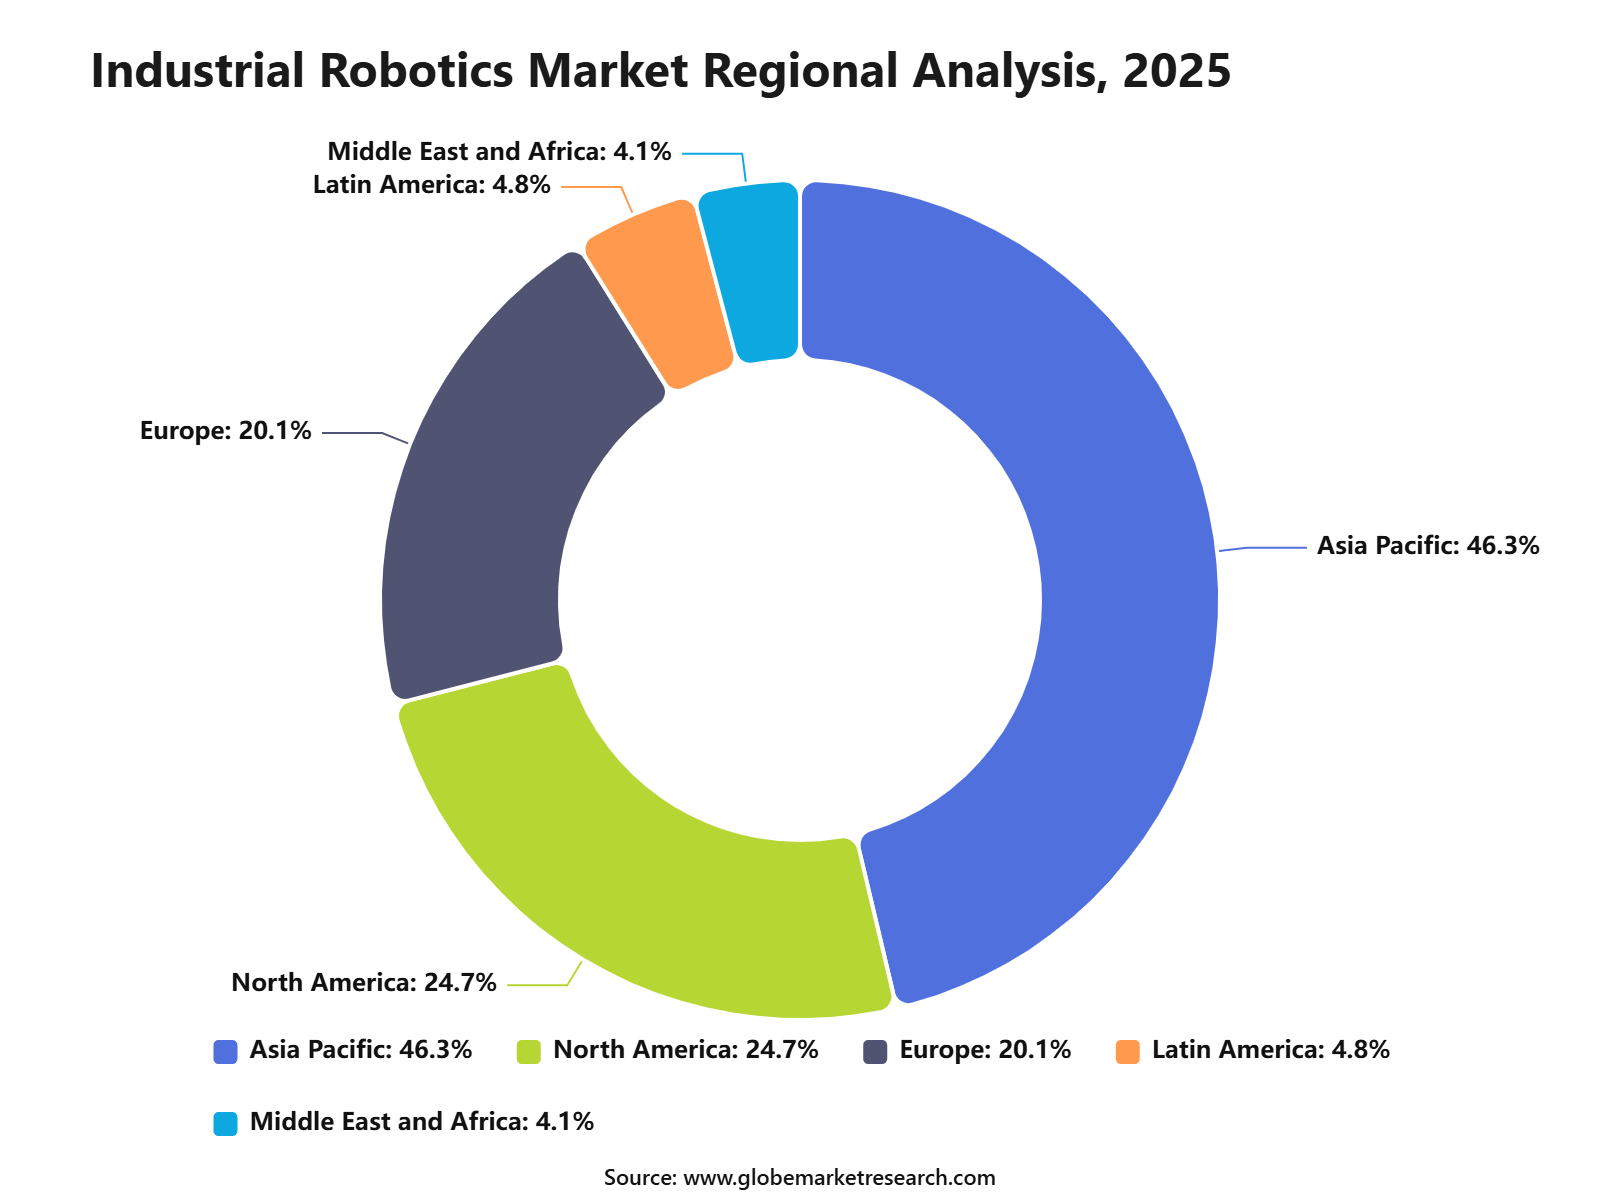
Asia Pacific held 46.3% share of the market, supported by strong manufacturing activity, high automation adoption, and expanding robotics deployment across China, Japan, South Korea, and India.
Go-to-Market and Sales Strategy
The Industrial Robotics Market needs an application-led go-to-market strategy because buyers purchase robots to solve specific factory problems, not only to modernize equipment. Suppliers should position robots around welding, material handling, packaging, assembly, painting, palletizing, machine tending, inspection, and cleanroom operations. IFR reported that 542,000 industrial robots were installed globally in 2024, and annual installations stayed above 500,000 units for the fourth consecutive year. The total operational stock reached 4,664,000 units in 2024, showing that robotics has become a core part of global manufacturing capacity.
Sales economics are strongest when robot vendors sell complete automation cells, software, grippers, vision systems, maintenance, integration, and training rather than only robot arms. In North America, A3 reported that companies ordered 9,055 robots valued at USD 543.1 million in Q1 2026, with units nearly flat year-on-year but revenue down 6.4%. Demand was stronger outside automotive OEMs, especially in life sciences, semiconductors and electronics, food and consumer goods, plastics and rubber, and other general industries.
Tariff Impact
Tariff impact is important because industrial robots depend on imported motors, drives, controllers, semiconductors, sensors, machine parts, aluminum, steel, copper, and precision components. The U.S. Section 232 tariff regime announced in June 2026 includes a 50% duty on products made of steel, aluminum, or copper, a 25% duty on many derivative products, and a temporarily reduced 15% duty on selected fixed industrial machinery and power equipment. This can raise procurement costs for automation systems and may make project payback periods longer for manufacturers.
Trade policy risk is also rising because the U.S. Department of Commerce initiated a Section 232 investigation into imports of robotics and industrial machinery in September 2025. The investigation covers robots, programmable mechanical systems, CNC machines, turning and milling machines, grinding and deburring equipment, industrial stamping and pressing machines, and related parts. For robot buyers and integrators, this increases the need for country-of-origin checks, tariff pass-through clauses, supplier diversification, and local assembly planning.
Robot Type Analysis
Articulated robots led the Industrial Robotics Market with 65.1% share in 2025, supported by their high flexibility, multi-axis movement, and strong use across welding, assembly, material handling, packaging, painting, and machine tending. These robots are preferred in manufacturing because they can perform complex movements with high speed, accuracy, and repeatability.
The growth of this segment can be attributed to rising automation in automotive, electronics, metal processing, food processing, and general manufacturing. Articulated robots are expected to remain the leading robot type as factories continue to adopt flexible automation systems that can handle multiple tasks on the same production line.
Payload Capacity Analysis
The 16 to 225 kg payload capacity segment held 51.4% share in 2025, making it the leading payload range in the Industrial Robotics Market. This range is widely used because it supports medium and heavy-duty industrial tasks, including part handling, palletizing, welding, machine loading, packaging, and assembly operations.
The segment is supported by demand from industries that require robots capable of lifting parts, tools, boxes, automotive components, metal products, and finished goods. Robots in this payload range offer a strong balance of strength, speed, workspace coverage, and operational flexibility, which makes them suitable for high-volume production environments.
 iThe graph shows projected market growth until 2035 based on CAGR analysis. Actual outcomes may vary depending on changing demand, competition, and economic factors.To gain greater insights - request a sample report PDF
Application Analysis
Material handling and packaging led the application segment with 33.4% share in 2025, supported by rising demand for faster, safer, and more consistent movement of goods across factories and warehouses. Industrial robots are widely used for picking, placing, sorting, palletizing, case packing, loading, unloading, and end-of-line packaging.
The growth of this segment can be linked to labor shortages, higher production volumes, and the need to reduce manual handling risks. Manufacturers are using robots to improve throughput, reduce product damage, increase packaging accuracy, and support continuous production across automotive, electronics, food and beverages, pharmaceuticals, and consumer goods.
End-User Industry Analysis
The automotive industry led the end-user segment with 36.3% share in 2025, supported by strong use of industrial robots in welding, painting, assembly, part transfer, battery production, inspection, and material handling. Automotive plants require high precision and repeatability, making robots essential for large-scale vehicle and component manufacturing.
The segment is also being supported by electric vehicle production, battery pack assembly, lightweight material handling, and rising demand for flexible manufacturing lines. Automakers are investing in robotics to improve productivity, reduce defects, support worker safety, and manage complex production requirements across traditional and electric vehicle platforms.
Regional Analysis
Asia Pacific led the Industrial Robotics Market with 46.3% share in 2025, supported by strong manufacturing activity, high robot installations, and large-scale automation across China, Japan, South Korea, India, and Southeast Asia. The region benefits from a deep base of automotive, electronics, semiconductor, machinery, metal, and consumer goods manufacturing.
The growth of Asia Pacific is being driven by rising labor costs, export-oriented production, government support for factory automation, and strong investment in smart manufacturing. The region is expected to remain the leading market as manufacturers continue to adopt articulated robots, material handling systems, packaging robots, and automated production lines to improve efficiency and competitiveness.
 iThe graph shows projected market growth until 2035 based on CAGR analysis. Actual outcomes may vary depending on changing demand, competition, and economic factors.To gain greater insights - request a sample report PDF
Risk Factors & Market Barriers
The main risk factor is uneven demand across end-use industries. Industrial robotics remains highly connected to automotive investment cycles, but automotive OEM orders can move sharply when EV plans, capital budgets, or production schedules change. A3 reported that North American automotive OEM robot orders fell 35.1% in units and 48.2% in revenue in Q1 2026, which had a major effect on total order revenue. This shows why robot suppliers need stronger exposure to electronics, healthcare, food, plastics, logistics, and general manufacturing.
Another barrier is integration complexity. Many factories still operate older production lines, mixed equipment brands, manual workflows, and limited plant-level data systems. A robot installation often requires tooling, safety fencing, vision, programming, worker training, line balancing, preventive maintenance, and software integration. If these costs are not planned correctly, the total project cost can be much higher than the robot purchase price, which can delay adoption among small and mid-sized manufacturers.
Regulatory & Compliance Risks
Regulatory and compliance risk is mainly linked to worker safety, machine guarding, risk assessment, emergency stops, collaborative robot operation, cybersecurity, and documented validation. ANSI and A3 published the revised R15.06-2025 industrial robot safety standard, marking the first major update in more than a decade. The 2025 update reflects changes in robot technology and integration practice, which means manufacturers, integrators, and plant operators need updated safety reviews before deploying new systems.
Compliance pressure is higher for collaborative robots because people and robots may work in the same production area. In Q1 2026, A3 reported that collaborative robots accounted for 18.1% of all North American robot units ordered and 12.9% of order revenue. This growing adoption increases the need for speed and separation monitoring, safe stop functions, operator training, documented risk assessment, and clear responsibility between robot makers, integrators, and factory owners.
Market Adoption Barriers
Market adoption barriers are mainly linked to upfront cost, payback uncertainty, skill gaps, and production disruption during installation. Many manufacturers want automation, but they need proof that robots will reduce scrap, improve quality, increase throughput, lower injury risk, and solve labor shortages without creating new downtime. This is why robot suppliers should offer pilot programs, leasing options, ROI calculators, operator training, and after-sales support. The strongest adoption is expected where labor availability is tight and production quality requirements are high.
Regional adoption also remains uneven. IFR reported that Asia accounted for 74% of new robot deployments in 2024, compared with 16% in Europe and 9% in the Americas. China alone installed 295,000 robots in 2024, representing 54% of global deployments, while the U.S. installed 34,200 units. This gap shows that robot adoption is becoming a competitiveness issue, especially for countries that want to strengthen domestic manufacturing.
Revenue Potential Analysis
Revenue Landscape Across
The revenue landscape is spread across automotive, electronics, metals and machinery, plastics and rubber, food and beverages, life sciences, pharmaceuticals, packaging, logistics, semiconductors, and general manufacturing. Asia remains the largest deployment base, while North America is showing broader demand outside automotive. In Q1 2026, North American robot orders grew strongly in life sciences and pharma, semiconductors and electronics, plastics and rubber, food and consumer goods, and other general industries, even as automotive OEM demand weakened.
Robot density also shows where long-term revenue opportunity exists. IFR reported that South Korea had the world’s highest robot density in 2024 with 1,220 robots per 10,000 manufacturing employees, followed by Singapore with 818 and Germany with 449. The U.S. had 307 robots per 10,000 employees, while China had 166 but also the world’s largest operational stock of about 2 million robots. These figures show that high-density countries offer replacement and upgrade revenue, while lower-density markets offer new deployment opportunities.
Financial Impact
The financial impact can be positive for robot suppliers, system integrators, software providers, sensor makers, and automation service companies that offer full factory solutions. Revenue can be created through robot sales, installation, programming, safety validation, spare parts, maintenance contracts, vision systems, end-of-arm tooling, simulation software, and training. A3 reported that collaborative robot orders in North America increased 55.6% in units and 78.2% in revenue in Q1 2026, showing that flexible automation can create stronger value beyond traditional large robot systems.
Financial risk remains high because robot projects are capital-intensive and depend on customer confidence, interest rates, industrial production, tariff policy, and payback timing. If tariffs increase the cost of robot components, steel structures, control cabinets, sensors, and electrical systems, buyers may delay automation projects or reduce project scope. The strongest financial position is expected for companies that combine robots with software, integration, maintenance, and measurable productivity gains, because customers are more likely to approve automation spending when the return is clearly visible.
Market Trend Analysis
Impact Factor | Estimated CAGR Impact | Regional Relevance | Market Impact |
|---|---|---|---|
Growth of articulated robots | +3.2% | Automotive, electronics, machinery | Leads industrial adoption. |
Material handling automation | +2.8% | Global manufacturing plants | Drives daily usage. |
Collaborative robot adoption | +2.5% | SMEs and flexible production lines | Supports safer automation. |
AI and machine vision integration | +2.2% | Developed industrial regions | Improves robot accuracy. |
Robotics-as-a-service models | +1.8% | North America, Europe, Asia Pacific | Reduces entry cost. |
Technology Adoption Analysis
Impact Factor | Estimated CAGR Impact | Regional Relevance | Market Impact |
|---|---|---|---|
AI-based robot control | +2.8% | North America, Europe, Asia Pacific | Improves automation intelligence. |
Machine vision systems | +2.5% | Electronics, automotive, packaging | Enhances inspection accuracy. |
Advanced sensors and end-effectors | +2.2% | Global | Improves task flexibility. |
Industrial IoT connectivity | +2.0% | Smart factories | Enables real-time monitoring. |
Robot simulation and digital twins | +1.7% | Developed manufacturing hubs | Reduces deployment risk. |
Segment Covered in the Report
By Robot Type
Articulated Robots
Linear Robots
SCARA Robots
Collaborative Robots
Cartesian / Gantry Robots
Parallel / Delta Robots
Cylindrical Robots
By Payload Capacity
Up to 15 kg
16 to 225 kg
226 to 500 kg
Above 500 kg
By Application
Material Handling and Packaging
Welding and Soldering
Assembly and Dispensing
Machine Tending and CNC
Painting and Coating
Quality Inspection
By End-User Industry
Automotive
Electrical and Electronics
Food and Beverage
Machinery and Metal
Pharmaceuticals and Healthcare
Construction Materials
Others
By Region
North America
Europe
Asia Pacific
Latin America
Middle East and Africa
Drivers Impact Analysis
Impact Factor | Estimated CAGR Impact | Regional Relevance | Market Impact |
|---|---|---|---|
Rising factory automation | +3.4% | Asia Pacific, North America, Europe | Improves production efficiency. |
Growth in automotive manufacturing | +3.0% | China, Japan, Germany, U.S., South Korea | Drives robot deployment. |
Increasing labor cost pressure | +2.6% | North America, Europe, developed Asia | Supports automation adoption. |
Demand for precision and repeatability | +2.3% | Electronics, automotive, metals | Improves product quality. |
Expansion of smart manufacturing | +2.0% | Global industrial hubs | Supports connected production. |
Restraints Impact Analysis
Impact Factor | Estimated CAGR Impact | Regional Relevance | Market Impact |
|---|---|---|---|
High upfront investment cost | -1.8% | SMEs and emerging markets | Limits early adoption. |
Complex robot integration | -1.5% | Traditional manufacturing plants | Delays deployment. |
Shortage of skilled technicians | -1.3% | Global | Affects system operation. |
Maintenance and programming costs | -1.1% | Small and mid-sized manufacturers | Raises ownership cost. |
Slow adoption in low-wage markets | -0.9% | Africa, Latin America, parts of Asia | Reduces automation urgency. |
Opportunities Impact Analysis
Impact Factor | Estimated CAGR Impact | Regional Relevance | Market Impact |
|---|---|---|---|
Growth in collaborative robots | +3.1% | North America, Europe, Asia Pacific | Expands SME adoption. |
Expansion in electronics manufacturing | +2.8% | China, South Korea, Taiwan, Japan | Supports precision assembly. |
Robotics in warehousing and logistics | +2.5% | U.S., Europe, China, India | Improves material handling. |
Demand for robotic welding and painting | +2.2% | Automotive and metal industries | Enhances process quality. |
AI-enabled industrial robots | +2.0% | Developed manufacturing hubs | Improves decision accuracy. |
Challenges Impact Analysis
Impact Factor | Estimated CAGR Impact | Regional Relevance | Market Impact |
|---|---|---|---|
Integration with legacy equipment | -1.5% | Older factories | Increases project complexity. |
Cybersecurity risks in connected robots | -1.2% | Smart factories globally | Raises security burden. |
Downtime during installation | -1.0% | Manufacturing facilities | Affects production flow. |
Robot safety compliance | -0.9% | North America, Europe, Asia Pacific | Requires strict controls. |
ROI uncertainty for smaller firms | -0.8% | SMEs | Slows purchase decisions. |
Recent Developments
March 2026, FANUC America announced U.S. manufacturing expansion
FANUC America announced a USD 90 million investment to acquire property and construct a new 840,000 sq. ft. facility in Michigan. The facility is intended to create production-ready capacity for potential expansion of U.S. based robot manufacturing. The project is targeted for completion in late 2027 and is expected to add 225 jobs. FANUC also stated that it has invested nearly USD 300 million in new U.S. facilities since 2019, expanding its footprint to 3 million sq. ft. and creating more than 700 jobs.
March 2026, ABB and NVIDIA partnered on physical AI for industrial robots
ABB Robotics partnered with NVIDIA to improve industrial robot training and reduce the gap between simulation and real factory performance. The system, RobotStudio HyperReality, integrates NVIDIA Omniverse libraries into ABB’s robot simulation environment and is expected to be available in the second half of 2026. The technology is designed to help manufacturers train robots virtually before deployment, improving commissioning speed, accuracy, and scalability.
March 2026, Skild AI and NVIDIA deployed robot intelligence in manufacturing
Skild AI deployed its AI model on robots used at Foxconn’s Houston assembly lines for NVIDIA Blackwell GPU server racks. The company also partnered with ABB Robotics and Universal Robots to embed its software across industrial robots. This development is important because it shows the movement from fixed-task industrial robots toward more adaptive robotic systems that can handle changing production tasks.
Report Scope
Report Highlights | Details |
|---|---|
Market Revenue (2025) | USD 56.8 Billion |
Forecast Revenue (2035) | USD 192.1 Billion |
CAGR (2025-2035) | 12.9% |
Base Year for Estimation | 2025 |
Historic Data | 2020-2024 |
Forecast Period | 2025-2035 |
Report Coverage | AI market impact analysis, market surveys, trade analysis, Industry & competitive intelligence, Revenue projections, company positioning, competitive analysis, growth drivers, and emerging market trends, Strategic Consultation & Advisory Services |
Segments Covered | By Robot Type (Articulated Robots, Linear Robots, SCARA Robots, Collaborative Robots, Cartesian / Gantry Robots, Parallel / Delta Robots, Cylindrical Robots), By Payload Capacity (Up to 15 kg, 16 to 225 kg, 226 to 500 kg, Above 500 kg), By Application (Material Handling and Packaging, Welding and Soldering, Assembly and Dispensing, Machine Tending and CNC, Painting and Coating, Quality Inspection), By End-User Industry (Automotive, Electrical and Electronics, Food and Beverage, Machinery and Metal, Pharmaceuticals and Healthcare, Construction Materials, Others) |
Regional Analysis | North America - US, Canada; Europe - Germany, France, The UK, Spain, Italy, Russia, Netherlands, Rest of Europe; Asia Pacific - China, Japan, South Korea, India, New Zealand, Singapore, Thailand, Vietnam, Rest of Latin America; Latin America - Brazil, Mexico, Rest of Latin America; Middle East & Africa - South Africa, Saudi Arabia, UAE, Rest of MEA |
Key companies profiled | ABB Ltd., FANUC Corporation, Yaskawa Electric Corp., KUKA AG, Mitsubishi Electric Corp., Kawasaki Heavy Industries, Nachi-Fujikoshi Corp., Denso Corporation, Omron Corporation, Universal Robots, Other Key Players |
Customization Scope | Tailored insights for specific regions, countries, and market segments can be provided. Additional report customization is available upon request. |
Competitive Landscape
The market is characterized by intense competition among established players and emerging companies. Strategic partnerships, mergers and acquisitions, and product innovation are key strategies employed by market participants.
Key Market Players
ABB Ltd.
FANUC Corporation
Yaskawa Electric Corp.
Mitsubishi Electric Corp.
KUKA AG
Kawasaki Heavy Industries
Nachi-Fujikoshi Corp.
Denso Corporation
Omron Corporation
Universal Robotsh
Other Key Players
Meet the Team
This report was prepared by our expert analysts with deep industry knowledge and research experience.
Pratiksha is market research analyst with strong experience in industry research, market forecasting, and competitive analysis. She specializes in identifying market trends, evaluating growth opportunities, and preparing data-driven insights across global industries. Her work supports businesses in understanding market dynamics, customer demand, regional opportunities, and strategic investment areas.
Sayali brings more than 5 years of experience to Globe Market Research, supporting the accuracy, clarity, and relevance of research content across multiple industries. She reviews market data, segment analysis, competitive insights, and industry trends to ensure each report meets strong quality standards and provides practical value to business decision-makers. Her expertise spans healthcare, information technology, consumer goods, and diverse cross-industry domains. With a strong focus on data reliability, structured analysis, and clear presentation, Sayali helps ensure that each research output delivers well-reviewed insights for clients, investors, consultants, and industry stakeholders.
Frequently Asked Questions
Related Reports
More in Manufacturing and Construction
Sustainable Construction Materials Market to hit USD 1,878.8 billion by 2035
Global Sustainable Construction Materials Market Size, Go-to-Market Analysis By Material Type (Green Cement, Bamboo, Recycled Glass, Hempcrete, Recycled Tires, Reclaimed Wood, Cork, Mycelium, Ferrock, Sheep Wool, Recycled Metal, Recycled Plastic, Ashcrete, Timbercrete, Cellulose Fiber), By Application (Exterior, Interior, Structural, Others), By End User (Residential, Commercial (Offices, Institutes,Hospitality & Leisure), Industrial), By Regional Insights, Business plan and Project Report, Investment Opportunities, Profitability, Industry Trends, Leading Companies and Growth Forecasts By 2025-2035
Real Estate Market to hit USD 8,602.5 billion by 2035
Global Real Estate Market Size, Share Analysis By Property Type (Residential Real Estate, Commercial Real Estate, Agricultural Land), By Commercial Asset Type (Office and Business Space, Retail, Industrial and Logistics, Hospitality, Healthcare Real Estate, Education Real Estate, Data Centers, Mixed-use Properties, Student Accommodation, Affordable Housing), By Service Type (Buying and Selling, Leasing and Renting, Property Management, Asset Management, Valuation, Development, Finance, Advisory and Consultancy), By End User (Individual Buyers and Renters, Real Estate Developers, Corporates, Institutional Investors, REITs, Government and Public Sector, Agricultural Landowners), By Regional Insights, Business plan and Project Report, Investment Opportunities, Profitability, Industry Trends, Leading Companies and Growth Forecasts By 2025-2035