

Revenue, 2026
USD 310.5 Bn
Forecast, 2035
USD 1,400.7 Bn
CAGR, 2026-2035
18.2%
Report Coverage
Global
Market Size and Forecast
The Global Solar Energy Market was worth USD 310.5 billion in 2026 and is expected to reach USD 1,400.7 billion by 2035, growing at a CAGR of 18.2% from 2026 to 2035. Asia Pacific held the largest regional share of 50.6% in 2026, valued at around USD 157.1 billion, supported by large-scale solar parks, rooftop solar adoption, strong manufacturing capacity, and rising clean-power investment.
The Solar Energy Market includes solar photovoltaic systems, concentrated solar power, solar thermal systems, rooftop solar, utility-scale solar plants, hybrid solar projects, and storage-connected solar solutions. These systems are widely used across residential buildings, commercial facilities, industrial sites, agriculture, utilities, public infrastructure, and off-grid power applications. Solar energy is becoming a major part of clean electricity generation because it offers scalable, low-emission, and cost-efficient power.
Market growth is being supported by rising electricity demand, falling solar panel costs, government incentives, net-metering policies, and stronger corporate demand for renewable power. Utilities and private developers are expanding solar capacity to support grid supply, data centers, electric vehicles, and industrial operations. Demand is also increasing for solar-plus-storage, floating solar, bifacial modules, and distributed rooftop systems.
Asia Pacific is expected to remain the leading region due to rapid energy demand growth, strong solar manufacturing, and large deployment across China, India, Japan, Australia, South Korea, and Southeast Asia. Regional growth is supported by utility-scale projects, rooftop programs, grid investment, and clean-energy targets. Long-term market growth will depend on panel efficiency, storage affordability, transmission capacity, land availability, project financing, and stable solar policy support.
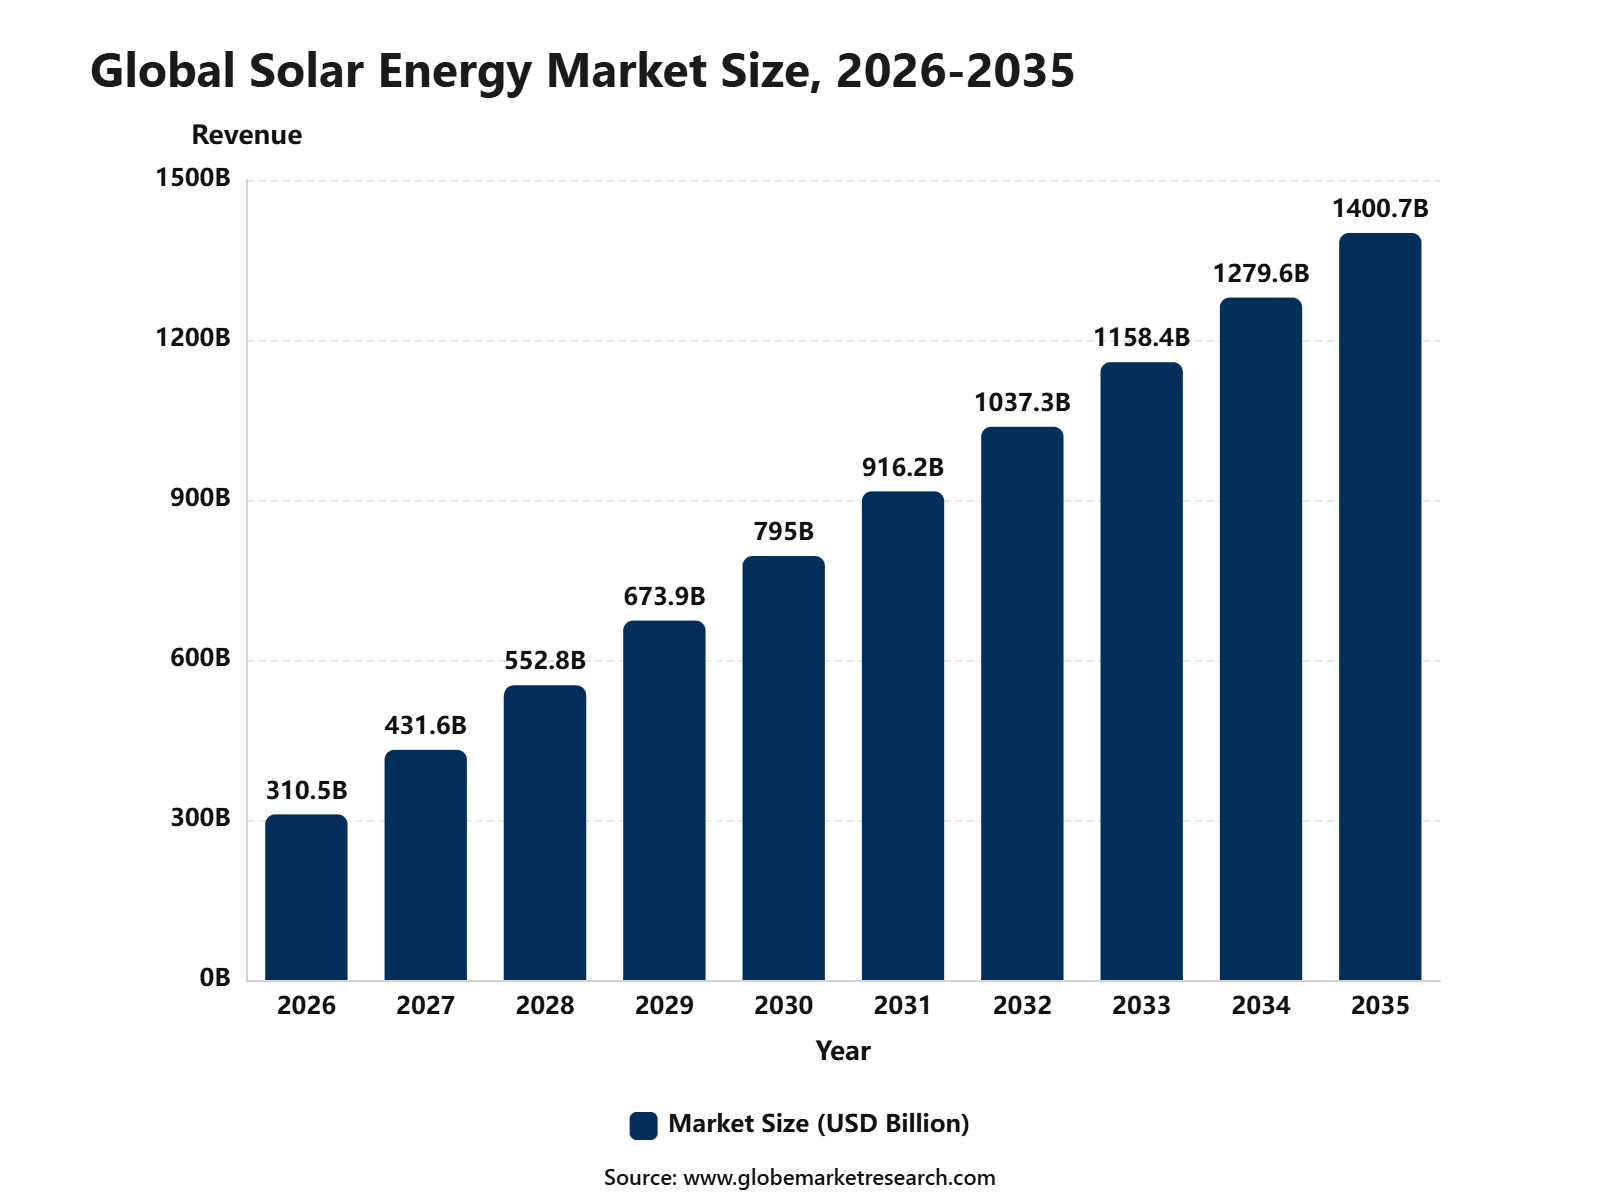 iThe graph shows projected market growth until 2035 based on CAGR analysis. Actual outcomes may vary depending on changing demand, competition, and economic factors.To gain greater insights - request a sample report PDF
Key Market Insights
Solar photovoltaic technology led the technology segment with 90.2% share, supported by wide adoption in rooftop systems, utility-scale solar farms, commercial projects, and distributed power generation.
Monocrystalline modules accounted for 70.3% share, driven by higher efficiency, better performance in limited space, longer lifespan, and strong use in premium solar installations.
On-grid systems held 88.3% share by grid connectivity, supported by easy grid integration, net metering benefits, reliable power distribution, and rising use in large solar projects.
Utility-scale applications captured 69.1% share, driven by growing investment in large solar parks, clean power procurement, and rising demand for grid-connected renewable electricity.
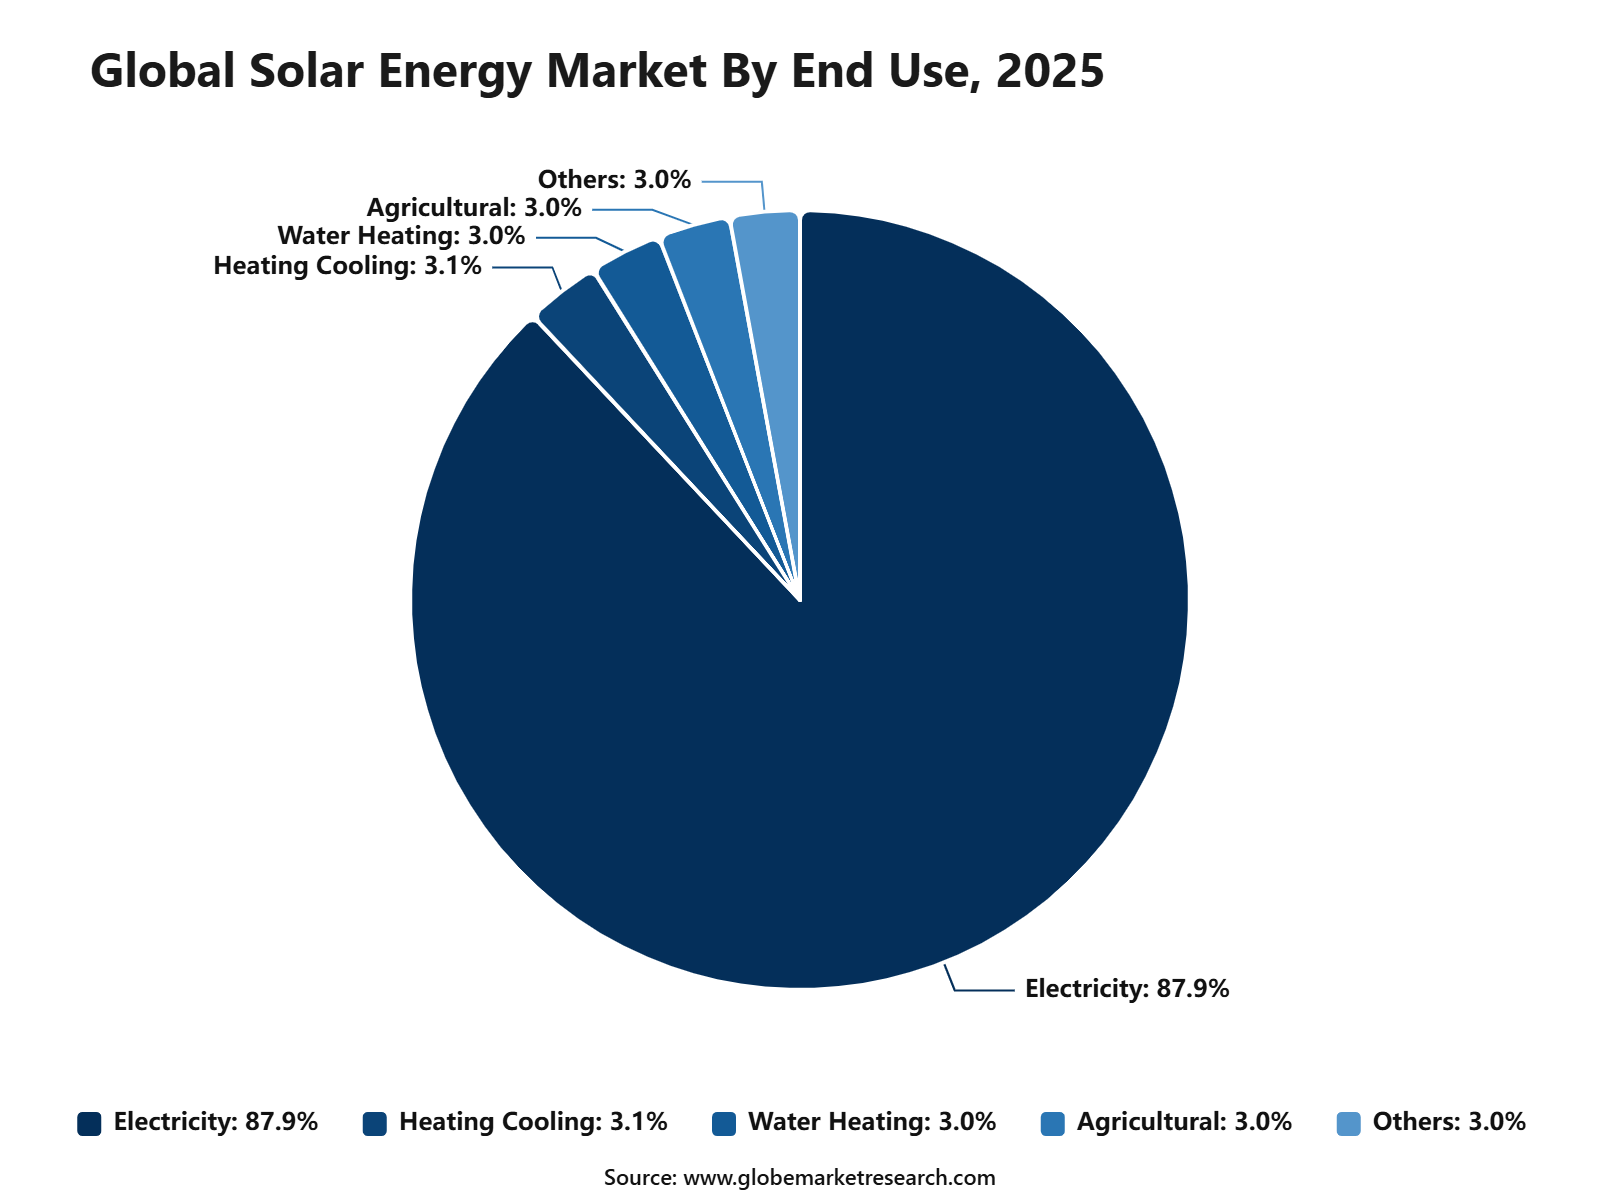
Electricity generation led the end-use segment with 87.9% share, supported by increasing demand for clean power, lower solar generation costs, and wider replacement of fossil fuel-based electricity.
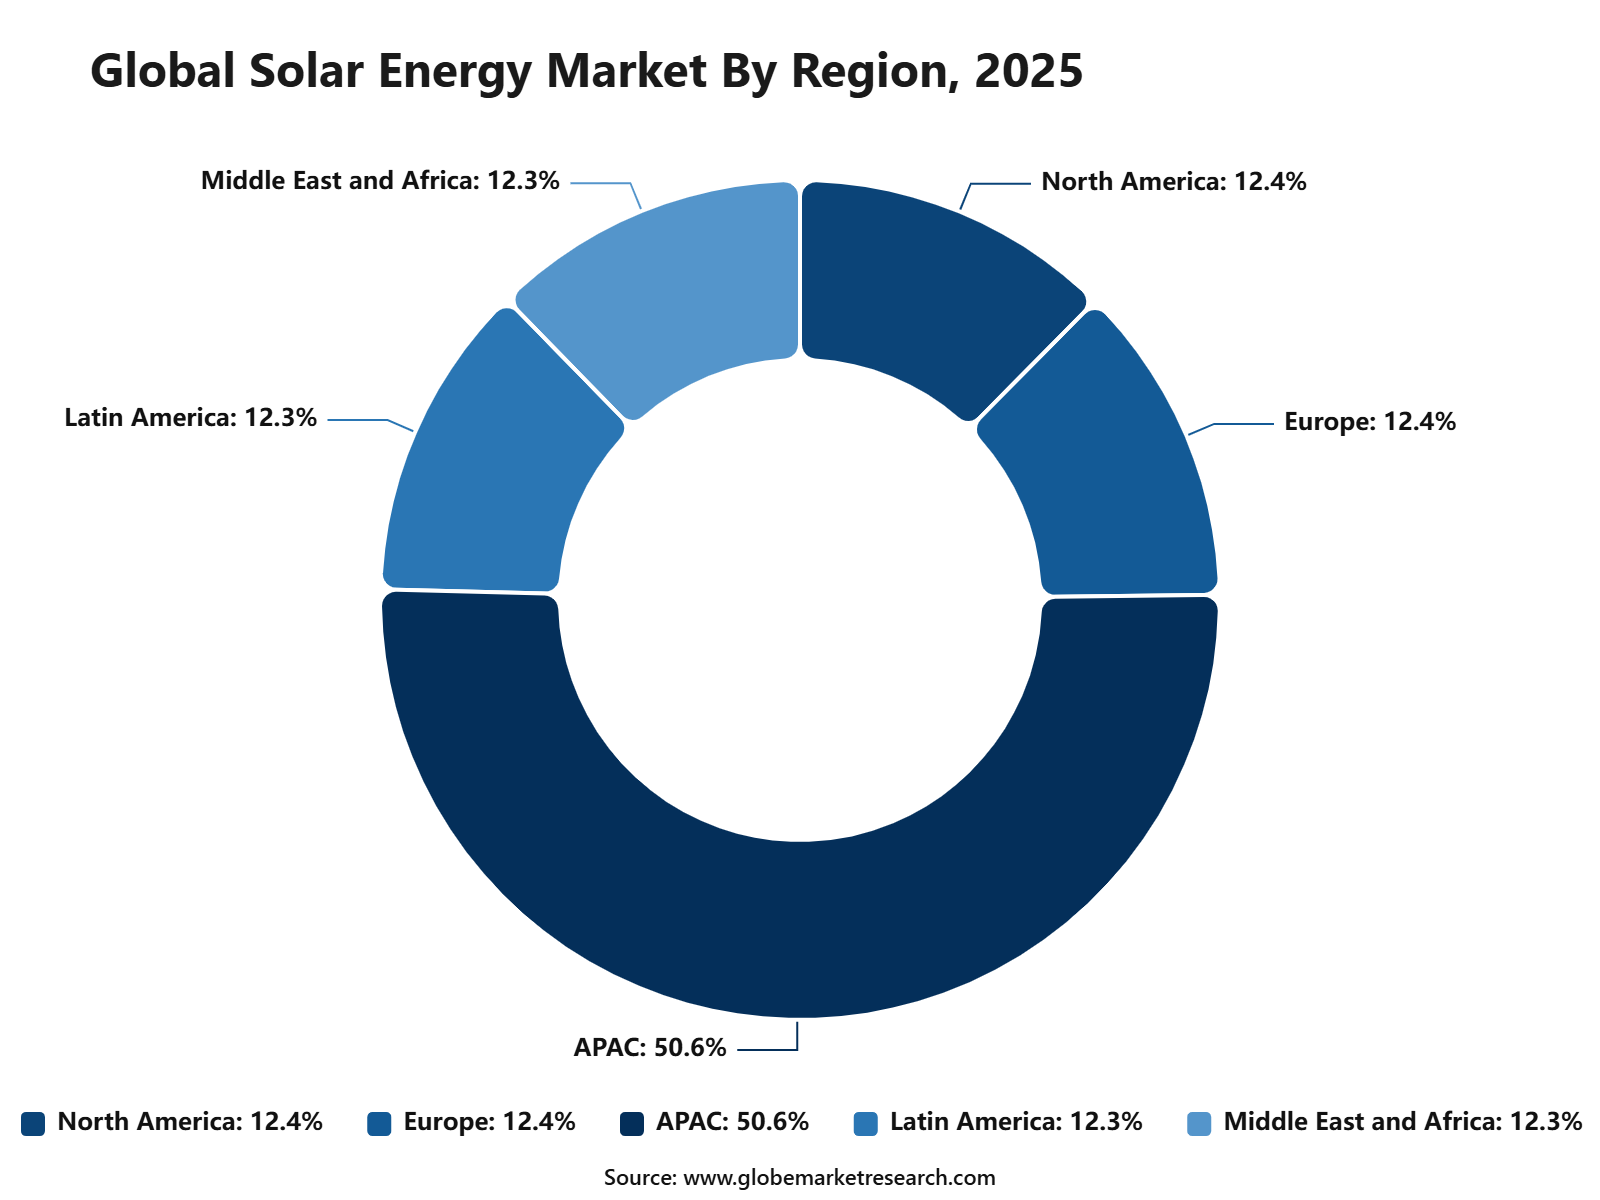
Asia Pacific led the solar energy market with 50.6% share, valued at USD 157.1 billion, supported by strong solar manufacturing, large-scale installations, rising electricity demand, and clean energy expansion across China, India, Japan, and Southeast Asia.
Top Funding and Investment
Top Investments
ACWA Power Consortium, USD 8.3 Billion, July 2025: ACWA Power, Aramco Power and Badeel committed SAR 31 billion to five utility-scale solar photovoltaic plants and two wind projects in Saudi Arabia. The combined projects will provide 15 GW of renewable power capacity by 2028.
Masdar, More Than AED 22 Billion, October 2025: Masdar advanced a round-the-clock renewable energy project in Abu Dhabi involving 5.2 GW of solar photovoltaic capacity and 19 GWh of battery storage. The approximately USD 6.0 billion project is designed to deliver 1 GW of continuous electricity.
Greenbacker Renewable Energy, USD 950 Million, January 2025: Greenbacker secured financing for the acquisition, construction and operation of the 674 MWdc Cider Solar Farm in New York. The project is expected to produce sufficient electricity for approximately 120,000 homes annually.
Enbridge, USD 900 Million, July 2025: Enbridge approved the development of the 600 MW Clear Fork Solar project near San Antonio, Texas. Meta contracted the project’s entire electricity output, with commercial operations planned to begin during summer 2027.
AMEA Power and Kyuden International, More Than USD 700 Million, December 2025: The companies invested in a 1,000 MW solar photovoltaic project with a 600 MWh battery storage system in Egypt. The project secured USD 570 million in senior financing and is scheduled to begin operations in June 2026.
Top Funding Deals
Origis Energy, More Than USD 1.0 Billion, January 2025: Brookfield Asset Management and Antin Infrastructure Partners provided a strategic investment exceeding USD 1 billion. The funding supports Origis Energy’s portfolio of operating, construction-ready and development-stage solar and battery storage projects across the United States.
Silicon Ranch, USD 500 Million, June 2025: AIP Management completed a USD 500 million strategic investment in Silicon Ranch. The capital will support the expansion of its solar and battery storage portfolio, which included approximately 3.6 GW of operating capacity and 3.8 GW under construction or contract.
HoloSolis, EUR 220 Million, November 2025: HoloSolis secured approximately USD 255 million to develop a solar module manufacturing facility in France. The planned factory will have an annual production capacity of 5 GW and is expected to create around 2,000 direct jobs.
Top Acquisitions
TPG Acquisition of Altus Power, USD 2.2 Billion, April 2025: TPG completed the acquisition of Altus Power in a transaction valued at approximately USD 2.2 billion, including debt. The acquisition added nearly 1 GW of commercial-scale solar assets located across the United States.
Stonepeak Acquisition of Repsol Solar Portfolio Stake, USD 340 Million, April 2025: Stonepeak agreed to acquire a 46.3% interest in Repsol’s 777 MW solar and battery storage portfolio in Texas and New Mexico. The acquired assets include the 632 MW Frye Solar project and the Jicarilla solar-plus-storage facility.
By Technology
Solar photovoltaic accounted for 90.2% share of the Solar Energy Market. This leading position is supported by its wide use in converting sunlight directly into electricity across utility-scale solar parks, commercial rooftops, industrial facilities, and residential installations.
The segment is widely preferred because solar photovoltaic systems are modular, scalable, and easier to install compared with other solar technologies. They also offer lower operating costs, faster deployment, and strong compatibility with on-grid power systems.
Demand is expected to remain strong as governments, utilities, and private developers continue to expand clean electricity capacity. Growth will be supported by falling module costs, high-efficiency panels, rooftop solar adoption, and large utility-scale photovoltaic projects.
By Module Type
Monocrystalline modules accounted for 70.3% share of the Solar Energy Market. This dominance is driven by their higher efficiency, better power output, longer service life, and strong performance in limited-space installations.
The segment is widely preferred because monocrystalline panels generate more electricity per square meter compared with many other module types. They are commonly used in utility-scale plants, commercial rooftops, residential systems, and premium solar installations.
Demand is expected to remain strong as solar developers and end users focus on better energy yield and long-term project returns. Growth will be supported by advanced cell technologies, higher-efficiency modules, and rising deployment of space-efficient solar systems.
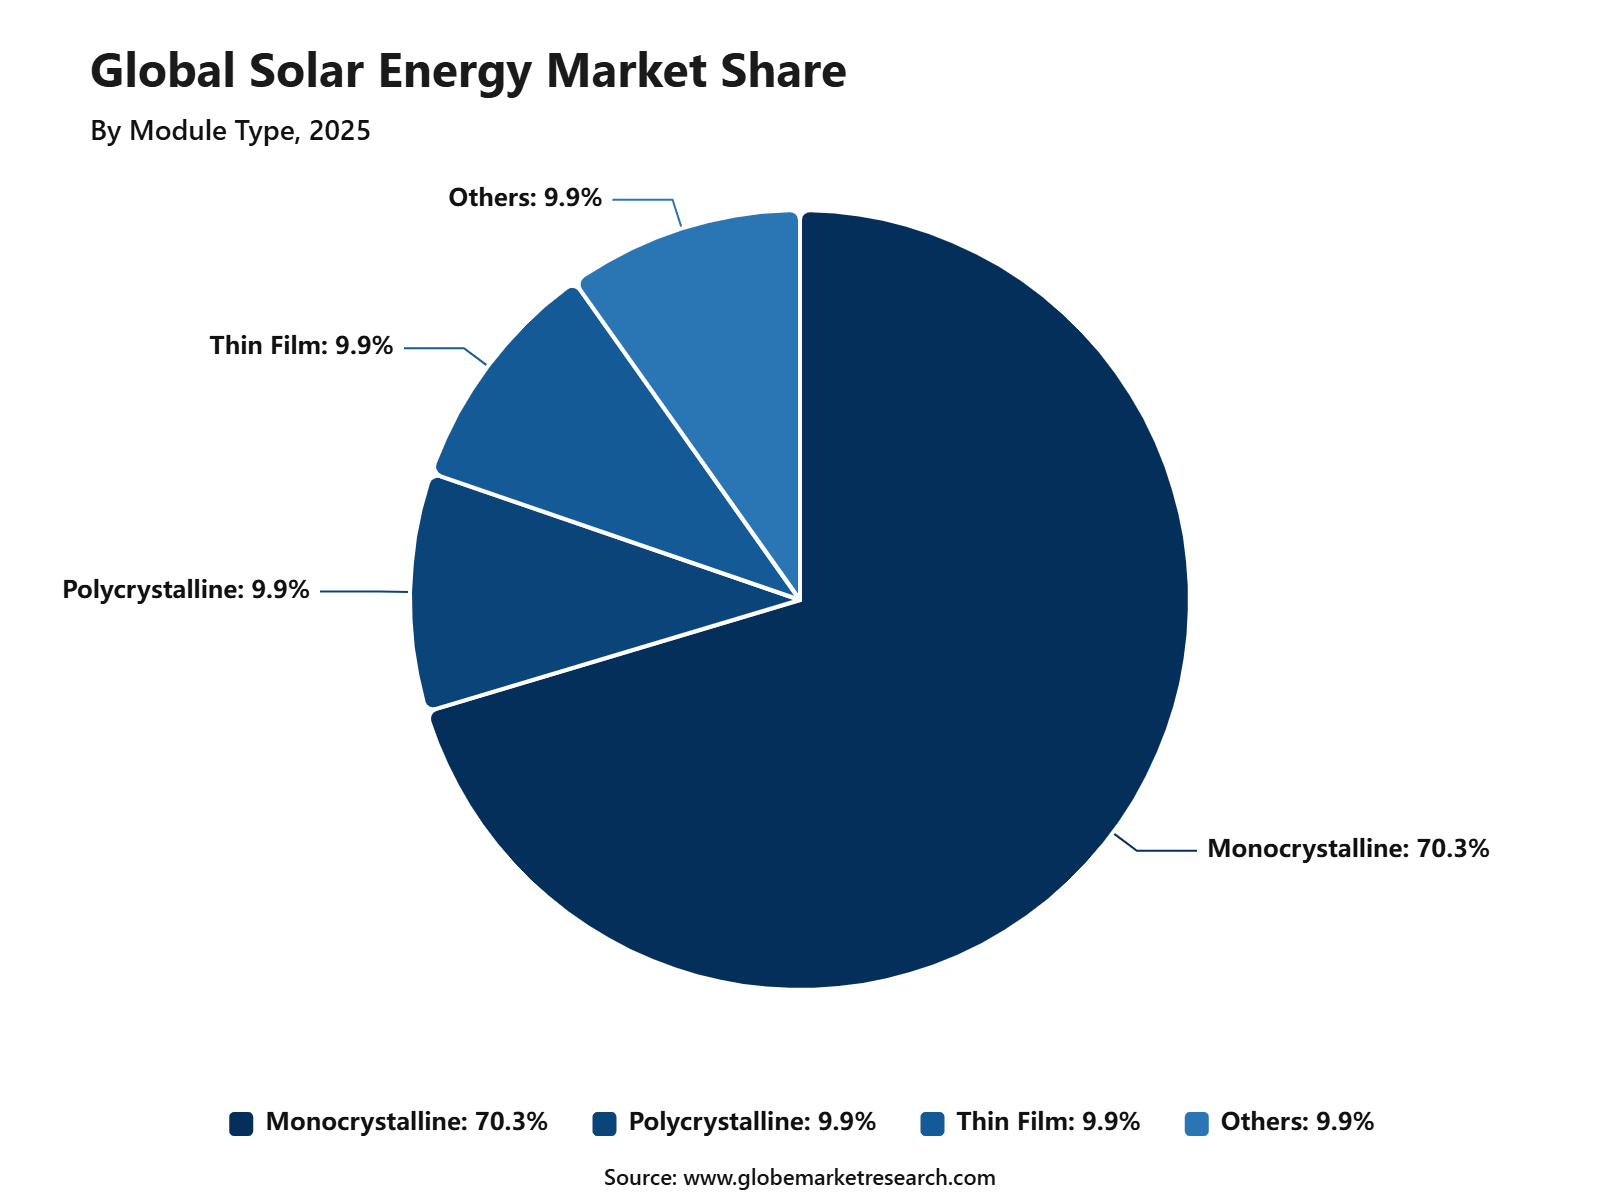 iThe graph shows projected market growth until 2035 based on CAGR analysis. Actual outcomes may vary depending on changing demand, competition, and economic factors.To gain greater insights - request a sample report PDF
By Grid Connectivity
On-grid systems accounted for 88.3% share of the Solar Energy Market. This leading share is supported by the strong use of solar systems connected directly to national, regional, and local electricity grids.
The segment is widely preferred because on-grid systems allow generated solar power to be supplied, balanced, and distributed through existing electricity networks. They are important for utility-scale projects, commercial solar plants, and grid-connected rooftop installations.
Demand is expected to remain strong as solar capacity continues to expand across power grids. Growth will be supported by utility procurement, net metering, power purchase agreements, smart grid upgrades, and rising demand for clean electricity.
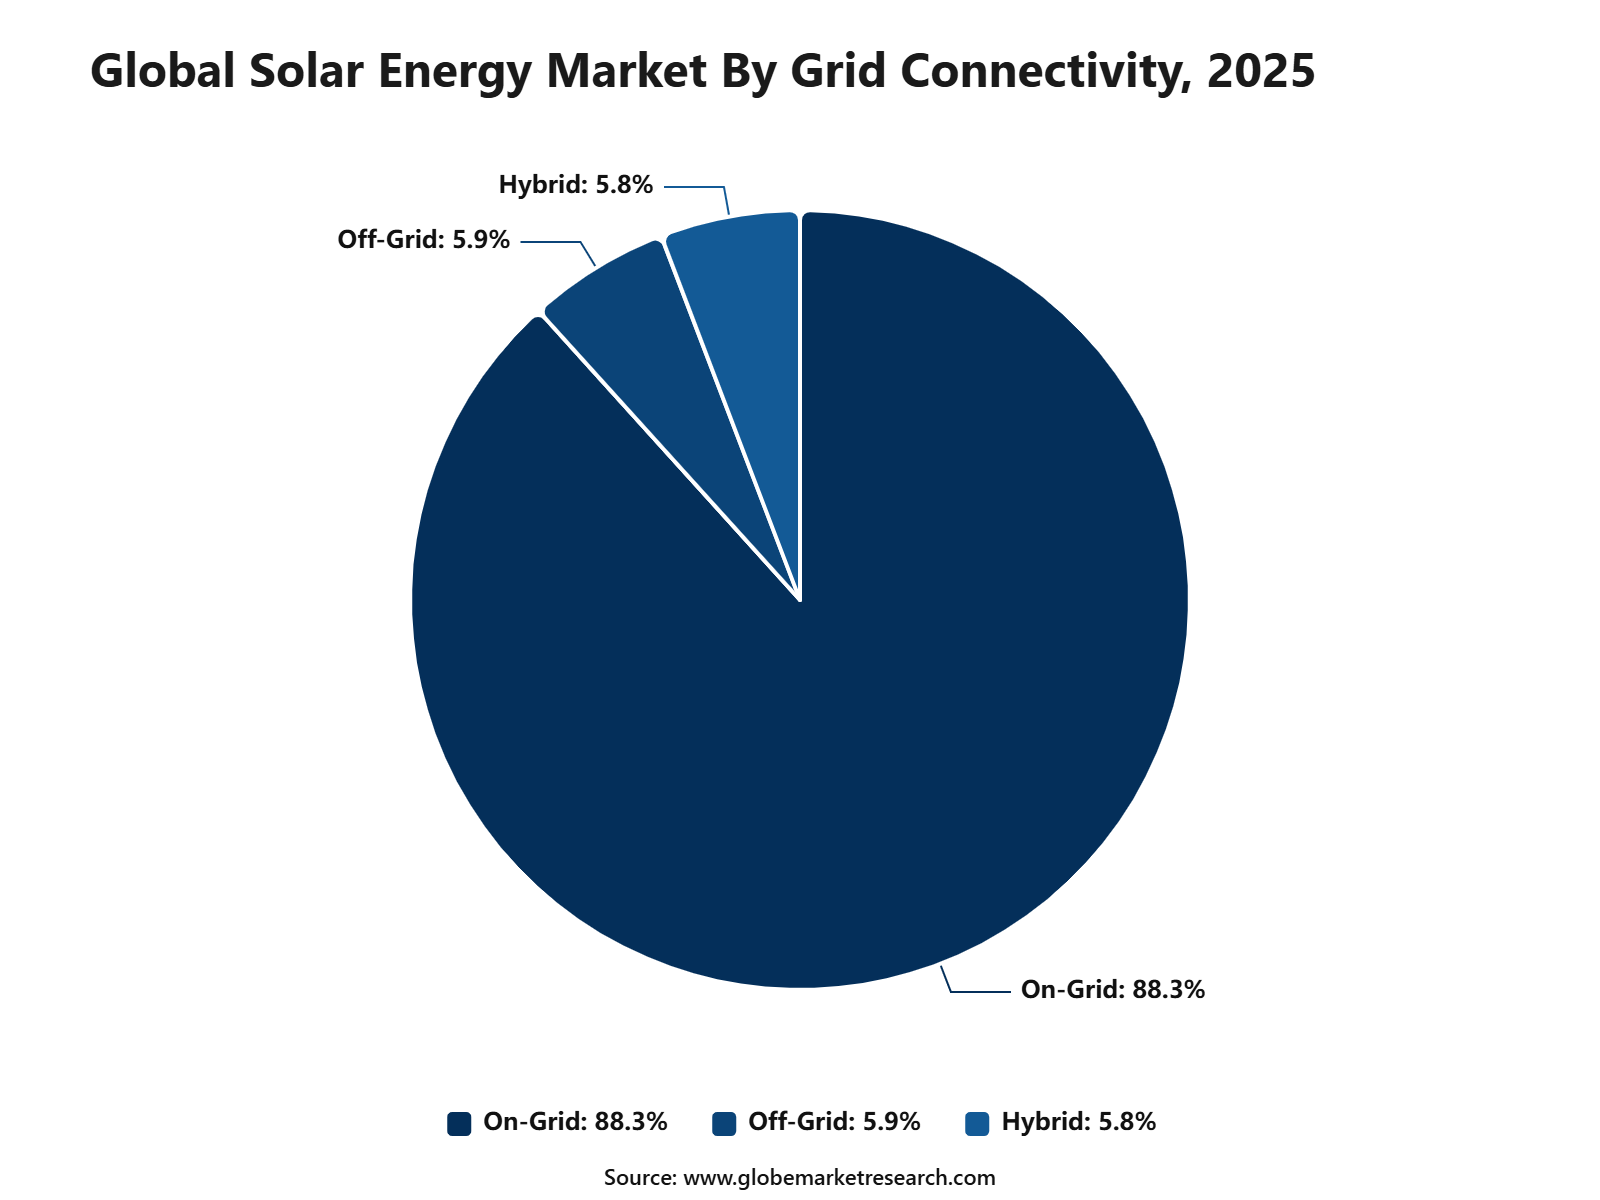 iThe graph shows projected market growth until 2035 based on CAGR analysis. Actual outcomes may vary depending on changing demand, competition, and economic factors.To gain greater insights - request a sample report PDF
By Application
Utility-scale applications accounted for 69.1% share of the Solar Energy Market. This leading position is supported by large solar power plants developed to supply electricity to grids, utilities, and major power buyers.
The segment is widely preferred because utility-scale solar projects provide economies of scale, lower unit power costs, and better integration with long-term energy planning. These projects are commonly supported by renewable energy auctions, power purchase agreements, and public-private investments.
Demand is expected to remain strong as utilities and independent power producers continue to add solar capacity. Growth will be supported by large solar parks, grid-connected systems, clean power targets, and the need to replace fossil-based electricity generation.
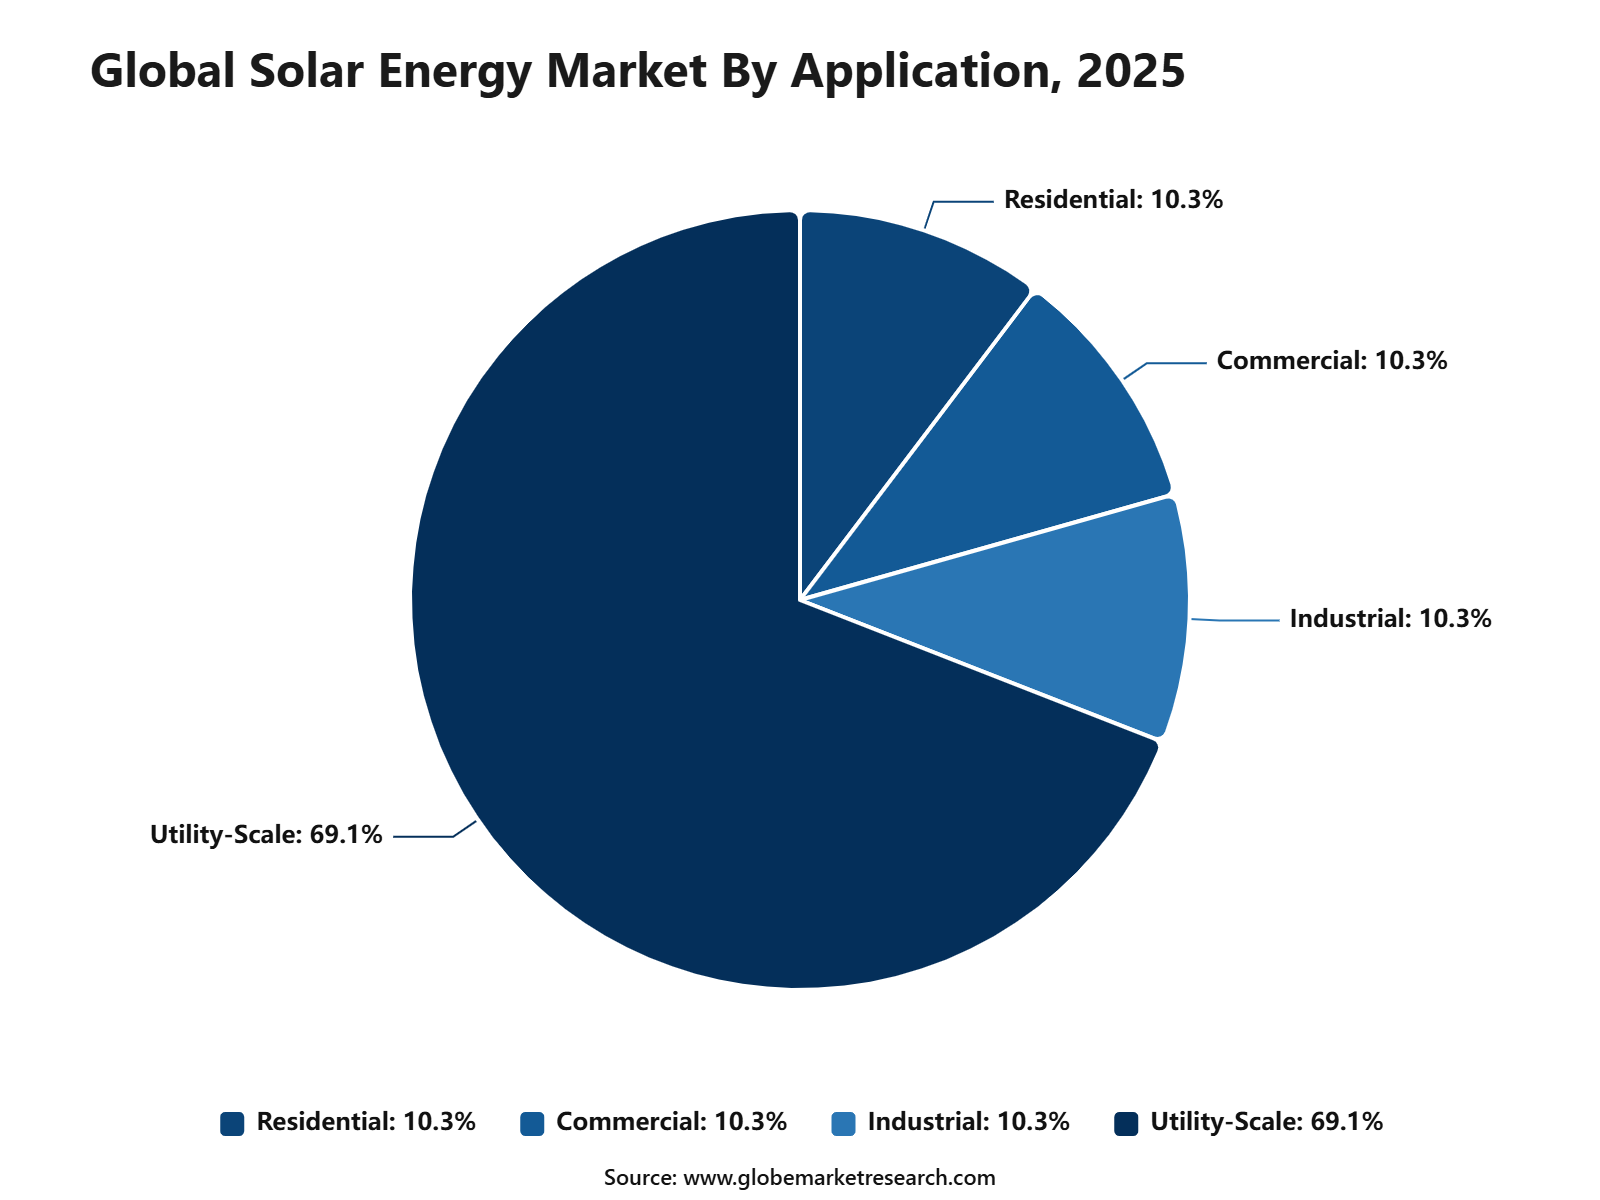 iThe graph shows projected market growth until 2035 based on CAGR analysis. Actual outcomes may vary depending on changing demand, competition, and economic factors.To gain greater insights - request a sample report PDF
By End Use
Electricity generation accounted for 87.9% share of the Solar Energy Market. This dominance is driven by the core role of solar energy in producing clean power for households, businesses, industries, utilities, and public infrastructure.
The segment is widely supported by solar photovoltaic systems used across utility, commercial, industrial, and residential applications. Solar electricity helps reduce fuel dependence, lower emissions, and improve long-term energy security.
Demand is expected to remain strong as electrification increases across transport, buildings, manufacturing, and digital infrastructure. Growth will be supported by utility-scale solar projects, on-grid systems, rooftop installations, and rising demand for affordable renewable electricity.
 iThe graph shows projected market growth until 2035 based on CAGR analysis. Actual outcomes may vary depending on changing demand, competition, and economic factors.To gain greater insights - request a sample report PDF
By Region
Asia Pacific accounted for 50.6% share of the Solar Energy Market, reaching USD 157.1 billion. The region’s leadership is supported by strong solar photovoltaic deployment, large electricity demand, expanding utility-scale projects, and major manufacturing capacity for solar modules and components.
China, India, Japan, South Korea, Australia, Vietnam, and other Southeast Asian countries are key contributors to regional demand. The region benefits from high solar resource availability, government clean energy targets, rapid urbanization, and strong investment in grid-connected solar power.
Asia Pacific is expected to maintain its leading position as solar capacity continues to expand across major economies. Demand will remain supported by solar photovoltaic technology, monocrystalline modules, on-grid connectivity, utility-scale projects, and electricity generation applications.
 iThe graph shows projected market growth until 2035 based on CAGR analysis. Actual outcomes may vary depending on changing demand, competition, and economic factors.To gain greater insights - request a sample report PDF
Regional Impact Analysis
Asia Pacific leads the Solar Energy Market with 50.6% share in 2026, valued at around USD 157.1 billion, supported by large solar manufacturing capacity, strong power demand, utility-scale solar deployment, rooftop adoption, and government-backed clean energy programs. China and India remain major value contributors due to large-scale solar project pipelines and manufacturing strength.
Europe remains important because of rooftop solar expansion, energy security goals, and strong decarbonization policies. North America supports growth through utility-scale solar, solar-plus-storage projects, corporate power purchase agreements, and grid modernization investment.
Impact Factor | Estimated CAGR Impact | Regional Relevance | Market Impact |
|---|---|---|---|
Asia Pacific market leadership | +5.4% | Asia Pacific, 50.6% share in 2026 | Leads global value demand. |
China solar manufacturing scale | +4.8% | China | Drives major regional supply and deployment. |
India solar capacity expansion | +4.1% | India | Adds high-growth project demand. |
Europe rooftop solar growth | +3.4% | Germany, Spain, France, Italy, UK | Supports distributed solar expansion. |
North America solar-plus-storage growth | +2.9% | U.S. and Canada | Builds contracted clean power demand. |
Solar Energy Market Regional Improvement
The Solar Energy Market is improving across all major regions through larger utility projects, rooftop adoption, battery integration, grid upgrades and supportive government policies. Asia Pacific remains the strongest expansion centre, led by China and India, while Europe is increasing solar generation through building mandates and clean-power targets. North America is accelerating utility-scale capacity, whereas Latin America and the Middle East and Africa are advancing through auctions, corporate procurement and off-grid electrification.
Region | Recent Improvement | Supporting Data | Market Direction |
|---|---|---|---|
North America | Utility-scale solar pipelines are expanding, supported by battery storage and corporate power demand. | U.S. developers plan to add 43.4 GW of utility-scale solar capacity, compared with 27.2 GW previously added. | Strong growth in Texas, Arizona, California and Michigan, with storage becoming increasingly important. |
Europe | Solar capacity is rising through rooftop systems, utility projects and stronger building requirements. | EU solar PV capacity reached about 406 GW, while solar generation increased 24.6%. | Growth is shifting toward rooftop solar, storage, electrified buildings and grid flexibility. |
Asia Pacific | The region continues to lead global solar manufacturing, installation and renewable-capacity expansion. | China commissioned nearly 370 GW of solar PV, while Asia accounted for 74.2% of new renewable capacity. | Large-scale projects, domestic manufacturing and rising electricity demand support continued leadership. |
Latin America | Solar adoption is improving through competitive auctions, mining-sector demand and corporate power agreements. | Regional progress is concentrated in Brazil, Chile and Mexico, supported by strong solar resources and expanding transmission. | Utility-scale development remains the main opportunity, alongside distributed generation in commercial markets. |
Middle East and Africa | Solar investment is increasing through low-cost utility projects, mini-grids and rural electrification programs. | Deployment is supported by high solar irradiation, energy-access requirements and declining photovoltaic costs. | Gulf countries are scaling large solar parks, while African markets are prioritizing distributed and off-grid systems. |
Grid Access Unlocks Solar Growth
Grid access is the most important factor influencing Solar Energy Market expansion because generation assets cannot create revenue without timely interconnection and transmission capacity. Solar PV capacity additions surpassed 600 GW in 2025, increasing approximately 12%, while cumulative global capacity reached around 2,800 GW. Thirty countries installed more than 1 GW during the year, intensifying pressure on grid planning and connection systems.
Solar generation is also becoming a larger part of electricity supply. U.S. utility-scale solar produced 296,000 GWh in 2025, increasing 34%, while small-scale systems generated 93,000 GWh, up 11%. Developers planning projects in 2026 should therefore evaluate transmission availability, storage economics and curtailment before finalizing land purchases or equipment orders.
Important Factor | Numeric Data | Market Importance |
|---|---|---|
Global Solar Capacity Additions | More than 600 GW | Shows record annual photovoltaic deployment |
Annual Addition Growth | About 12% | Reflects continued acceleration in installations |
Cumulative Solar PV Capacity | About 2,800 GW | Confirms solar’s position as the largest installed power technology |
Renewable Addition Contribution | 510.3 GW | Demonstrates solar’s dominant role in renewable expansion |
Utility-Scale Solar Generation | 296,000 GWh | Indicates rapidly increasing electricity output |
Planned Utility-Scale Additions | 43.4 GW | Highlights the strong near-term development pipeline |
Go-To-Market and Sales Economics
Solar energy suppliers should segment customers across utilities, factories, data centers, commercial buildings, farms, and households. Offers should combine modules, inverters, storage, installation, financing, and maintenance. Global solar photovoltaic additions exceeded 600 GW in 2025, lifting cumulative capacity to about 2,800 GW and confirming the scale available for equipment and service providers.
Utility-scale sales require direct engagement with electricity buyers, regulators, landowners, lenders, and grid operators. Rooftop and commercial systems depend more on installer networks, digital lead generation, standardized designs, and fast credit approval. Thirty countries installed more than 1 GW of solar photovoltaic capacity during 2025, nearly twice the number recorded in 2020.
Pricing should be presented through delivered electricity cost, system output, degradation, connection expense, storage needs, and financing terms. Around 80% of global solar and wind generation now operates at lower levelized costs than coal or gas. This advantage can support long-term power contracts, although location-specific grid and financing costs remain decisive.
Risk Factors & Market Barriers
Grid congestion is the most immediate barrier because completed solar assets cannot earn full revenue without timely interconnection. Developers must assess queue position, substation capacity, upgrade responsibility, and expected curtailment before major spending. The U.S. Department of Energy’s July 2026 draft transmission study identified a pressing requirement for additional national transmission infrastructure.
Supply-chain concentration exposes projects to tariffs, shipping disruption, currency movements, and policy changes. Modules may be widely available, but transformers, inverters, cables, storage systems, and skilled installers can still delay schedules. Developers should maintain approved alternative suppliers, standardized equipment specifications, and realistic delivery buffers before signing fixed completion commitments with customers.
Revenue can weaken when high midday solar output exceeds demand or network capacity. Storage, flexible loads, regional interconnection, and improved forecasting are increasingly important. The IEA expects solar and wind’s combined share of global electricity generation to increase from about 17% to 27% by 2030, raising the requirement for system flexibility.
Revenue Potential Analysis
Revenue Landscape Across
Asia provides the largest revenue pool through utility projects, rooftop systems, industrial power contracts, manufacturing, and battery integration. Solar generation increased by a record 636 TWh in 2025, representing 30% annual growth. Suppliers can capture value through modules, inverters, engineering, grid equipment, performance monitoring, and long-term operations contracts across expanding electricity systems.
Europe offers revenue through utility solar, commercial rooftops, agrivoltaics, storage, and corporate power purchase agreements. More than 400 GW of net renewable capacity is expected to be added across the European Union during 2026–2030, with solar photovoltaic systems contributing 70%. Permitted sites and secured grid connections will command stronger commercial value.
North America provides opportunities in utility projects, distributed generation, community solar, storage, and grid modernization. In March 2026, the U.S. Department of Energy announced approximately USD 1.9 billion for accelerated transmission and related infrastructure upgrades. Projects positioned near upgraded substations and corridors may achieve faster connections and improved power-delivery economics.
Financial Impact
Solar projects can create predictable cash flows when land, permits, grid access, financing, and long-term buyers are secured before construction. Solar supplied 75% of global electricity-demand growth during 2025. However, financial models should still test lower irradiation, equipment underperformance, delayed interconnection, higher interest rates, curtailment, and weaker merchant electricity prices.
Scale and technology improvements can strengthen project returns through lower equipment costs and higher energy output. Global solar photovoltaic generation reached nearly 2,700 TWh in 2025 after a record increase of about 600 TWh. Stronger production expands revenue potential, but profitability still depends on operating availability, degradation, insurance, maintenance, and financing discipline.
Storage and grid investment can increase the value of solar electricity by shifting output into higher-demand periods and reducing curtailment. Battery prices have fallen by 75% over the past decade, according to the IEA. Hybrid solar-storage projects can therefore improve dispatchability and customer savings, although added capital expenditure must be matched by contracted revenue
Drivers Impact Analysis
The Solar Energy Market is driven by rising electricity demand, falling solar module costs, government clean energy targets, corporate renewable power procurement, rooftop solar adoption, and utility-scale solar expansion. Solar power is becoming one of the most preferred renewable energy sources because it is scalable, modular, and increasingly cost-competitive.
Asia Pacific leads the market due to strong solar manufacturing capacity, large-scale solar park development, rising power consumption, and government-backed clean energy programs. China, India, Japan, South Korea, Australia, and Southeast Asia remain key contributors to regional solar deployment.
Impact Factor | Estimated CAGR Impact | Regional Relevance | Market Impact |
|---|---|---|---|
Falling solar module prices | +5.3% | Asia Pacific, Europe, North America | Improves project economics. |
Utility-scale solar expansion | +4.8% | China, India, Australia, U.S. | Drives large capacity additions. |
Government solar targets and incentives | +4.2% | Asia Pacific and Europe | Supports policy-led demand. |
Corporate renewable power procurement | +3.5% | Data centers, manufacturing, commercial users | Expands private-sector solar demand. |
Rising rooftop solar adoption | +3.0% | Urban and residential markets | Builds distributed solar capacity. |
Restraints Impact Analysis
The market faces restraints from grid congestion, land availability, transmission delays, storage gaps, and intermittency. Solar projects need strong grid connection, clear permitting, stable power purchase agreements, and backup storage to deliver reliable electricity.
Another restraint is supply-chain dependency. Solar modules, cells, wafers, inverters, glass, silver, batteries, and power electronics must remain available at competitive prices to support rapid market growth.
Impact Factor | Estimated CAGR Impact | Regional Relevance | Market Impact |
|---|---|---|---|
Grid connection bottlenecks | -2.6% | Asia Pacific, Europe, North America | Delays project commissioning. |
Solar intermittency and storage gaps | -2.2% | Solar-heavy power systems | Raises balancing requirements. |
Land and permitting delays | -1.9% | Utility-scale projects | Slows development timelines. |
Module and inverter supply pressure | -1.6% | Global solar supply chains | Affects project delivery. |
Financing cost pressure | -1.3% | Emerging and large-scale markets | Raises project cost. |
Opportunities Impact Analysis
Opportunities are strong in utility-scale solar, rooftop solar, floating solar, solar-plus-storage, hybrid renewable projects, solar parks, commercial solar systems, and off-grid solar solutions. These areas benefit from rising clean electricity demand and wider electrification.
Higher-value opportunities are emerging in high-efficiency PV modules, bifacial panels, TOPCon cells, HJT technology, perovskite tandem cells, solar inverters, battery storage, and digital energy management. Companies that combine generation, storage, and smart control can capture stronger long-term value.
Impact Factor | Estimated CAGR Impact | Regional Relevance | Market Impact |
|---|---|---|---|
Solar-plus-storage projects | +5.0% | Asia Pacific, U.S., Europe | Improves dispatchable solar power. |
Floating solar development | +4.2% | Asia Pacific and water-rich regions | Reduces land-use pressure. |
Commercial and industrial solar | +3.8% | Manufacturing and data centers | Supports contracted clean power demand. |
High-efficiency module adoption | +3.4% | Global solar developers | Improves power output per area. |
Off-grid and rural solar systems | +2.8% | Emerging markets | Expands electricity access. |
Challenges Impact Analysis
The main challenge is integrating fast-growing solar capacity into existing grids. High daytime generation can create curtailment, voltage management issues, and demand-supply mismatch if storage and transmission do not expand at the same pace.
Another challenge is maintaining project profitability. Developers must manage module price changes, inverter availability, interest rates, land costs, permitting, construction delays, and long-term power price uncertainty.
Impact Factor | Estimated CAGR Impact | Regional Relevance | Market Impact |
|---|---|---|---|
Solar curtailment risk | -2.4% | High-solar regions | Reduces project revenue efficiency. |
Transmission infrastructure gaps | -2.0% | Remote solar zones | Limits power evacuation. |
Battery storage cost pressure | -1.7% | Solar-plus-storage projects | Affects dispatchable power economics. |
Skilled installation labor shortage | -1.4% | Rooftop and utility-scale markets | Slows deployment speed. |
End-of-life panel recycling challenge | -1.1% | Mature solar markets | Adds sustainability pressure. |
Segment Covered in the Report
By Technology
Solar Photovoltaic
Concentrated Solar Power
Solar Thermal
By Module Type
Monocrystalline
Polycrystalline
Thin Film, Others
By Grid Connectivity
On-Grid
Off-Grid
Hybrid
By Application
Residential
Commercial
Industrial
Utility-Scale
By End Use
Electricity Generation
Heating and Cooling
Water Heating
Agricultural Applications
Others
By Region
North America
Europe
Asia Pacific
Latin America
Middle East and Africa
Market Trend Analysis
The market trend is moving toward utility-scale solar dominance, rooftop solar growth, solar-plus-storage systems, floating solar, bifacial modules, smart inverters, and corporate solar power purchase agreements. Solar energy is shifting from policy-supported growth to mainstream power generation.
Asia Pacific remains the largest value region because of solar manufacturing scale, strong power demand, large project pipelines, and strong government support. Europe supports growth through rooftop solar and energy security policies, while North America expands through utility-scale projects and storage-backed solar.
Impact Factor | Estimated CAGR Impact | Regional Relevance | Market Impact |
|---|---|---|---|
Utility-scale solar deployment accelerates | +5.1% | Asia Pacific, U.S., Middle East | Leads new capacity growth. |
Rooftop solar adoption increases | +4.3% | Residential and commercial users | Builds distributed generation. |
Solar-plus-storage becomes mainstream | +3.9% | Grid-constrained markets | Improves reliability and flexibility. |
Bifacial and high-efficiency modules grow | +3.2% | Large solar developers | Improves energy yield. |
Corporate solar PPAs expand | +2.7% | Data centers and industrial users | Supports contracted revenue. |
Investor Type Impact Matrix
Investors should focus on companies with strong solar project pipelines, grid connection access, module supply security, storage integration, power offtake agreements, and financing strength. Cost control, permitting success, power yield, and long-term contracted revenue are key success factors.
Strategic investors can also target solar developers, module manufacturers, inverter suppliers, battery storage firms, rooftop solar platforms, solar tracker companies, and green hydrogen-linked solar producers. Companies that combine generation scale with storage and contracted demand are better positioned for long-term growth.
Investor Type | Estimated CAGR Impact | Regional Relevance | Market Impact |
|---|---|---|---|
Solar Project Developers | +4.8% | Asia Pacific, North America, Middle East | Expands core solar capacity. |
Solar Module Manufacturers | +4.1% | China, India, Southeast Asia | Supports equipment supply growth. |
Battery Storage Companies | +3.5% | Renewable-heavy grids | Improves grid flexibility and revenue. |
Inverter and Tracker Suppliers | +2.9% | Utility-scale and rooftop solar | Improves project performance. |
Strategic Energy Investors | +2.4% | Global clean energy markets | Funds solar scale-up and expansion. |
Recent Developments
March 2026: JinkoSolar signed a 2 GW Tiger Neo 3.0 module supply agreement in Australia, expanding distributed-generation coverage after delivering more than 1 GW of modules locally during the preceding three years.
May 2025: Trina Solar supplied 52,000 Vertex N modules for the 40 MW Limbauan project in the Philippines, expected to generate 59 GWh annually and power approximately 33,000 households through advanced n-type technology.
June 2025: LONGi and Pertamina New & Renewable Energy launched a 1.6 GW module manufacturing facility in West Java, using HPBC 2.0 technology to expand Indonesia’s domestic high-efficiency solar supply chain.
Competitive Landscape
The market is characterized by intense competition among established players and emerging companies. Strategic partnerships, mergers and acquisitions, and product innovation are key strategies employed by market participants.
Key Market Players
LONGi Green Energy Technology Co., Ltd.
JinkoSolar Holding Co., Ltd.
Trina Solar Co., Ltd.
JA Solar Technology Co., Ltd.
Canadian Solar Inc.
First Solar, Inc.
Hanwha Solutions Corporation
Adani Green Energy Limited
NextEra Energy, Inc.
Enel Green Power S.p.A.
TotalEnergies SE
ENGIE SA
ACWA Power Company
Sungrow Power Supply Co., Ltd
Tata Power Solar Systems Limited
Other Key Players
Research Methodology
This market study is prepared using a combination of primary and secondary research. Primary research includes discussions with manufacturers, suppliers, distributors, consultants, industry experts, and end users. Secondary research covers company reports, government databases, trade associations, technical publications, regulatory sources, and trusted industry documents. The collected information is used to assess market demand, pricing trends, technology adoption, competitive activity, and regional performance.
AI language models are not used as primary data sources, and publicly available AI-generated content is not treated as market evidence. Computational tools may be used to support data processing, translation, data classification, and pattern identification. However, every published assessment is supported by verified sources, human review, and primary market discussions.
Market estimates are developed through top-down and bottom-up approaches and validated using data triangulation. Revenue, production, shipment, pricing, and application-level data are compared across multiple sources. Forecasts consider economic conditions, regulatory changes, investment activity, innovation, supply chain developments, and industry risks. All findings are reviewed through source verification and internal quality checks before publication.
Part I
Source Management & Input Data Standards
Who provides data, how sources are qualified, and what types of evidence are admissible.
Part II
Research Scope & Market Coverage
How we define the markets we assess and the parameters that govern each product.
Part III
Data Collection, Verification & Submission
The mechanics of gathering, cross-checking, and hierarchically ranking evidence.
Part IV
Assessment Determination & Quality Controls
How raw data becomes a published assessment — normalisation, expert judgement, and outlier exclusion.
Part V
Publication, Corrections & Revision
Our publication schedule, corrections policy, and methodology review cycle.
Part VI
Independence, Ethics & Complaints
Conflict-of-interest policies, editorial independence, and how clients raise concerns.
Google · Preferred Sources
Don't miss the latest market research insights and industry updates on Google.
Add Globe Market Research as a preferred source in the Google app to see our reports, analysis, and market stories in your news suggestions.
Meet the Team
This report was prepared by our expert analysts with deep industry knowledge and research experience.
Kimaya brings more than five years of experience in market research, content review, and industry analysis to Globe Market Research. She plays an important role in maintaining the accuracy, clarity, consistency, and relevance of research content across a wide range of industries. Her responsibilities include reviewing market data, segment analysis, competitive landscapes, industry trends, company developments, and strategic insights. Each report is carefully assessed to ensure that the findings are supported by reliable data, presented in a structured format, and aligned with the information needs of business decision-makers. Kimaya has research experience across healthcare, information technology, consumer goods, and several cross-industry domains.
Pratiksha K. is a Senior Research Analyst with more than five years of experience in market research, industry analysis, competitive intelligence, and business strategy. She has contributed to detailed market reports, customized research studies, company profiling, market sizing, trend analysis, and strategic consulting projects for clients across different regions. Her industry expertise covers Chemical and Material, Consumer Goods, Food & Beverages and Energy & Power. She closely evaluates changing customer requirements, technology developments, regulatory conditions, supply chain structures, investment activity, and competitive strategies to provide clear and practical market insights.
Frequently Asked Questions
Related Reports
More in Energy and Power
Smart Meter Market Size to hit USD 67.3 billion by 2035
Smart Meter Market Size, Share, Trends and Growth Analysis Report By Component (Hardware, Software), By Type (Smart Electric Meter, Smart Water Meter, Smart Gas Meter), By Technology (Automatic Meter Reading, Advanced Metering Infrastructure), By End Use (Residential, Commercial, Industrial), By Regional Insights, Technology Trends, Competitive Landscape, Strategic Opportunities and Growth Forecast, 2026-2035
Renewable Energy Market to Hit USD 5.3 Trillion by 2035
Renewable Energy Market Size, Share, Analysis By Energy Source (Solar Energy, Wind Energy, Hydropower, Bioenergy, Geothermal Energy, Ocean Energy), By Deployment Model (Utility-Scale Projects, Distributed Generation Systems), By Grid Integration (On-Grid Systems, Off-Grid Systems), By Energy Storage Coupling (Standalone Generation, Hybrid Systems with Energy Storage), By End User (Utilities, Commercial and Industrial, Residential), By Regional Insights, Business plan and Project Report, Investment Opportunities, Profitability, Industry Trends, Leading Companies and Growth Forecasts by 2026-2035
Green Hydrogen Market to Hit USD 158.9 Billion by 2035
Green Hydrogen Market Size, Share, Analysis By Technology (Alkaline Electrolyzer, PEM Electrolyzer, Solid Oxide Electrolyzer Cell), By Distribution Channel (Pipeline, Cargo), By Application (Transport, Power Generation, Industrial, Building Heat, Others), By Regional Insights, Business plan and Project Report, Investment Opportunities, Profitability, Industry Trends, Leading Companies and Growth Forecasts by 2026-2035
Oil and Gas Turbomachinery Market to Hit USD 26.9 Billion by 2035
Oil and Gas Turbomachinery Market Size, Share, Analysis By Type (Gas Compressors, Gas and Steam Turbines, Pumps, Other Types), By Deployment (Onshore, Offshore), By Industry (Upstream, Midstream, Downstream), By Regional Insights, Business plan and Project Report, Investment Opportunities, Profitability, Industry Trends, Leading Companies and Growth Forecasts by 2025-2035