

Revenue, 2026
USD 1.9 Tn
Forecast, 2035
USD 5.3 Tn
CAGR, 2026-2035
12.1%
Report Coverage
Global
Market Size and Forecast
The Global Renewable Energy Market was worth USD 1.9 trillion in 2026 and is expected to reach USD 5.3 trillion by 2035, growing at a CAGR of 12.1% from 2026 to 2035. Asia Pacific held the largest regional share of 45.9% in 2026, valued at around USD 0.8 trillion, supported by large-scale solar, wind, hydropower, energy storage, and grid modernization investments.
The Renewable Energy Market includes solar energy, wind energy, hydropower, bioenergy, geothermal energy, green hydrogen-linked power, and energy storage-supported renewable systems. These solutions are widely used across utilities, commercial buildings, industries, households, transportation, agriculture, and public infrastructure. Renewable energy is becoming central to power generation as countries reduce fossil fuel dependence and improve energy security.
Market growth is being supported by rising electricity demand, government clean-energy targets, falling solar and wind costs, and stronger corporate demand for low-carbon power. Utilities and private developers are expanding renewable power capacity to support data centers, electric vehicles, manufacturing, and urban growth. Demand is also increasing for battery storage, smart grids, hybrid renewable projects, and distributed solar systems.
Key Parameter | Report Details |
|---|---|
Market Revenue, 2026 | USD 1.9 Trillion |
Projected Revenue, 2035 | USD 5.3 Trillion |
CAGR (2026-2035) | 12.1% |
Largest Region | Asia Pacific (45.9%, USD 0.8 Tn) |
Market Concentration | Medium |
Forecast Period | 2026-2035 |
Asia Pacific is expected to remain the leading region due to its large population, fast-growing power demand, strong manufacturing base, and major renewable energy deployment in China, India, Japan, Australia, South Korea, and Southeast Asia. Regional growth is supported by solar parks, offshore wind projects, hydropower expansion, and grid investment. Long-term market growth will depend on transmission capacity, storage costs, policy stability, project financing, land availability, and reliable renewable power integration.
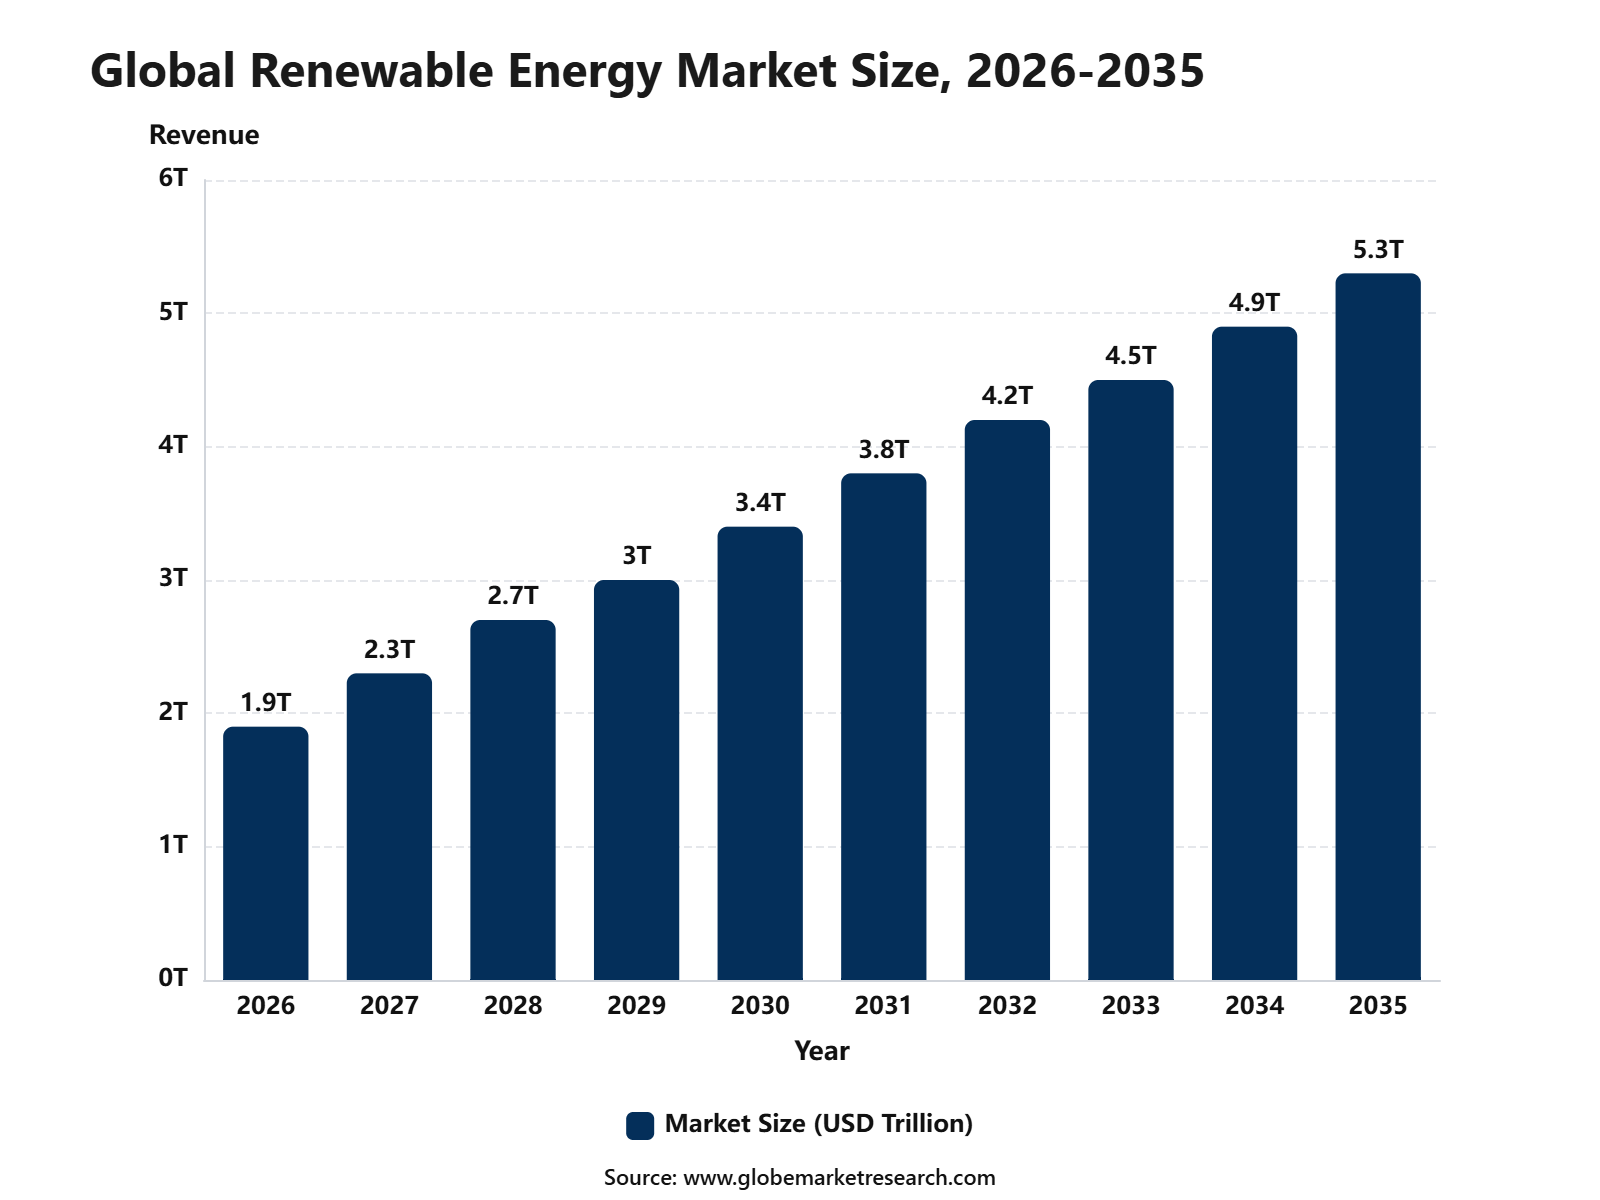 iThe graph shows projected market growth until 2035 based on CAGR analysis. Actual outcomes may vary depending on changing demand, competition, and economic factors.To gain greater insights - request a sample report PDF
Key Market Insights
Solar energy led the energy source segment with 39.9% share, supported by falling solar installation costs, strong policy support, wide rooftop adoption, and rising utility-scale solar capacity.
Utility-scale projects accounted for 66.2% share by deployment model, driven by large renewable power plants, grid-connected generation, corporate clean energy demand, and long-term power purchase agreements.
On-grid systems held 80.9% share by grid integration, supported by strong grid connectivity, easier power distribution, renewable energy procurement, and integration with national electricity networks.
Standalone generation captured 71.1% share by energy storage coupling, driven by renewable projects operating without direct storage pairing, lower project complexity, and faster deployment timelines.
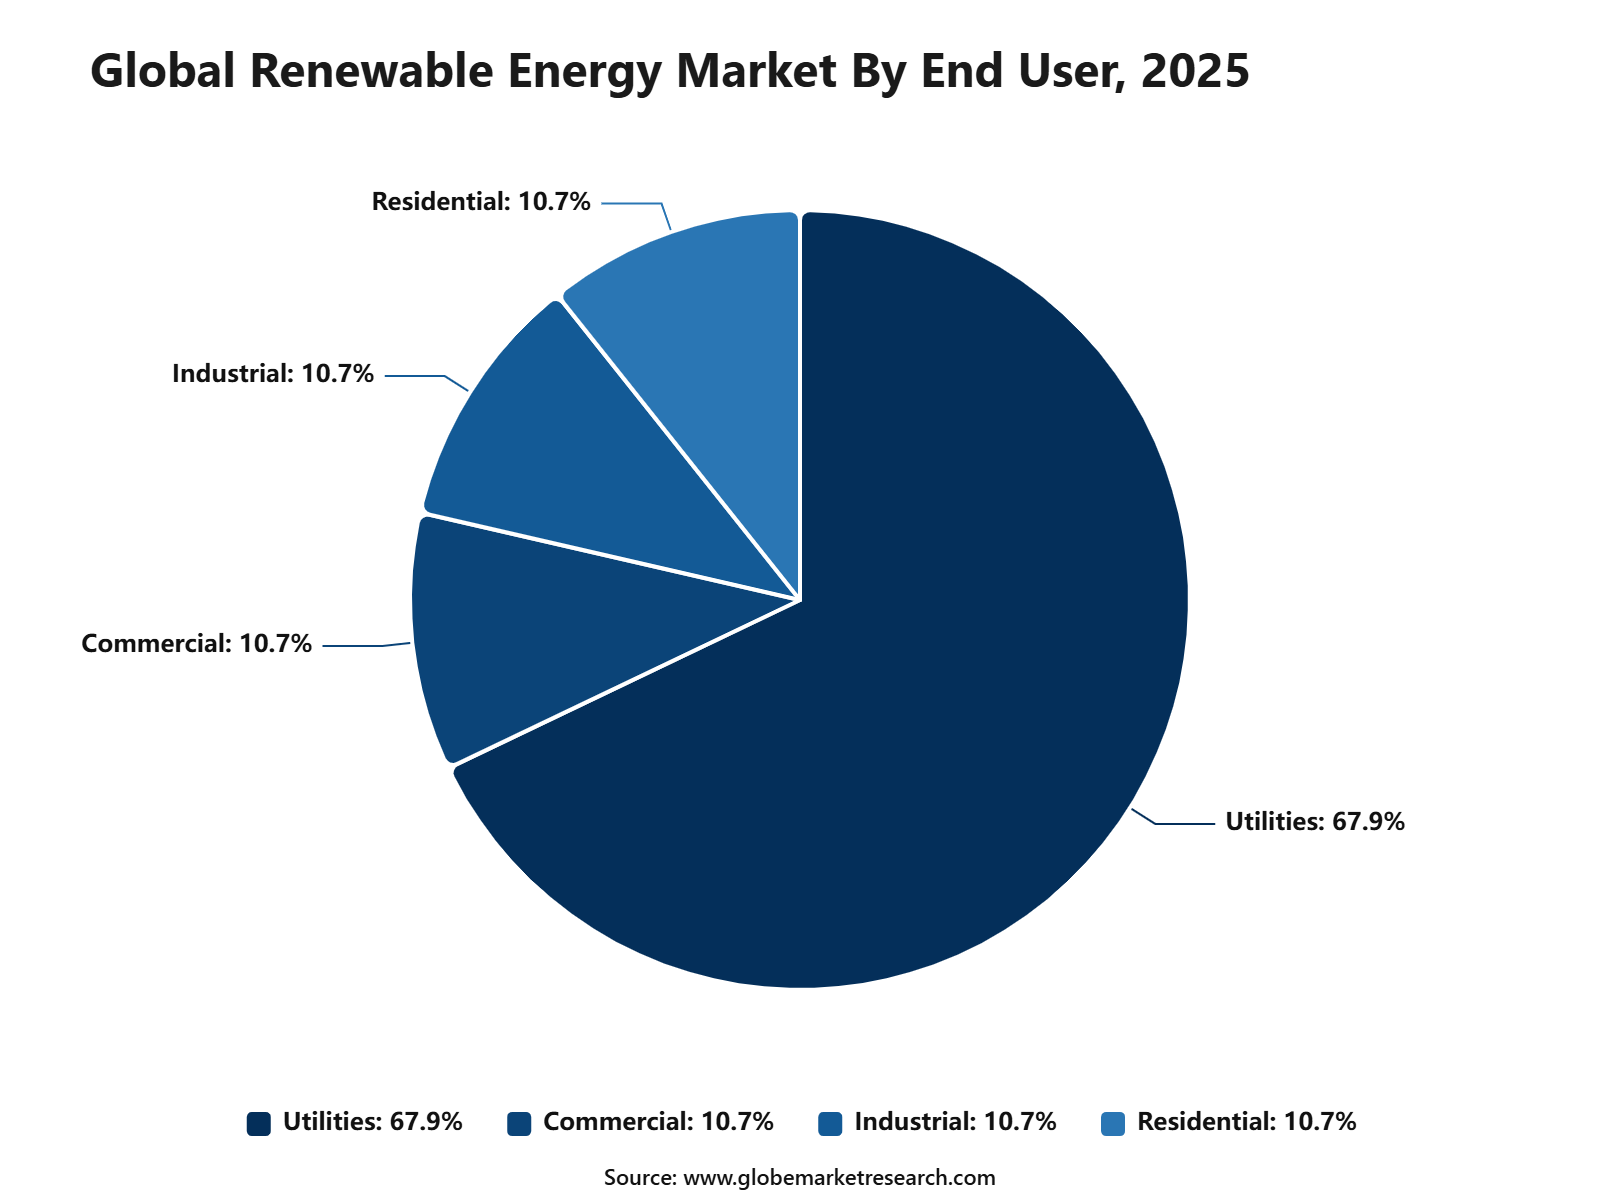
Utilities led the end-user segment with 67.9% share, supported by large-scale clean power procurement, renewable portfolio targets, grid decarbonization, and rising investment in solar, wind, and hybrid power assets.
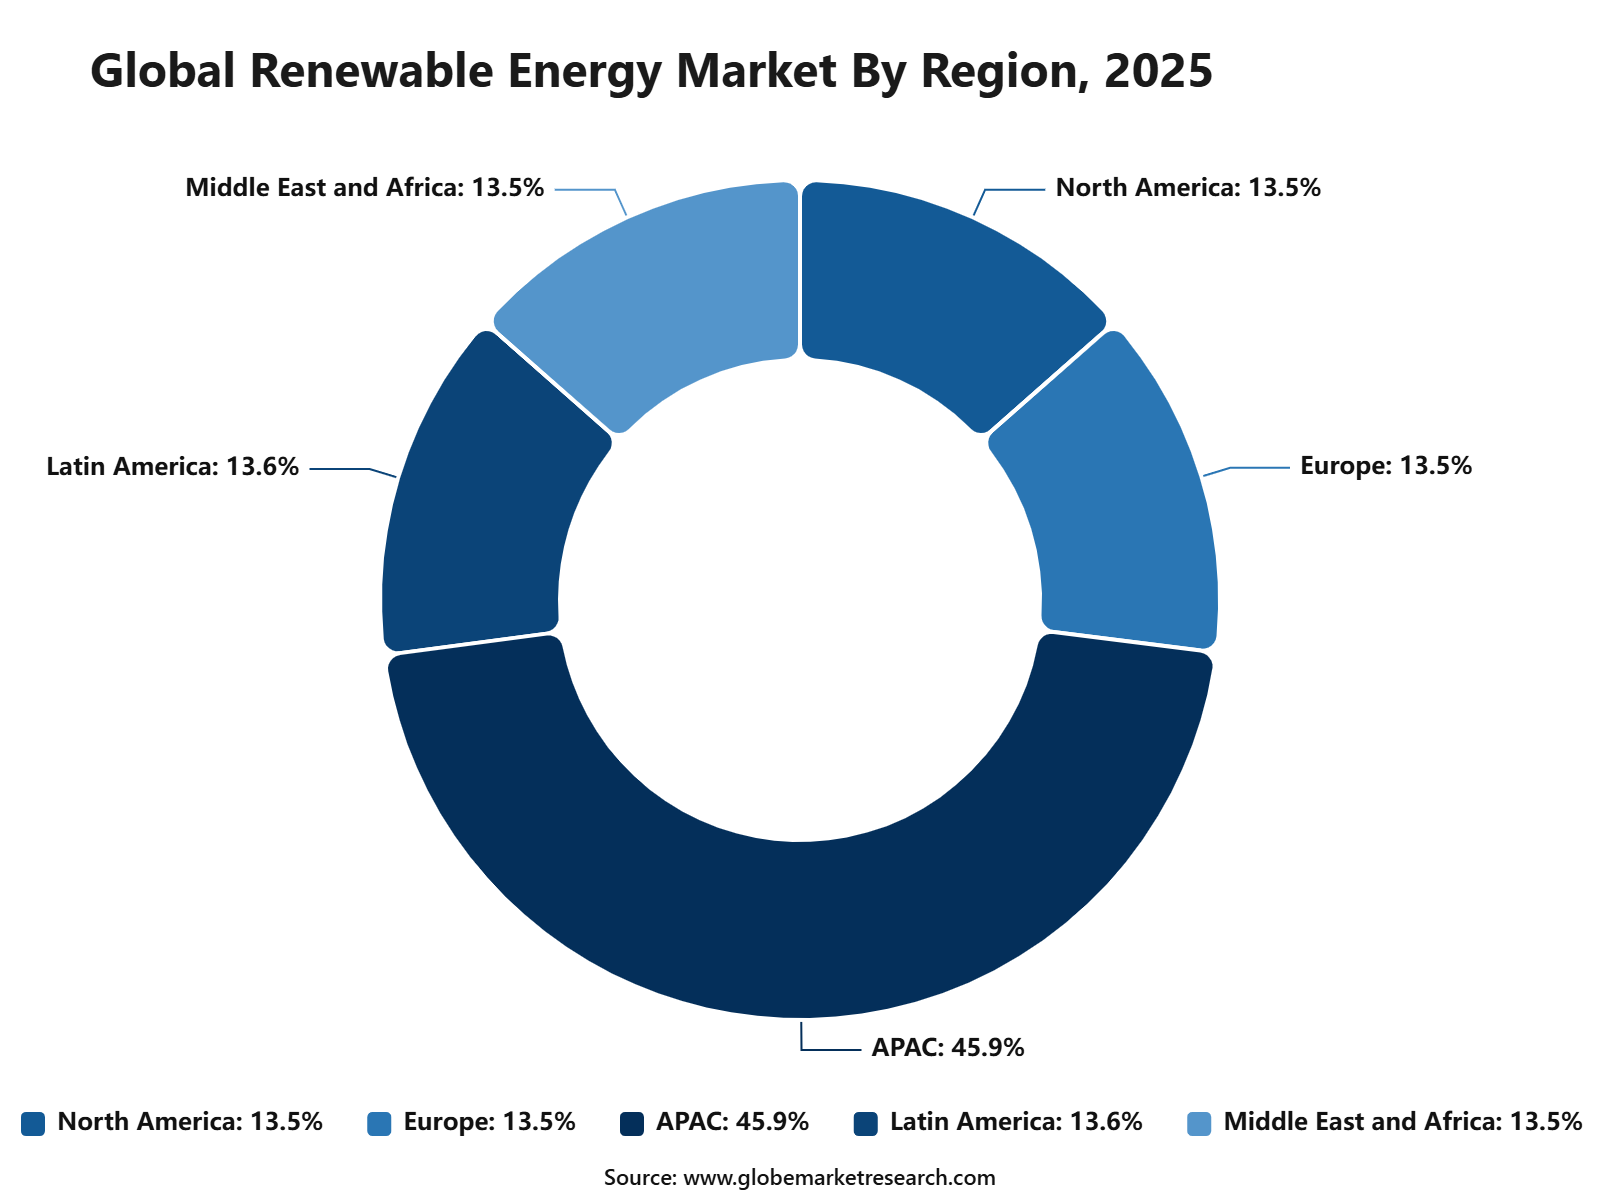
Asia Pacific led the renewable energy market with 45.9% share, valued at USD 0.8 trillion, supported by strong electricity demand, large solar and wind installations, government clean energy targets, and major renewable investments across China, India, Japan, and Southeast Asia.
Top Funding and Investment
Top Investments
ACWA Power Consortium, USD 8.3 Billion, July 2025: ACWA Power, Aramco Power and Badeel committed USD 8.3 billion to develop five solar and two wind projects across Saudi Arabia. The projects will provide 15 GW of renewable capacity and are expected to become operational by 2028.
RWE, GBP 6.0 Billion, March 2025: RWE progressed its GBP 6.0 billion Sofia offshore wind farm in the United Kingdom. The 1.4 GW project is being constructed on Dogger Bank and is designed to generate sufficient renewable electricity for more than one million UK homes annually.
Masdar and Iberdrola, EUR 5.2 Billion, July 2025: Masdar and Iberdrola agreed to jointly invest EUR 5.2 billion in the 1.4 GW East Anglia THREE offshore wind farm. Each company will hold a 50% interest. The UK project is expected to supply renewable electricity to approximately 1.3 million homes.
Equinor, USD 5.0 Billion, January 2025: Equinor confirmed approximately USD 5.0 billion in total capital investment for the 810 MW Empire Wind 1 offshore wind project in New York. The project secured more than USD 3.0 billion in financing and is expected to supply around 500,000 homes from 2027.
KKR and SK Inc., USD 1.3 Billion, June 2026: KKR and SK Inc. agreed to establish South Korea’s largest renewable energy platform, valued at approximately USD 1.3 billion. The platform will consolidate solar, onshore wind, offshore wind and fuel-cell assets, starting with 1.7 GW of operating capacity and targeting 10 GW.
Top Funding Rounds
Base Power, USD 1.0 Billion, October 2025: Base Power raised USD 1.0 billion in Series C financing led by Addition. The capital will support national expansion, increased deployment of distributed residential battery systems and the development of domestic energy-storage manufacturing capacity in the United States.
Fervo Energy, USD 462 Million, December 2025: Fervo Energy secured USD 462 million through an oversubscribed Series E round led by B Capital. The funding is being used to advance the 500 MW Cape Station enhanced geothermal project and accelerate the commercial deployment of continuous carbon-free geothermal electricity.
Quaise Energy, USD 134 Million, July 2026: Quaise Energy raised USD 134 million in the initial close of its Series B round, led by Prelude Ventures with participation from JERA and Idemitsu Kosan. The funding will support Project Obsidian, a commercial superhot geothermal plant, and millimetre-wave drilling technology development.
Top Acquisitions
Brookfield Acquisition of National Grid Renewables, USD 1.74 Billion, February 2025: Brookfield Asset Management and its partners agreed to acquire National Grid’s US onshore renewable energy business. The transaction includes approximately 3.1 GW of operating and under-construction solar, onshore wind and battery-storage assets, alongside a substantial development pipeline.
TotalEnergies Acquisition of VSB Group, EUR 1.57 Billion, April 2025: TotalEnergies completed the acquisition of VSB Group, a European wind and solar developer. The acquisition added approximately 500 MW of operating or under-construction renewable capacity and more than 15 GW of wind, solar and battery-storage projects under development.
By Energy Source
Solar energy accounted for 39.9% share of the Renewable Energy Market. This leading position is supported by falling solar module costs, faster installation timelines, strong policy support, and wide suitability across utility, commercial, industrial, and residential power generation.
The segment is widely preferred because solar projects can be deployed at different scales, from rooftop systems to large solar parks. Solar energy also benefits from abundant resource availability, low operating costs, and strong compatibility with on-grid systems and battery storage.
Demand is expected to remain strong as utilities and governments continue to expand clean power capacity. Growth will be supported by utility-scale solar projects, grid-connected systems, corporate renewable power procurement, and rising electrification across transport, industry, and buildings.
By Deployment Model
Utility-scale projects accounted for 66.2% share of the Renewable Energy Market. This dominance is driven by large renewable power plants developed to supply electricity directly to national grids, regional networks, and major power buyers.
The segment is widely preferred because utility-scale projects offer better economies of scale, lower unit power costs, and stronger integration with grid infrastructure. Solar farms, wind parks, hydropower facilities, and hybrid renewable plants are commonly developed under this model.
Demand is expected to remain strong as countries increase renewable power targets and utilities replace fossil-based generation with cleaner sources. Growth will be supported by large solar and wind projects, power purchase agreements, grid expansion, and long-term clean energy investment.
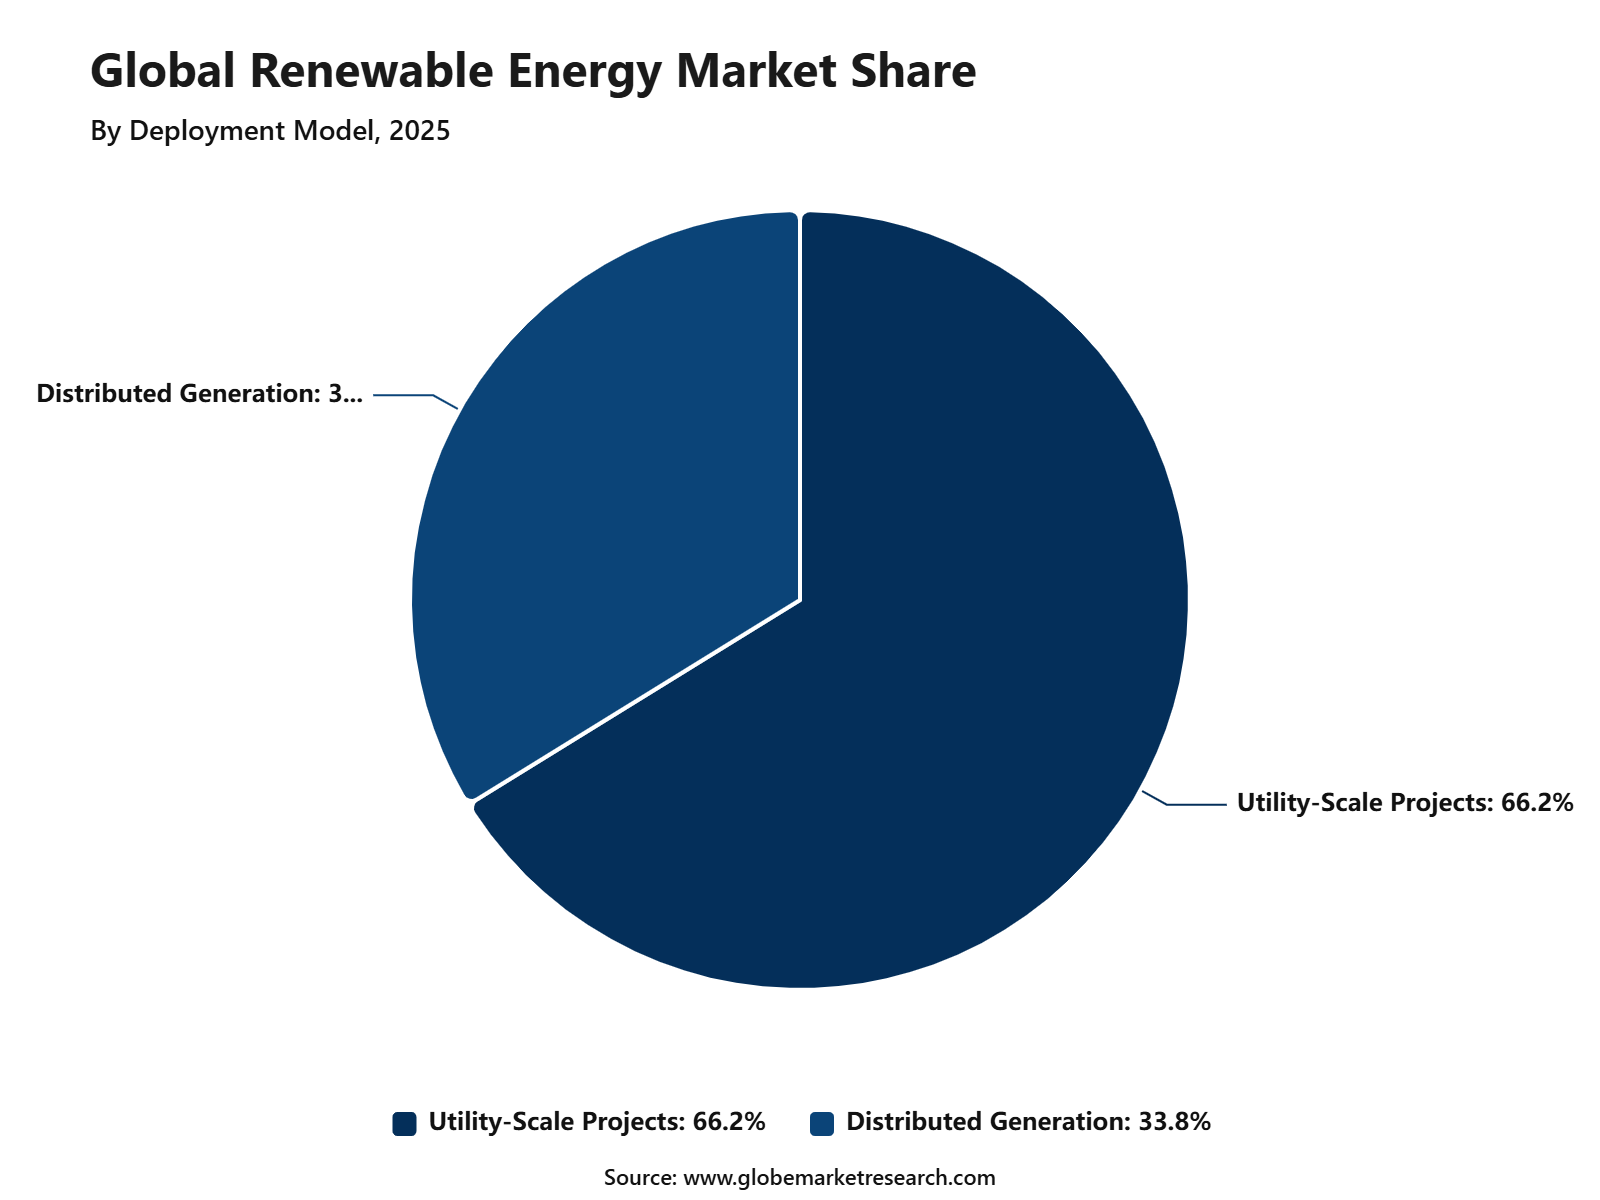 iThe graph shows projected market growth until 2035 based on CAGR analysis. Actual outcomes may vary depending on changing demand, competition, and economic factors.To gain greater insights - request a sample report PDF
By Grid Integration
On-grid systems accounted for 80.9% share of the Renewable Energy Market. This leading share is supported by the high use of renewable energy systems connected directly to public electricity grids for centralized and distributed power supply.
The segment is widely preferred because on-grid systems allow renewable electricity to be supplied, balanced, and distributed through existing power networks. They support utility-scale projects, commercial solar plants, wind farms, and grid-connected rooftop installations.
Demand is expected to remain strong as grid-connected renewable capacity continues to expand. Growth will be supported by transmission upgrades, smart grids, renewable energy certificates, net metering programs, and the rising need to integrate clean power into national energy systems.
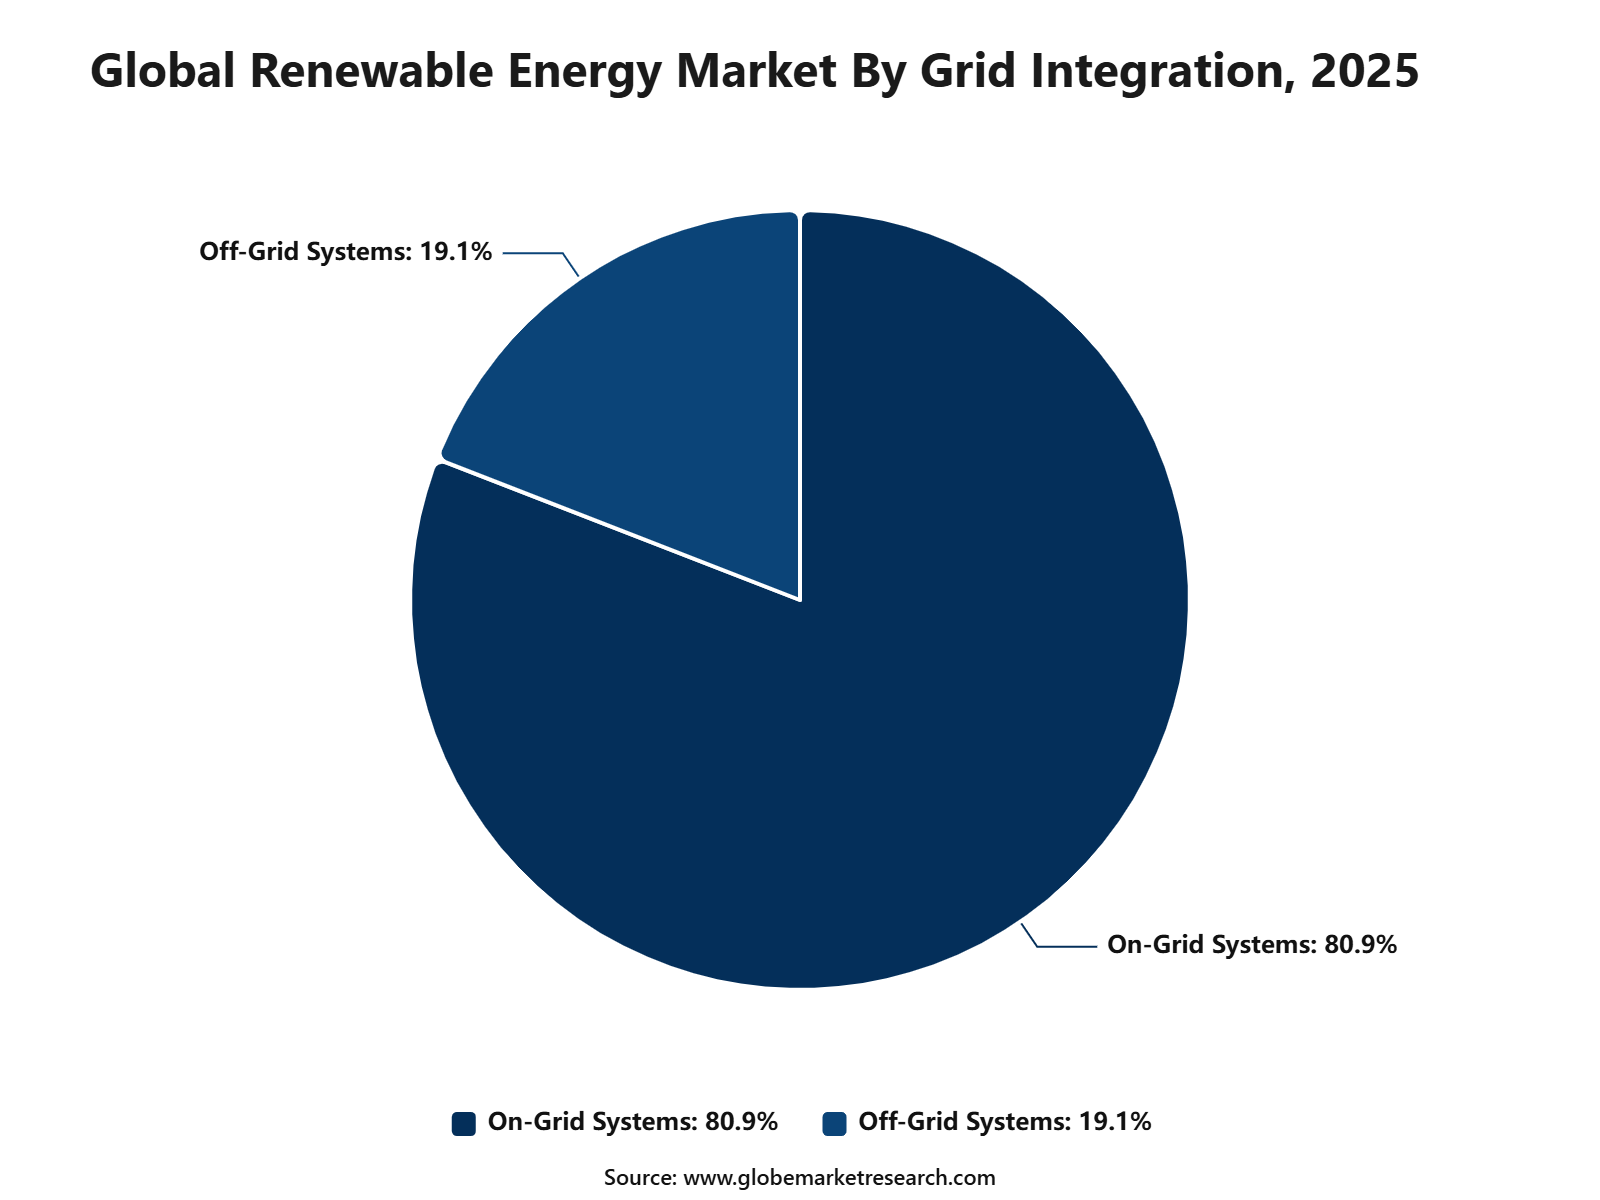 iThe graph shows projected market growth until 2035 based on CAGR analysis. Actual outcomes may vary depending on changing demand, competition, and economic factors.To gain greater insights - request a sample report PDF
By Energy Storage Coupling
Standalone generation accounted for 71.1% share of the Renewable Energy Market by energy storage coupling. This leading position is supported by the large number of renewable power projects that operate without dedicated battery storage or hybrid storage systems.
The segment is widely used because many utility-scale renewable projects are designed to feed power directly into the grid. Standalone solar, wind, hydro, and biomass plants remain common where grid access, power demand, and generation economics are favorable.
Demand is expected to remain strong as standalone renewable projects continue to offer cost-efficient clean power generation. However, storage-coupled systems are expected to gain importance as grids require better flexibility, peak management, and renewable power balancing.
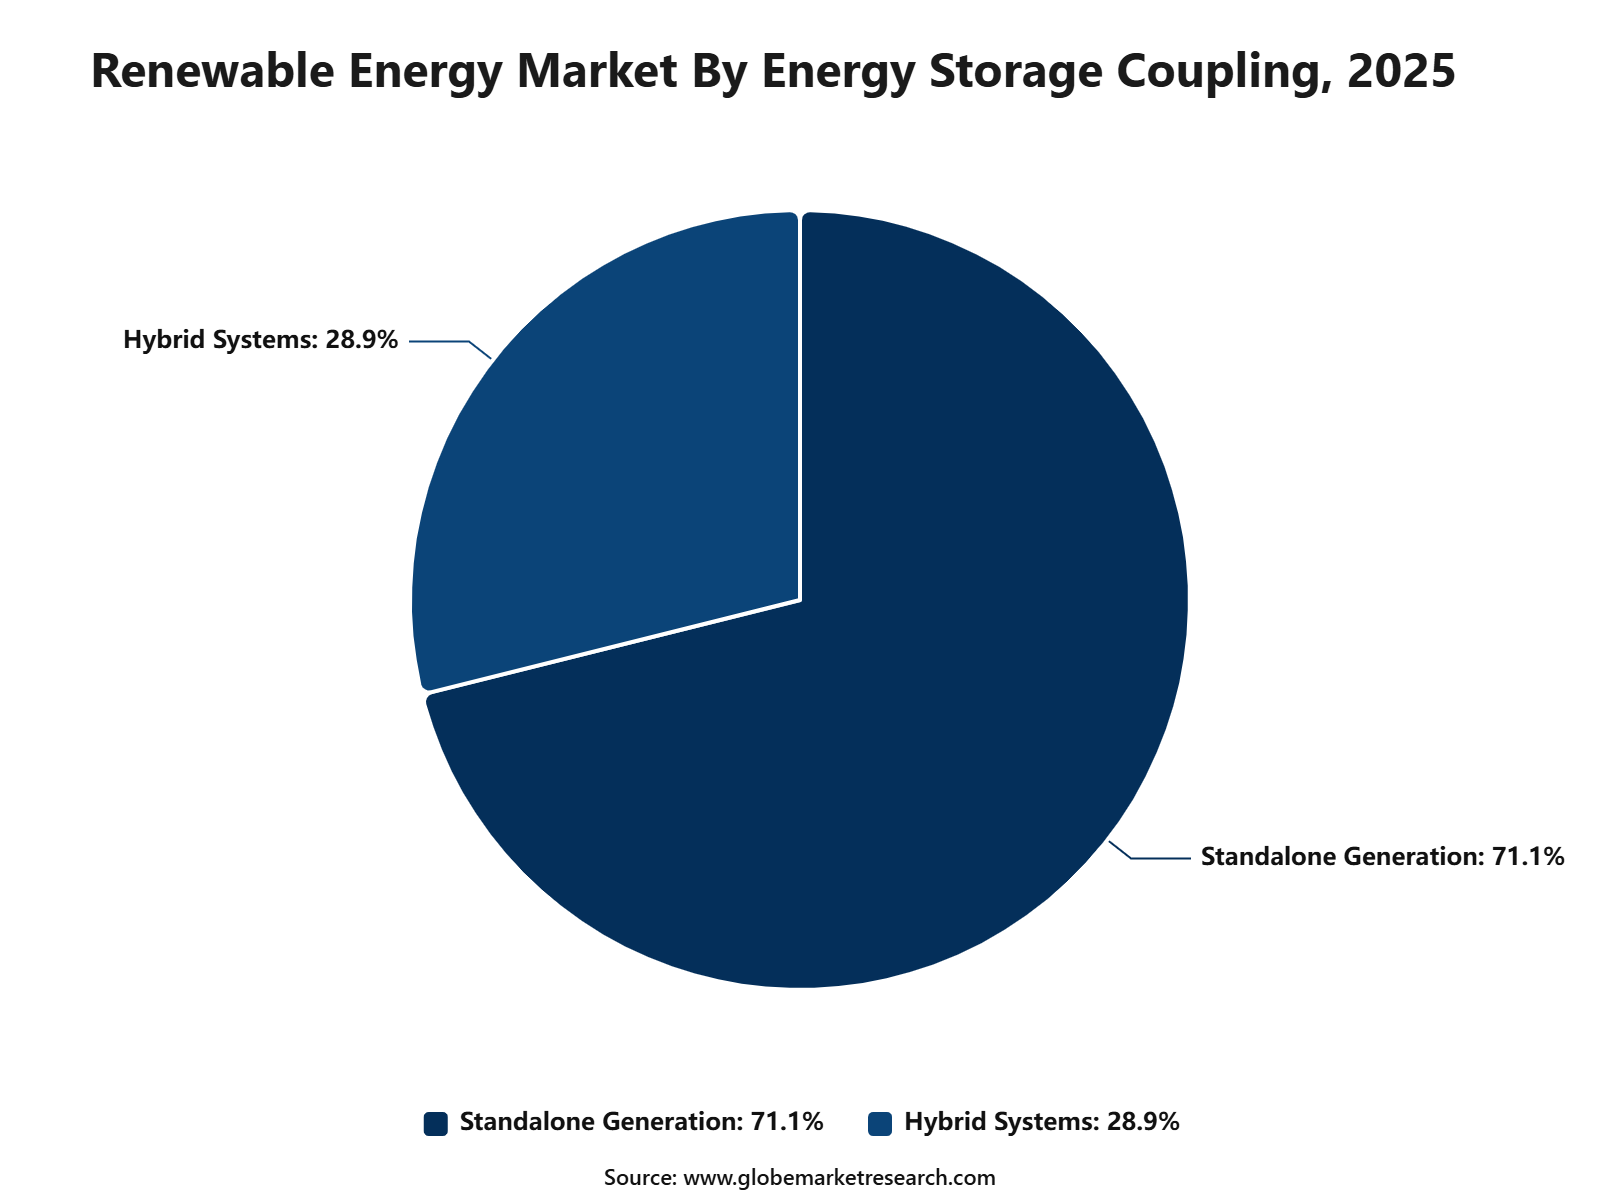 iThe graph shows projected market growth until 2035 based on CAGR analysis. Actual outcomes may vary depending on changing demand, competition, and economic factors.To gain greater insights - request a sample report PDF
By End User
Utilities accounted for 67.9% share of the Renewable Energy Market. This leading position is supported by large-scale renewable power procurement, grid decarbonization programs, and the growing role of utilities in developing solar, wind, hydro, and hybrid energy assets.
The segment is widely driven by power companies that need to meet rising electricity demand while reducing carbon emissions. Utilities invest in renewable generation to improve supply security, diversify energy portfolios, and comply with clean energy mandates.
Demand from utilities is expected to remain strong as renewable energy becomes a core part of power generation planning. Growth will be supported by utility-scale solar, wind power projects, on-grid systems, long-term power contracts, and investment in grid modernization.
 iThe graph shows projected market growth until 2035 based on CAGR analysis. Actual outcomes may vary depending on changing demand, competition, and economic factors.To gain greater insights - request a sample report PDF
By Region
Asia Pacific accounted for 45.9% share of the Renewable Energy Market, reaching USD 0.8 trillion. The region’s leadership is supported by large electricity demand, rapid urbanization, strong solar and wind deployment, and government-backed renewable energy expansion.
China, India, Japan, South Korea, Australia, Vietnam, and other Southeast Asian countries are key contributors to regional demand. The region benefits from large utility-scale project pipelines, manufacturing strength in solar components, rising power consumption, and investment in grid-connected renewable energy systems.
Asia Pacific is expected to maintain its leading position as clean power deployment continues across major economies. Demand will remain supported by solar energy, utility-scale projects, on-grid systems, standalone renewable generation, and strong utility participation in energy transition programs.
 iThe graph shows projected market growth until 2035 based on CAGR analysis. Actual outcomes may vary depending on changing demand, competition, and economic factors.To gain greater insights - request a sample report PDF
Regional Impact Analysis
Asia Pacific leads the Renewable Energy Market with 45.9% share in 2026, valued at around USD 0.9 trillion, supported by large electricity demand, strong solar and wind capacity growth, clean energy manufacturing, and government-backed renewable power programs. China and India remain major value contributors due to large-scale solar, wind, and grid investment.
Europe remains important because of offshore wind, clean energy policies, and industrial decarbonization. North America supports growth through utility-scale solar, battery storage, corporate power purchase agreements, and grid modernization investments.
Impact Factor | Estimated CAGR Impact | Regional Relevance | Market Impact |
|---|---|---|---|
Asia Pacific market leadership | +3.9% | Asia Pacific, 45.9% share in 2026 | Leads global value demand. |
China solar and wind scale | +3.3% | China | Drives major regional capacity. |
India renewable capacity expansion | +2.8% | India | Adds high-growth project demand. |
Europe offshore wind and policy support | +2.3% | Germany, UK, Spain, France, Denmark | Supports clean power growth. |
North America storage and PPA growth | +2.0% | U.S. and Canada | Builds contracted renewable demand. |
Go-To-Market and Sales Economics
Renewable energy developers should segment customers across utilities, commercial buildings, factories, data centers, farms, and public infrastructure. Sales offers should combine generation, storage, grid connection, operation, and financing. Global renewable capacity reached 5,149 GW in 2025 after a record 692 GW annual addition, confirming strong demand for scalable project-development and equipment services.
Utility-scale projects require direct engagement with governments, electricity buyers, grid operators, and large industrial users. Long-term power purchase agreements can improve financing certainty, while distributed systems need installer and channel partnerships. Renewables represented 85.6% of global power capacity additions in 2025, showing that customer acquisition is increasingly tied to grid access and delivery capability.
Sales economics should be built around electricity output, capacity factor, connection cost, curtailment risk, storage needs, and financing terms. Global investment in electricity supply and infrastructure is expected to reach USD 1.6 trillion in 2026. Developers that secure land, permits, equipment, and bankable customers early can reduce delays and improve project-level returns.
Risk Factors & Market Barriers
Grid congestion and slow interconnection remain major barriers because renewable projects cannot generate revenue until transmission capacity is available. In July 2026, the U.S. Department of Energy identified a pressing need for additional transmission infrastructure. Developers should assess connection queues, upgrade costs, curtailment exposure, and substation availability before acquiring land or ordering major equipment.
Geographic concentration creates supply-chain and investment risk. China, the United States, and the European Union represented 79.5% of renewable capacity added in 2025, while Africa accounted for only 1.6%. This uneven deployment reflects differences in financing, policy stability, grid quality, purchasing power, and project-development capacity across regions.
Revenue uncertainty can increase when electricity prices fall during periods of high solar or wind output. Storage, flexible demand, diversified generation, and stronger transmission can reduce this exposure. Utility-scale battery deployment is accelerating, but conventional generation remains an important flexibility source, meaning renewable projects must be designed around wider power-system reliability requirements.
Revenue Potential Analysis
Revenue Landscape Across
Asia provides the largest project pipeline through solar, wind, hydropower, manufacturing, and rising electricity demand. Solar power contributed a record 510 GW of global renewable additions during 2025, while wind added 159 GW. Suppliers can capture revenue through modules, turbines, inverters, engineering, storage, grid equipment, maintenance, and digital energy-management services.
Europe offers revenue through utility projects, corporate power contracts, offshore wind, storage, and electricity-network upgrades. More than 400 GW of net renewable capacity is expected to be added across the European Union between 2026 and 2030, with solar representing 70%. Wind generation is projected to grow by approximately 10% annually over the period.
Africa and the Middle East remain smaller but rapidly developing opportunities. Africa added 11.3 GW during 2025, reaching 82 GW after annual growth of 15.9%. Middle Eastern renewable capacity increased 28.9%, led by Saudi Arabia. Competitive financing, local partnerships, transmission development, and dependable equipment servicing will determine the conversion of resource potential into revenue.
Financial Impact
Renewable projects can create predictable long-term cash flows when power purchase agreements, land rights, grid connections, and financing are secured before construction. However, financial performance depends on actual generation, curtailment, operating expenses, interest rates, and equipment availability. Record additions of 693 GW in 2025 demonstrate expanding scale, but not every project will achieve equal returns.
Grid investment can materially improve project economics by reducing congestion, connection delays, and lost electricity sales. The U.S. Department of Energy announced approximately USD 1.9 billion in March 2026 for accelerated transmission and grid upgrades. Developers located near upgraded infrastructure may benefit from faster interconnection, improved reliability, and stronger access to high-demand electricity markets.
Capital allocation is shifting toward electricity infrastructure, renewable generation, storage, and electrification. Electricity supply and infrastructure investment is expected to reach USD 1.6 trillion in 2026 and approximately USD 2 trillion when end-use electrification is included. Companies that combine generation with storage, transmission access, and contracted demand can improve asset utilization and financial resilience.
Grid Access Accelerates Renewable Deployment
Grid access is the most important factor influencing renewable energy deployment because new generation cannot deliver electricity without timely transmission connections. Renewable power capacity increased by 692 GW, or 15.5%, during 2025, while renewables represented 85.6% of worldwide power-capacity additions. This rapid expansion increases the need for transmission investment, digital grid management and faster interconnection approvals.
Global renewable additions reached 800 GW in 2025, with solar providing more than three-quarters and wind contributing approximately 20%. Renewables accounted for 49% of total installed global power capacity by the end of 2025. Companies should therefore assess grid availability before purchasing equipment or land, since connection delays can weaken project economics even when renewable resources and customer demand are strong.
Important Factor | Numeric Data | Market Importance |
|---|---|---|
Renewable Capacity Added | 692 GW | Demonstrates the rapid annual expansion of clean-power infrastructure |
Annual Capacity Growth | 15.5% | Indicates strong deployment momentum across global electricity markets |
Share of Power Additions | 85.6% | Shows that renewables dominate newly installed generating capacity |
Total Installed Capacity Share | 49.0% | Confirms that renewable sources represent nearly half of global power capacity |
Total Renewable Additions | 800 GW | Reflects record deployment when estimated and reported additions are combined |
Solar Share of Additions | More than 75% | Identifies solar photovoltaic technology as the primary expansion driver |
Drivers Impact Analysis
The Renewable Energy Market is driven by rising electricity demand, falling solar and wind costs, energy security needs, climate policies, grid modernization, and corporate clean power procurement. Renewable power is becoming a core part of national energy planning as governments and utilities reduce dependence on fossil fuels.
Asia Pacific leads the market due to large-scale solar and wind deployment, strong manufacturing capacity, rising power demand, and government-backed clean energy targets. China, India, Japan, South Korea, Australia, and Southeast Asian countries remain major contributors to renewable power expansion.
Impact Factor | Estimated CAGR Impact | Regional Relevance | Market Impact |
|---|---|---|---|
Rising electricity demand | +3.8% | Asia Pacific, North America, Europe | Drives large-scale renewable capacity additions. |
Declining solar and wind costs | +3.4% | Global clean energy markets | Improves project economics. |
Government clean energy targets | +3.0% | Asia Pacific, Europe, U.S. | Supports policy-led deployment. |
Corporate renewable power procurement | +2.5% | Data centers, manufacturing, industrial users | Expands private-sector demand. |
Energy security and fossil fuel reduction | +2.1% | Import-dependent economies | Accelerates clean power investment. |
Restraints Impact Analysis
The market faces restraints from grid congestion, land acquisition issues, project permitting delays, storage gaps, and transmission infrastructure limitations. Renewable energy projects require strong grid connection, stable policies, financing access, and long-term power purchase agreements.
Another restraint is intermittency. Solar and wind generation depends on weather conditions, so utilities need energy storage, flexible grids, demand response, and backup capacity to ensure reliable electricity supply.
Impact Factor | Estimated CAGR Impact | Regional Relevance | Market Impact |
|---|---|---|---|
Grid connection bottlenecks | -2.0% | Asia Pacific, Europe, North America | Delays project commissioning. |
Intermittency and storage limitations | -1.7% | Solar and wind-heavy markets | Increases balancing needs. |
Land and permitting delays | -1.5% | Utility-scale project markets | Slows deployment timelines. |
Transmission infrastructure gaps | -1.3% | Remote renewable zones | Limits power evacuation. |
Financing and policy uncertainty | -1.0% | Emerging markets | Raises investment risk. |
Opportunities Impact Analysis
Opportunities are strong in utility-scale solar, rooftop solar, onshore wind, offshore wind, battery energy storage, green hydrogen-linked renewables, grid modernization, and renewable power purchase agreements. These areas benefit from rising clean electricity demand and decarbonization goals.
Higher-value opportunities are emerging in hybrid renewable projects, solar-plus-storage, wind-plus-storage, floating solar, distributed generation, smart grids, and renewable energy for data centers and industrial clusters. Companies that combine generation, storage, and grid integration can capture stronger long-term value.
Impact Factor | Estimated CAGR Impact | Regional Relevance | Market Impact |
|---|---|---|---|
Utility-scale solar expansion | +3.7% | Asia Pacific, Middle East, U.S. | Builds large capacity growth. |
Battery energy storage deployment | +3.2% | Renewable-heavy grids | Improves grid reliability. |
Offshore wind development | +2.8% | China, Japan, South Korea, Europe | Adds high-capacity projects. |
Solar-plus-storage projects | +2.4% | Asia Pacific and North America | Improves dispatchable clean power. |
Corporate clean power contracts | +2.0% | Data centers and manufacturers | Expands private investment. |
Challenges Impact Analysis
The main challenge is integrating large renewable capacity into existing electricity grids. As renewable generation rises, utilities must manage variable supply, grid stability, curtailment, peak demand, and transmission upgrades.
Another challenge is supply-chain pressure. Solar modules, wind turbines, inverters, batteries, rare earth materials, grid equipment, and skilled labor must scale together to support long-term market expansion.
Impact Factor | Estimated CAGR Impact | Regional Relevance | Market Impact |
|---|---|---|---|
Renewable grid integration complexity | -1.9% | Asia Pacific and Europe | Increases system planning needs. |
Curtailment risk | -1.6% | High-renewable regions | Reduces project revenue efficiency. |
Equipment supply-chain pressure | -1.4% | Solar, wind, storage suppliers | Affects project timelines. |
Skilled labor shortage | -1.1% | Construction and maintenance markets | Slows installation activity. |
Local opposition and land conflict | -0.9% | Utility-scale projects | Creates approval delays. |
Segment Covered in the Report
By Energy Source
Solar Energy
Wind Energy
Bioenergy
Geothermal Energy
Ocean Energy
By Deployment Model
Utility-Scale Projects
Distributed Generation Systems
By Grid Integration
On-Grid Systems
Off-Grid Systems
By Energy Storage Coupling
Standalone Generation
Hybrid Systems with Energy Storage
By End User
Utilities
Commercial
Industrial
Residential
By Region
North America
Europe
Asia Pacific
Latin America
Middle East and Africa
Market Trend Analysis
The market trend is moving toward solar dominance, wind power expansion, renewable storage integration, hybrid projects, green hydrogen-linked electricity, and corporate renewable procurement. Renewable energy is shifting from policy-driven adoption to mainstream power generation economics.
Asia Pacific remains the largest value region because of strong solar manufacturing, large utility-scale projects, rising electricity demand, and government-led clean energy expansion. Europe supports growth through offshore wind and decarbonization policies, while North America grows through utility-scale solar, storage, and corporate clean power demand.
Impact Factor | Estimated CAGR Impact | Regional Relevance | Market Impact |
|---|---|---|---|
Solar power deployment accelerates | +3.6% | Asia Pacific, Middle East, U.S. | Leads new capacity additions. |
Renewable energy storage rises | +3.1% | Grid-constrained markets | Supports reliability and flexibility. |
Hybrid renewable projects expand | +2.6% | Solar and wind-rich regions | Improves project economics. |
Offshore wind gains investment | +2.2% | China, Europe, Japan, South Korea | Adds long-term capacity. |
Corporate clean energy buying increases | +1.9% | Data centers and industrial users | Supports contracted revenue. |
Investor Type Impact Matrix
Investors should focus on companies with strong project pipelines, land access, grid connection capability, storage integration, renewable power offtake agreements, and financing strength. Cost control, permitting success, generation efficiency, and power price stability are key success factors.
Strategic investors can also target solar developers, wind project owners, battery storage firms, grid infrastructure companies, inverter manufacturers, renewable power platforms, and green hydrogen-linked power producers. Companies that combine generation scale with storage and contracted demand are better positioned for long-term growth.
Investor Type | Estimated CAGR Impact | Regional Relevance | Market Impact |
|---|---|---|---|
Solar Power Developers | +3.3% | Asia Pacific, North America, Middle East | Expands core renewable capacity. |
Wind Energy Project Owners | +2.8% | China, Europe, U.S., India | Supports utility-scale generation. |
Battery Storage Companies | +2.5% | Renewable-heavy grids | Improves grid flexibility and revenue. |
Grid Infrastructure Firms | +2.0% | Transmission and distribution markets | Enables clean power integration. |
Strategic Energy Investors | +1.7% | Global clean energy markets | Funds scale-up and project expansion. |
Recent Developments
June 2026: China Three Gorges brought China’s largest single-unit pumped-storage power station into full operation, strengthening flexible generation and grid-balancing capacity required to integrate growing wind and solar electricity across the national system.
April 2026: Adani Green Energy reported adding 5,051 MW of renewable capacity during fiscal 2026, lifting its operational portfolio to 19.3 GW through new solar, wind and wind-solar hybrid projects, mainly at Khavda.
March 2026: Canadian Solar secured an agreement with a major United States utility for a 500 MW, 2,493 MWh battery storage project supporting data-centre grid infrastructure, resilience and large-scale electricity demand.
February 2026: Siemens Gamesa introduced the SG 15-236 offshore wind turbine, advancing industrialized production of its Direct Drive platform through a standardized 15 MW design developed for high-volume deployment in future offshore projects.
Competitive Landscape
The market is characterized by intense competition among established players and emerging companies. Strategic partnerships, mergers and acquisitions, and product innovation are key strategies employed by market participants.
Key Market Players
NextEra Energy, Inc.
Iberdrola, S.A.
Ørsted A/S
Enel Green Power S.p.A.
China Three Gorges Corporation
State Power Investment Corporation Limited
EDF Renewables
Brookfield Renewable Partners L.P.
TotalEnergies SE
Siemens Gamesa Renewable Energy S.A
Vestas Wind Systems A/S
First Solar, Inc.
Canadian Solar Inc.
LONGi Green Energy Technology Co., Ltd.
Adani Green Energy Limited
Other Key Players
Research Methodology
This market study is prepared using a combination of primary and secondary research. Primary research includes discussions with manufacturers, suppliers, distributors, consultants, industry experts, and end users. Secondary research covers company reports, government databases, trade associations, technical publications, regulatory sources, and trusted industry documents. The collected information is used to assess market demand, pricing trends, technology adoption, competitive activity, and regional performance.
AI language models are not used as primary data sources, and publicly available AI-generated content is not treated as market evidence. Computational tools may be used to support data processing, translation, data classification, and pattern identification. However, every published assessment is supported by verified sources, human review, and primary market discussions.
Market estimates are developed through top-down and bottom-up approaches and validated using data triangulation. Revenue, production, shipment, pricing, and application-level data are compared across multiple sources. Forecasts consider economic conditions, regulatory changes, investment activity, innovation, supply chain developments, and industry risks. All findings are reviewed through source verification and internal quality checks before publication.
Part I
Source Management & Input Data Standards
Who provides data, how sources are qualified, and what types of evidence are admissible.
Part II
Research Scope & Market Coverage
How we define the markets we assess and the parameters that govern each product.
Part III
Data Collection, Verification & Submission
The mechanics of gathering, cross-checking, and hierarchically ranking evidence.
Part IV
Assessment Determination & Quality Controls
How raw data becomes a published assessment — normalisation, expert judgement, and outlier exclusion.
Part V
Publication, Corrections & Revision
Our publication schedule, corrections policy, and methodology review cycle.
Part VI
Independence, Ethics & Complaints
Conflict-of-interest policies, editorial independence, and how clients raise concerns.
Google · Preferred Sources
Don't miss the latest market research insights and industry updates on Google.
Add Globe Market Research as a preferred source in the Google app to see our reports, analysis, and market stories in your news suggestions.
Meet the Team
This report was prepared by our expert analysts with deep industry knowledge and research experience.
Kimaya brings more than five years of experience in market research, content review, and industry analysis to Globe Market Research. She plays an important role in maintaining the accuracy, clarity, consistency, and relevance of research content across a wide range of industries. Her responsibilities include reviewing market data, segment analysis, competitive landscapes, industry trends, company developments, and strategic insights. Each report is carefully assessed to ensure that the findings are supported by reliable data, presented in a structured format, and aligned with the information needs of business decision-makers. Kimaya has research experience across healthcare, information technology, consumer goods, and several cross-industry domains.
Pratiksha K. is a Senior Research Analyst with more than five years of experience in market research, industry analysis, competitive intelligence, and business strategy. She has contributed to detailed market reports, customized research studies, company profiling, market sizing, trend analysis, and strategic consulting projects for clients across different regions. Her industry expertise covers Chemical and Material, Consumer Goods, Food & Beverages and Energy & Power. She closely evaluates changing customer requirements, technology developments, regulatory conditions, supply chain structures, investment activity, and competitive strategies to provide clear and practical market insights.
Frequently Asked Questions
Related Reports
More in Energy and Power
Smart Meter Market Size to hit USD 67.3 billion by 2035
Smart Meter Market Size, Share, Trends and Growth Analysis Report By Component (Hardware, Software), By Type (Smart Electric Meter, Smart Water Meter, Smart Gas Meter), By Technology (Automatic Meter Reading, Advanced Metering Infrastructure), By End Use (Residential, Commercial, Industrial), By Regional Insights, Technology Trends, Competitive Landscape, Strategic Opportunities and Growth Forecast, 2026-2035
Solar Energy Market to Hit USD 1,400.7 Billion by 2035
Solar Energy Market Size, Share, Analysis By Technology (Solar Photovoltaic, Concentrated Solar Power, Solar Thermal), By Module Type (Monocrystalline, Polycrystalline, Thin Film, Others), By Grid Connectivity (On-Grid, Off-Grid, Hybrid), By Application (Residential, Commercial, Industrial, Utility-Scale), By End Use (Electricity Generation, Heating and Cooling, Water Heating, Agricultural Applications, Others), By Regional Insights, Business plan and Project Report, Investment Opportunities, Profitability, Industry Trends, Leading Companies and Growth Forecasts by 2026-2035
Green Hydrogen Market to Hit USD 158.9 Billion by 2035
Green Hydrogen Market Size, Share, Analysis By Technology (Alkaline Electrolyzer, PEM Electrolyzer, Solid Oxide Electrolyzer Cell), By Distribution Channel (Pipeline, Cargo), By Application (Transport, Power Generation, Industrial, Building Heat, Others), By Regional Insights, Business plan and Project Report, Investment Opportunities, Profitability, Industry Trends, Leading Companies and Growth Forecasts by 2026-2035
Oil and Gas Turbomachinery Market to Hit USD 26.9 Billion by 2035
Oil and Gas Turbomachinery Market Size, Share, Analysis By Type (Gas Compressors, Gas and Steam Turbines, Pumps, Other Types), By Deployment (Onshore, Offshore), By Industry (Upstream, Midstream, Downstream), By Regional Insights, Business plan and Project Report, Investment Opportunities, Profitability, Industry Trends, Leading Companies and Growth Forecasts by 2025-2035