

Revenue, 2025
$110.2 Bn
Forecast, 2035
$210.8 Bn
CAGR, 2025-2035
6.7%
Report Coverage
Global
Market Size and Forecast
The Global Aromatics Market was worth USD 110.2 billion in 2025 and is expected to reach USD 210.8 billion by 2035, growing at a CAGR of 6.7% from 2025 to 2035. Asia Pacific held the largest regional share of 48.9% in 2025, supported by strong petrochemical production, rising demand from plastics and synthetic fibers, and large downstream consumption across China, India, Japan, South Korea, and Southeast Asia.
The Aromatics Market includes key hydrocarbon chemicals such as benzene, toluene, xylene, and related derivatives used in several industrial applications. These chemicals are widely used in plastics, resins, solvents, synthetic fibers, rubber, paints, coatings, adhesives, packaging materials, and automotive components. The market is closely linked with refinery operations, naphtha reforming, petrochemical complexes, and downstream chemical manufacturing.
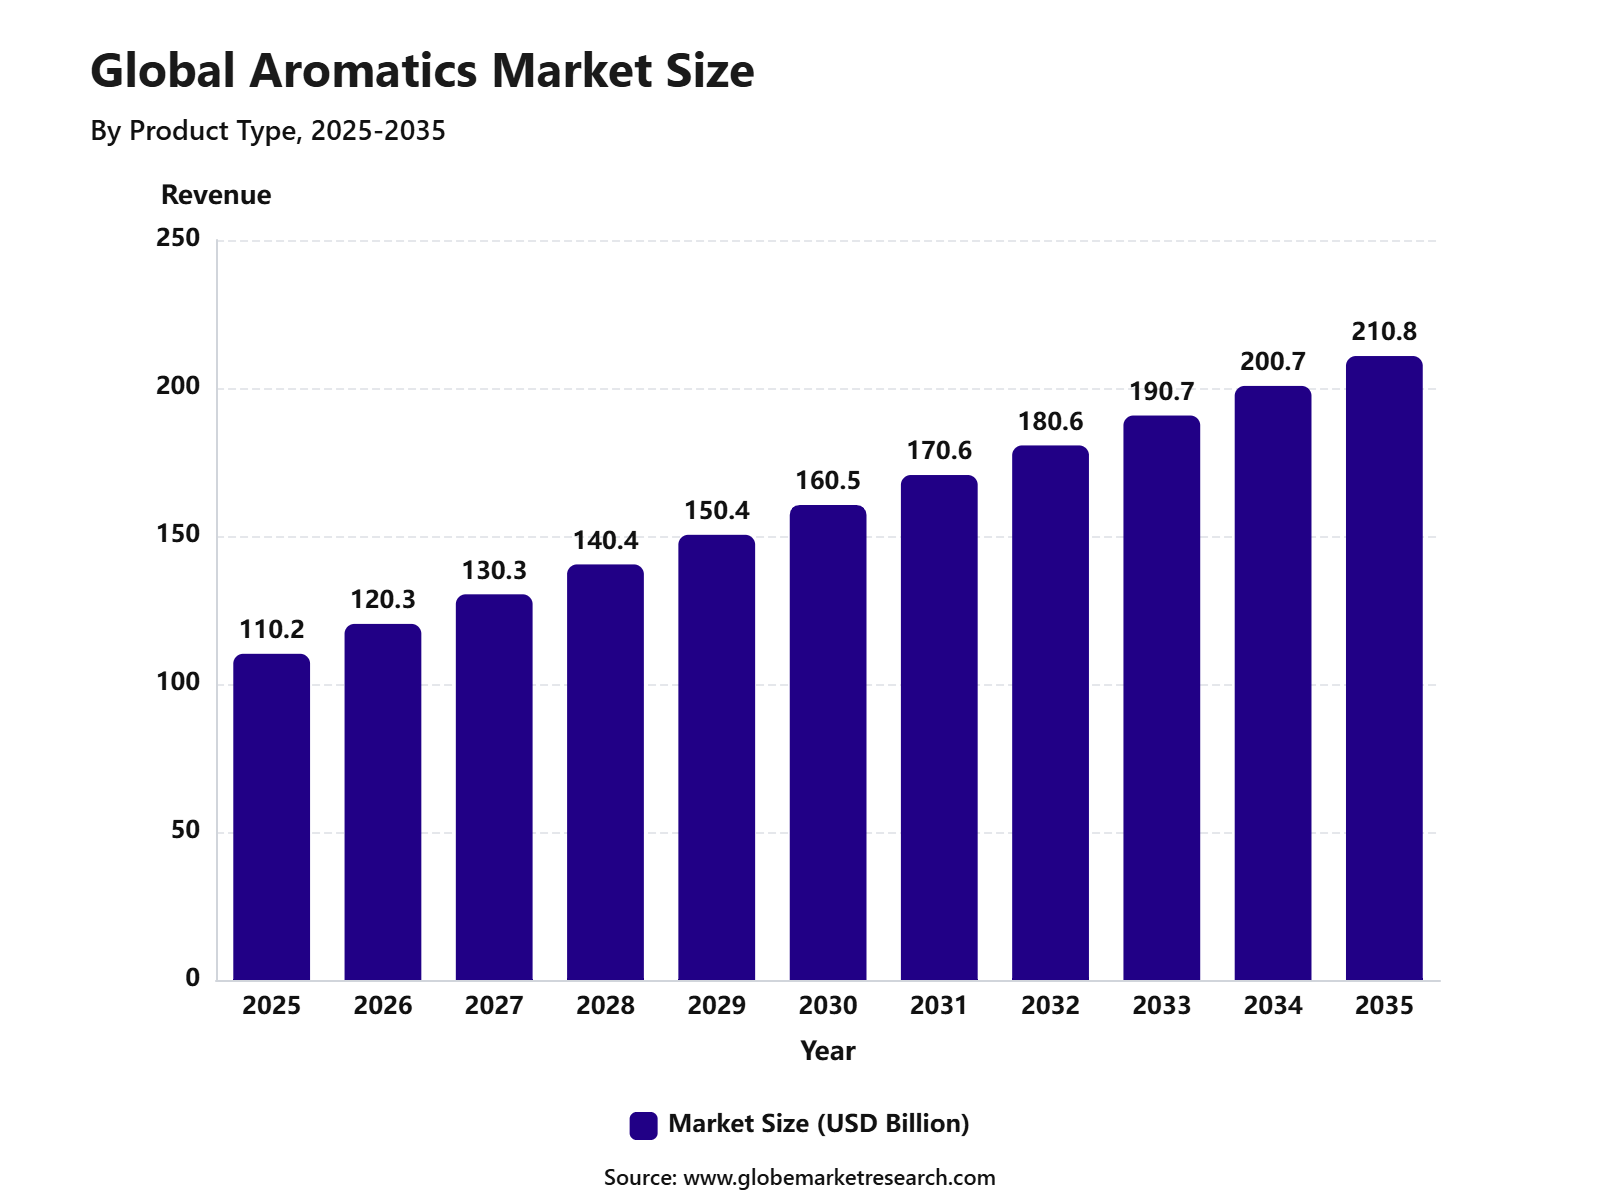 iThe graph shows projected market growth until 2035 based on CAGR analysis. Actual outcomes may vary depending on changing demand, competition, and economic factors.To gain greater insights - request a sample report PDF
The market outlook remains steady as aromatics continue to serve as important building blocks for polymers, textiles, packaging, construction materials, and consumer goods. Growth can be attributed to rising demand for polyester, PET packaging, insulation materials, industrial solvents, and high-performance plastics. The expansion of integrated petrochemical facilities and increasing consumption of aromatic derivatives are expected to support long-term market demand.
Report Highlights | Details |
|---|---|
Market Revenue (2025) | USD 110.2 Billion |
Forecast Revenue (2035) | USD 210.8 Billion |
CAGR (2025-2035) | 6.7% |
Base Year for Estimation | 2025 |
Historic Data | 2020-2024 |
Forecast Period | 2025-2035 |
Key Market Insights
Benzene led the product type segment with 39.2% share, supported by its wide use in producing plastics, resins, synthetic fibers, rubber, detergents, and specialty chemicals.
Catalytic reformate accounted for 54.6% share by source, driven by its strong availability from refinery operations and high aromatic content used in chemical production.
Chemical intermediates held 43.1% share by application, supported by rising demand for aromatics in polymers, solvents, additives, coatings, and industrial chemical formulations.
Chemicals captured 45.0% share by end-use industry, driven by broad consumption of benzene, toluene, and xylene in downstream chemical manufacturing.
Asia Pacific led the aromatics market with 48.9% share, supported by strong petrochemical production, expanding manufacturing activity, and high demand from plastics, textiles, packaging, and chemical industries.
Top Funding and Investment
Funding in the aromatics market is mainly moving into integrated refinery, petrochemical, paraxylene, benzene, and PTA-linked assets. Standalone aromatics projects are less common, as companies are investing in larger crude-to-chemicals and refinery-integrated platforms to improve feedstock control, lower logistics cost, and secure downstream demand.
Aramco, Sinopec, and Yasref: Saudi Arabia Petrochemical Expansion: Aramco, Sinopec, and Yasref signed a framework agreement for a major petrochemical expansion at the Yasref refinery in Yanbu. The project involves investment of over USD 10 billion and includes a 1.8 million tons per year mixed-feed steam cracker and a 1.5 million tons per year aromatics complex with downstream derivatives. This investment is important because it strengthens Saudi Arabia’s position in aromatics, petrochemical feedstocks, and export-focused chemical production.
Huajin Aramco Petrochemical Company: Panjin, China: The HAPCO project in Panjin, China, is one of the largest aromatics-linked investments under construction. The complex has an estimated construction cost of SAR 44.4 billion, or USD 11.8 billion, and is designed with a 300,000 barrels per day refinery, 1.65 million tons per year of ethylene, and 2 million tons per year of paraxylene. The project is expected to support China’s domestic demand for PX, polyester feedstocks, and high-value petrochemical products.
Fujian Gulei Phase II: Sinopec, Aramco, and Fujian Petrochemical: The Fujian Gulei Phase II project represents a total investment of RMB 71.1 billion. The project includes a 16 million tons per year oil refining unit, 1.5 million tons per year ethylene unit, more than 30 refining and chemical units, and 2 million tons of paraxylene and downstream derivatives capacity. This investment directly supports China’s strategy to localize aromatic feedstocks used in polyester, PET packaging, fibers, and chemical intermediates.
Hengyi Industries: Pulau Muara Besar Expansion, Brunei: Hengyi Industries’ Brunei expansion is a major Southeast Asian aromatics investment. The Phase II expansion was earlier indicated at about USD 9 billion, while the 2026 update confirmed a 12 million tons per year crude processing expansion focused on diesel, paraxylene, benzene, polypropylene, and other higher-value products. The project strengthens Brunei’s position as an export hub for PX and benzene serving Asian polyester and plastics chains.
Product Type Analysis
Benzene led the Aromatics Market with 39.2% share, supported by its wide use as a core petrochemical building block. It is used to produce several downstream chemicals that are further processed into plastics, resins, synthetic fibers, rubber, detergents, dyes, pesticides, and industrial materials.
The growth of this segment can be attributed to strong demand from ethylbenzene, cumene, cyclohexane, nitrobenzene, and alkylbenzene production. These intermediates are important in the manufacturing of polystyrene, phenol, acetone, nylon, aniline, detergents, and other chemical products.
Benzene is expected to remain the leading product type because it is deeply integrated into the global petrochemical value chain. However, demand will continue to be influenced by feedstock prices, refinery output, petrochemical capacity, environmental regulations, and downstream plastics consumption.
Source Analysis
Catalytic reformate accounted for 54.6% share, making it the leading source segment in the Aromatics Market. Reformate is produced through catalytic reforming of naphtha and contains high-value aromatic compounds, including benzene, toluene, and xylenes.
The dominance of this segment can be linked to its strong integration with refinery operations. Catalytic reforming improves gasoline octane value while also creating streams that can be used for aromatics extraction, making it important for both fuel and petrochemical production.
Catalytic reformate is expected to remain a key source of aromatics, especially in regions with large refining and petrochemical integration. Demand will remain supported by benzene, toluene, and xylene extraction, although output may be affected by refinery operating rates, gasoline demand, and changing fuel specifications.
Application Analysis
Chemical intermediates led the application segment with 43.1% share, supported by the use of aromatics in producing a wide range of downstream chemicals. Benzene, toluene, and xylenes are converted into products used in plastics, synthetic fibers, solvents, coatings, adhesives, detergents, rubber, and specialty chemicals.
The growth of this segment can be attributed to strong demand from high-volume chemicals such as styrene, phenol, acetone, caprolactam, terephthalic acid, and isocyanates. These intermediates support major industries such as packaging, automotive, construction, textiles, electronics, and consumer goods.
Chemical intermediates are expected to remain the largest application area because aromatics are essential raw materials for several large petrochemical chains. Growth will depend on industrial production, polymer demand, manufacturing activity, and the pace of recycling and circular chemical development.
End-Use Industry Analysis
The chemicals industry accounted for 45.0% share of the Aromatics Market, supported by high consumption of benzene, toluene, and xylenes in downstream chemical manufacturing. Aromatics are used as feedstocks for resins, fibers, solvents, additives, surfactants, coatings, elastomers, and engineering plastics.
The segment’s dominance can be attributed to the broad use of aromatic derivatives across everyday and industrial products. Chemical manufacturers rely on aromatics because they provide the base structure for many high-volume intermediates and specialty chemical products.
The chemicals industry is expected to remain the leading end-use segment as demand continues from plastics, synthetic rubber, paints, adhesives, detergents, and textile intermediates. Producers are also expected to focus on process efficiency, cleaner production routes, and improved feedstock flexibility.
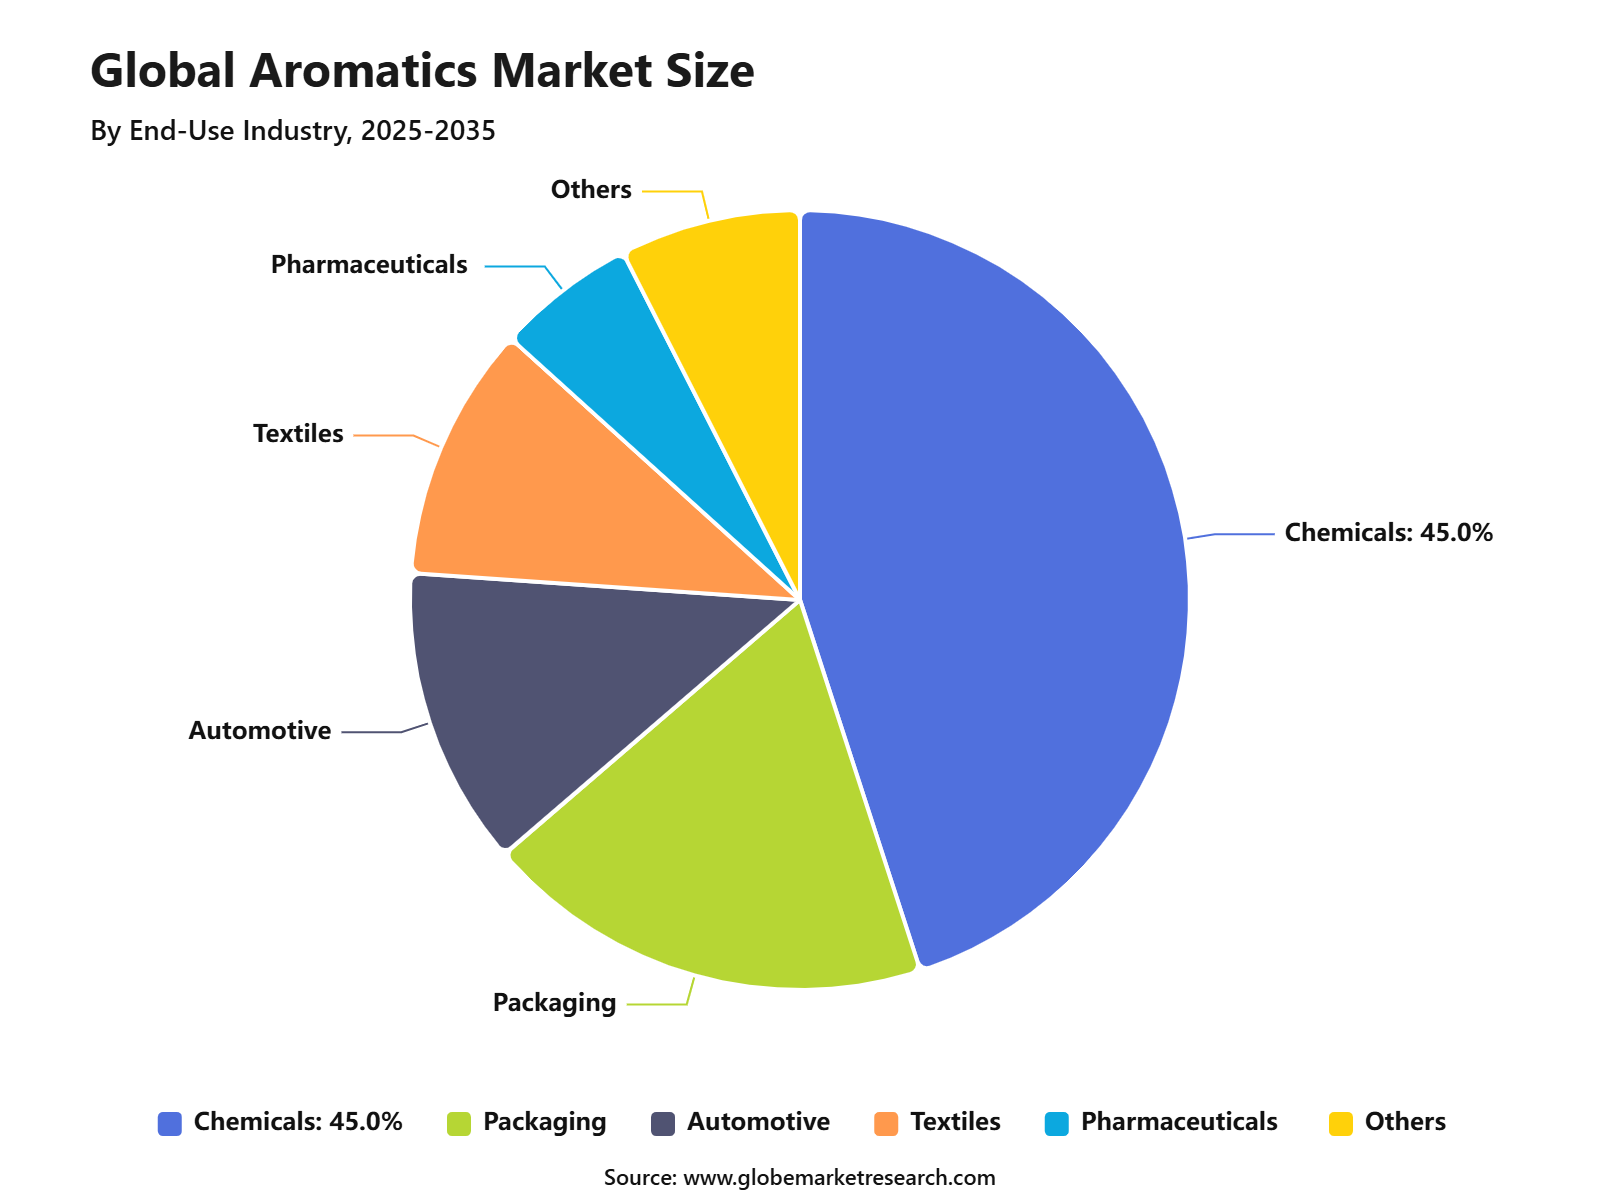 iThe graph shows projected market growth until 2035 based on CAGR analysis. Actual outcomes may vary depending on changing demand, competition, and economic factors.To gain greater insights - request a sample report PDF
Regional Analysis
Asia Pacific led the Aromatics Market with 48.9% share, supported by strong petrochemical production, large refining capacity, and high demand from packaging, textiles, automotive, electronics, construction, and consumer goods industries. China, India, Japan, South Korea, and Southeast Asia are major contributors to regional aromatics consumption.
The region’s dominance can be linked to its large downstream manufacturing base and strong demand for benzene, toluene, xylene, styrene, phenol, and polyester intermediates. Asia Pacific also benefits from integrated refinery and petrochemical complexes that support large-scale aromatics supply.
Asia Pacific is expected to remain the leading regional market due to continued industrialization, packaged goods growth, textile production, and chemical manufacturing expansion. Opportunities are likely to remain strong in benzene derivatives, catalytic reformate-based aromatics, chemical intermediates, polyester value chains, and specialty chemical applications.
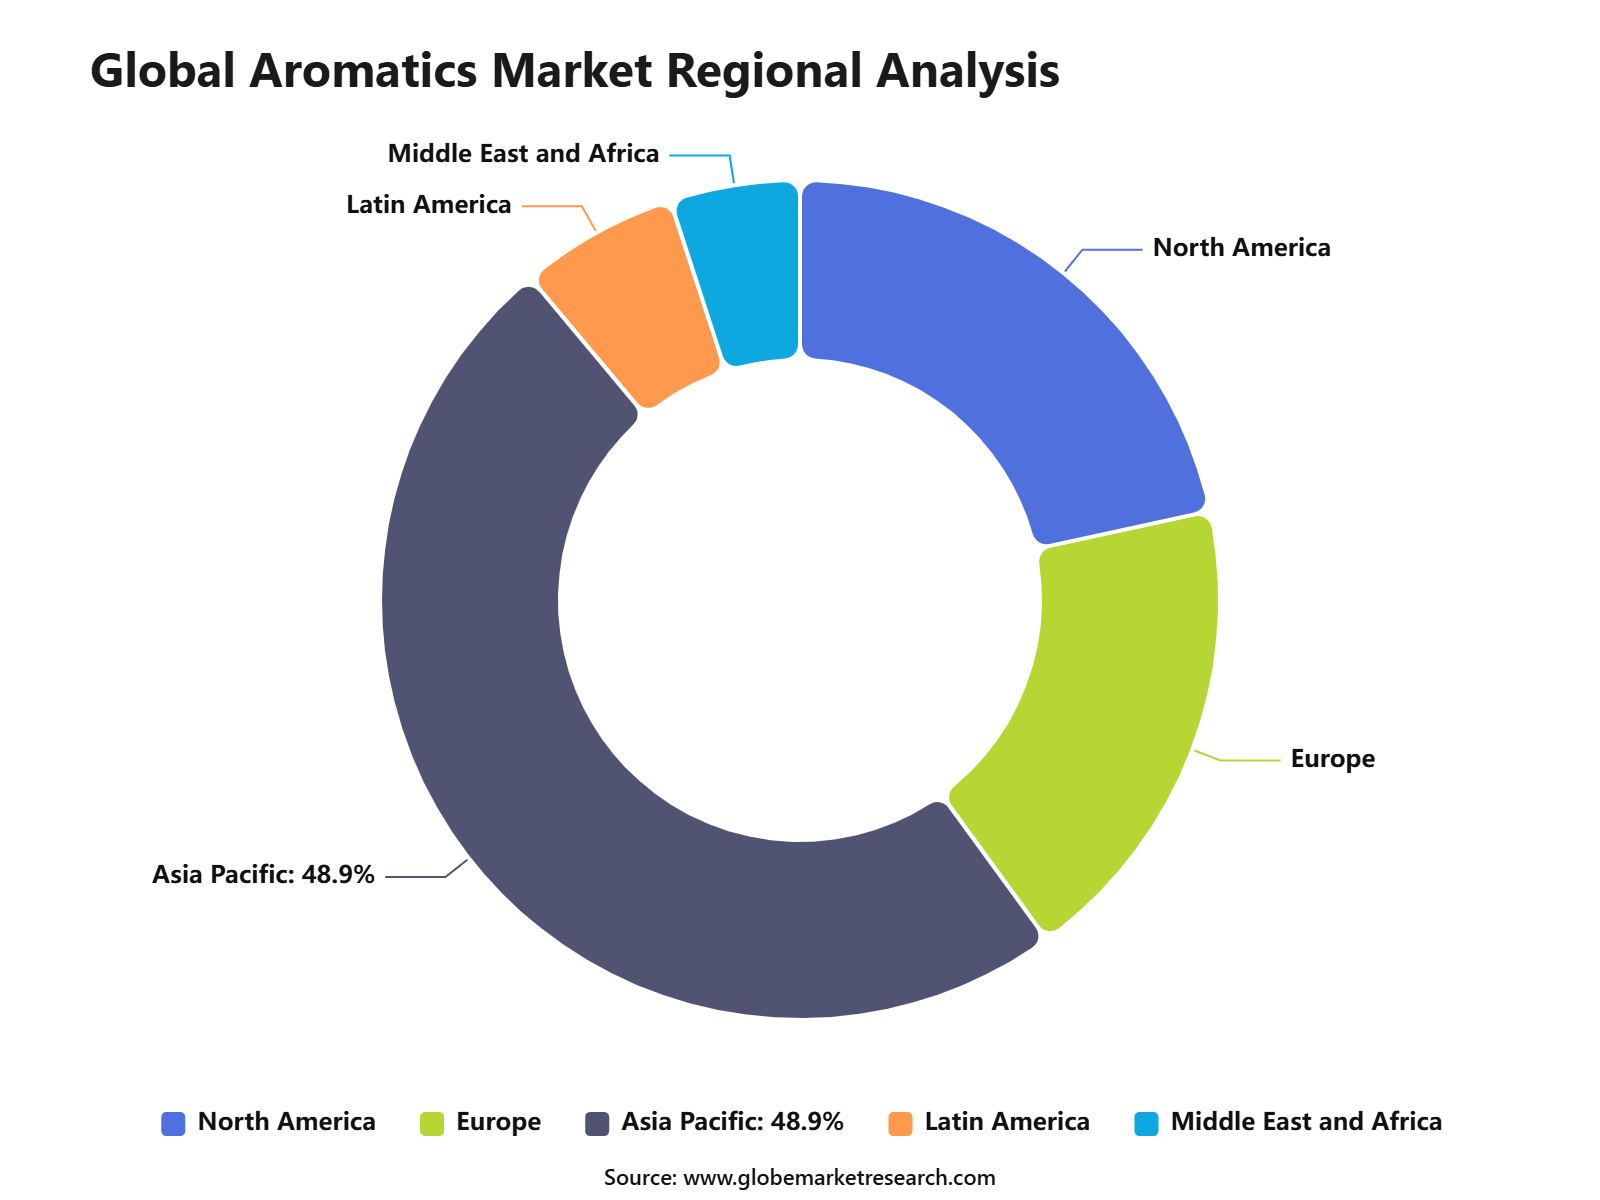 iThe graph shows projected market growth until 2035 based on CAGR analysis. Actual outcomes may vary depending on changing demand, competition, and economic factors.To gain greater insights - request a sample report PDF
Regional Impact Analysis
Impact Factor | Estimated CAGR Impact | Regional Relevance | Market Impact |
|---|---|---|---|
Asia Pacific market leadership | +2.3% | Asia Pacific, 48.9% share in 2025 | Leads chemical demand. |
China petrochemical capacity expansion | +1.5% | China | Drives regional volume. |
India industrial and packaging growth | +1.1% | India | Supports future demand. |
North America refining and chemical base | +0.9% | U.S. and Canada | Supports stable output. |
Europe specialty chemical demand | +0.7% | Germany, France, Netherlands, UK | Builds value-added use. |
Go-To-Market Startagy
The go-to-market strategy for the Aromatics Market should be built around integrated supply agreements with downstream users in polyester, PET packaging, styrene, phenol, solvents, coatings, adhesives and gasoline blending. Demand is still tied to petrochemical feedstock availability, but buying behaviour is becoming more cautious. The IEA reported that petrochemical feedstock use increased only 1.2% in 2025, compared with 2.6% in 2024, showing that producers need disciplined pricing and stronger customer contracts.
Asia remains the most important commercial focus because downstream polyester and PTA assets are concentrated there. In China, polyester plant operating rates averaged 90.11% in 2025 through mid-December, but domestic demand was still not strong enough to absorb all capacity additions. This means aromatics suppliers need flexible export channels, contract-based selling and closer coordination with PTA, PET resin and polyester yarn customers.
Sales economics is also being shaped by fuel-quality rules and higher compliance needs. In the U.S., refiners must meet an annual average gasoline benzene content standard of 0.62 volume percent, with a maximum average standard of 1.3 volume percent. This limits uncontrolled fuel blending demand, but it supports higher-value sales of compliant, chemical-grade aromatics for industrial derivatives, solvents and specialty applications.
Revenue Potential Analysis
Revenue Landscape Across
Revenue potential is strongest across paraxylene to PTA, benzene to styrene and phenol, orthoxylene to phthalic anhydride, and toluene or mixed xylenes for solvents and gasoline blending. China currently has about 45 million to 50 million mt of paraxylene capacity, while PTA capacity stands near 87 million to 88 million mt, creating a large feedstock gap that supports imports, regional trading and integrated supply contracts.
The paraxylene revenue pool remains attractive but volatile. S&P Global reported that China may add 5 million to 7 million mt of PX capacity in late 2026 and early 2027, while South Korea exported 4.31 million mt of PX to China in 2025. This shows that domestic expansion has not fully removed China’s import need, especially when maintenance or plant reliability affects local production.
Orthoxylene is also showing short-term price strength because supply tightened during maintenance. China’s OX exports fell to 28,702 mt in April 2026, down 33% month over month, while Taiwan and India were the top buyers. The average CFR China OX marker increased by USD 153.25 per mt month over month in April, showing how quickly revenue can improve when supply becomes tight.
Financial Impact
The financial impact of aromatics is strongly linked to plant integration, operating rates and downstream demand. In June 2026, China’s polyester plant operating rate stood at 78.8%, while PTA plant operating rates were 69.2%. Lower downstream run rates can reduce paraxylene pull, pressure spreads and weaken short-term earnings for non-integrated suppliers.
Export and import movement can also change margins quickly. China’s PX imports slipped 30.6% month over month to 481,753 metric tons, while PTA exports rose 12.1% month over month to 326,088 mt. This indicates that aromatics producers must manage inventory carefully, as weak polyester demand can shift value from domestic sales toward export channels.
The strongest financial upside is expected for companies that control feedstock, aromatics production and downstream derivatives in one chain. Aramco and Sinopec’s planned Yasref expansion includes a 1.8 million tons-per-year mixed-feed steam cracker and a 1.5 million tons-per-year aromatics complex, which is expected to improve value capture from crude and refined products. This model can reduce logistics cost, improve utilization and support stronger contract-based revenue.
Market Trend Analysis
Impact Factor | Estimated CAGR Impact | Regional Relevance | Market Impact |
|---|---|---|---|
Benzene remains leading product type | +1.6% | Asia Pacific, North America, Europe | Leads derivative demand. |
Catalytic reformate remains key source | +1.4% | Global refining hubs | Supports aromatics supply. |
Chemical intermediates lead application demand | +1.2% | Global | Drives industrial usage. |
Chemicals remain major end-use industry | +1.1% | Asia Pacific, Europe, North America | Supports stable growth. |
Integrated refinery-petrochemical operations grow | +0.9% | Asia Pacific, Middle East | Improves cost efficiency. |
Investor Type Impact Matrix
Investor Type | Estimated CAGR Impact | Regional Relevance | Market Impact |
|---|---|---|---|
Petrochemical Producers | +1.5% | Global | Expands aromatics capacity. |
Chemical Manufacturers | +1.3% | Asia Pacific, Europe, North America | Drives downstream demand. |
Polymer and Resin Producers | +1.1% | China, India, U.S., Europe | Supports derivative use. |
Refining and Integrated Energy Companies | +0.9% | Asia Pacific, Middle East, North America | Improves feedstock access. |
Sustainability and Recycling Investors | +0.7% | Europe, North America, Asia Pacific | Supports circular chemicals. |
Segment Covered in the Report
By Product Type
Benzene
Toluene
Xylene
Styrene
Others
By Source
Catalytic Reformate
Pyrolysis Gasoline
Coal Tar
Others
By Application
Solvents
Chemical Intermediates
Plastics and Polymers
Synthetic Fibers
Pharmaceuticals
Others
By End-Use Industry
Chemicals
Packaging
Automotive
Textiles
Pharmaceuticals
Others
By Region
North America
Europe
Asia Pacific
Latin America
Middle East and Africa
Drivers Impact Analysis
Impact Factor | Estimated CAGR Impact | Regional Relevance | Market Impact |
|---|---|---|---|
Rising demand for benzene derivatives | +1.7% | Asia Pacific, North America, Europe | Drives core consumption. |
Growth in plastics and polymer production | +1.5% | China, India, Southeast Asia, U.S. | Supports downstream use. |
Expansion of chemical intermediates | +1.3% | Asia Pacific, Europe, Middle East | Builds industrial demand. |
Increasing use in synthetic fibers | +1.0% | Asia Pacific, Europe | Supports textile applications. |
Growth in packaging and consumer goods | +0.9% | Global | Expands resin demand. |
Restraints Impact Analysis
Impact Factor | Estimated CAGR Impact | Regional Relevance | Market Impact |
|---|---|---|---|
Crude oil and feedstock price volatility | -0.9% | Global producers | Pressures margins. |
Environmental concerns over petrochemicals | -0.8% | Europe, North America, developed Asia | Raises compliance burden. |
Health risks linked to benzene exposure | -0.7% | Regulated industrial markets | Increases safety controls. |
Demand fluctuation in downstream industries | -0.6% | Global | Affects production planning. |
Rising pressure for recycled materials | -0.5% | Europe, North America, Asia Pacific | Slows virgin demand. |
Opportunities Impact Analysis
Impact Factor | Estimated CAGR Impact | Regional Relevance | Market Impact |
|---|---|---|---|
Growth in paraxylene demand | +1.6% | Asia Pacific, Middle East, North America | Supports polyester value chain. |
Expansion of integrated petrochemical complexes | +1.4% | China, India, Middle East | Improves production scale. |
Rising demand for chemical intermediates | +1.2% | Global manufacturing hubs | Expands downstream usage. |
Development of bio-based aromatics | +1.0% | Europe, Japan, North America | Supports sustainability shift. |
Growth in specialty chemical applications | +0.8% | Europe, U.S., Asia Pacific | Builds higher-value demand. |
Challenges Impact Analysis
Impact Factor | Estimated CAGR Impact | Regional Relevance | Market Impact |
|---|---|---|---|
Managing emissions from production | -0.8% | Global petrochemical plants | Raises operating cost. |
Maintaining feedstock supply stability | -0.7% | Asia Pacific, Europe | Impacts plant utilization. |
Meeting workplace safety standards | -0.6% | Global chemical facilities | Increases compliance needs. |
Balancing capacity with demand cycles | -0.5% | Global | Affects pricing strength. |
Transitioning toward circular chemicals | -0.4% | Europe, North America | Requires process changes. |
Recent Developments
In January 2026, Hengyi Petrochemical moved ahead with the second phase of its Brunei refinery and petrochemical project. The expansion is planned at 12 million tonnes per year of crude processing capacity and will produce paraxylene, benzene, polypropylene, diesel, and other higher-value products. This strengthens Asia’s position as the main capacity growth center for aromatics.
In April 2025, Aramco, Sinopec, and Yasref signed a Venture Framework Agreement for a major petrochemical expansion at the Yasref refinery in Yanbu, Saudi Arabia. The planned project includes a 1.8 million tonnes per year mixed-feed steam cracker and a 1.5 million tonnes per year aromatics complex with downstream derivatives. This development shows stronger refinery-to-chemicals integration in the Middle East.
In September 2025, Aramco, Sinopec, and Fujian Petrochemical Company Limited formed a new joint venture, Fujian Sinopec Aramco Refining and Petrochemical Co., Ltd. The venture will develop an integrated complex in Fujian, China, with 16 million tonnes per year crude refining capacity and 2 million tonnes per year paraxylene and downstream derivatives capacity.
Competitive Landscape
The market is characterized by intense competition among established players and emerging companies. Strategic partnerships, mergers and acquisitions, and product innovation are key strategies employed by market participants.
Key Market Players
BASF SE
ExxonMobil Corporation
LyondellBasell Industries N.V.
Shell Chemicals
Sinopec
Reliance Industries Limited
Chevron Phillips Chemical
SABIC
INEOS Group
Mitsubishi Chemical Corporation
Other Key Players
Research Methodology
This market study is prepared using a combination of primary and secondary research. Primary research includes discussions with manufacturers, suppliers, distributors, consultants, industry experts, and end users. Secondary research covers company reports, government databases, trade associations, technical publications, regulatory sources, and trusted industry documents. The collected information is used to assess market demand, pricing trends, technology adoption, competitive activity, and regional performance.
AI language models are not used as primary data sources, and publicly available AI-generated content is not treated as market evidence. Computational tools may be used to support data processing, translation, data classification, and pattern identification. However, every published assessment is supported by verified sources, human review, and primary market discussions.
Market estimates are developed through top-down and bottom-up approaches and validated using data triangulation. Revenue, production, shipment, pricing, and application-level data are compared across multiple sources. Forecasts consider economic conditions, regulatory changes, investment activity, innovation, supply chain developments, and industry risks. All findings are reviewed through source verification and internal quality checks before publication.
Part I
Source Management & Input Data Standards
Who provides data, how sources are qualified, and what types of evidence are admissible.
Part II
Research Scope & Market Coverage
How we define the markets we assess and the parameters that govern each product.
Part III
Data Collection, Verification & Submission
The mechanics of gathering, cross-checking, and hierarchically ranking evidence.
Part IV
Assessment Determination & Quality Controls
How raw data becomes a published assessment — normalisation, expert judgement, and outlier exclusion.
Part V
Publication, Corrections & Revision
Our publication schedule, corrections policy, and methodology review cycle.
Part VI
Independence, Ethics & Complaints
Conflict-of-interest policies, editorial independence, and how clients raise concerns.
Google · Preferred Sources
Don't miss the latest market research insights and industry updates on Google.
Add Globe Market Research as a preferred source in the Google app to see our reports, analysis, and market stories in your news suggestions.
Meet the Team
This report was prepared by our expert analysts with deep industry knowledge and research experience.
Pratiksha K. is a Senior Research Analyst with more than five years of experience in market research, industry analysis, competitive intelligence, and business strategy. She has contributed to detailed market reports, customized research studies, company profiling, market sizing, trend analysis, and strategic consulting projects for clients across different regions. Her industry expertise covers Chemical and Material, Consumer Goods, Food & Beverages and Energy & Power. She closely evaluates changing customer requirements, technology developments, regulatory conditions, supply chain structures, investment activity, and competitive strategies to provide clear and practical market insights.
Sayali brings more than 7 years of experience to Globe Market Research, supporting the accuracy, clarity, and relevance of research content across multiple industries. She reviews market data, segment analysis, competitive insights, and industry trends to ensure each report meets strong quality standards and provides practical value to business decision-makers. Her expertise spans healthcare, information technology, consumer goods, and diverse cross-industry domains. With a strong focus on data reliability, structured analysis, and clear presentation, Sayali helps ensure that each research output delivers well-reviewed insights for clients, investors, consultants, and industry stakeholders.
Frequently Asked Questions
Related Reports
More in Chemical and Material
Sulfuric Acid Market to Hit USD 61.5 Billion by 2035
Sulfuric Acid Market Size, Share, Analysis By Raw Material (Elemental Sulfur, Base Metal Smelters, Pyrite Ore, Others), By Application (Fertilizers, Chemical Manufacturing, Metal Processing, Petroleum Refining, Textile, Automotive, Pulp and Paper, Others), By Distribution Channel (Direct Sales, Distributors), By Regional Insights, Business plan and Project Report, Investment Opportunities, Profitability, Industry Trends, Leading Companies and Growth Forecasts by 2026-2035
Powder Metallurgy Market to Hit USD 17.0 Billion by 2035
Powder Metallurgy Market Size, Share, Analysis By Material (Ferrous Metals, Non-Ferrous Metals, Others), By Process (Additive Manufacturing, Powder Metal Hot Isostatic Pressing, Conventional Powder Metallurgy), By Application (Automotive, Aerospace and Defense, Healthcare, Electrical and Electronics, Industrial Machinery, Others) , By Regional Insights, Business plan and Project Report, Investment Opportunities, Profitability, Industry Trends, Leading Companies and Growth Forecasts by 2026-2035
Bromine Market to Hit USD 1.5 Billion by 2035
Bromine Market Size, Share, Analysis By Derivative (Organobromine, Clear Brine Fluids, Hydrogen Bromide, Others), By Application (Flame Retardants, Oil and Gas Drilling, Biocides, PTA Synthesis, Plasma Etching, Pharmaceuticals, Energy Storage, Others), By End-Use Industry (Chemicals, Oil and Gas, Pharmaceuticals, Electrical and Electronics, Automotive, Agriculture, Others), By Regional Insights, Business plan and Project Report, Investment Opportunities, Profitability, Industry Trends, Leading Companies and Growth Forecasts by 2026-2035
Hydrogen Cyanide Market to Hit USD 5.95 Billion by 2035
Hydrogen Cyanide Market Size, Share, Analysis By Product Form (Hydrogen Cyanide Liquid, Hydrogen Cyanide Gas), By Application (Adiponitrile, Acetone Cyanohydrin, Sodium Cyanide and Potassium Cyanide, Methionine, Cyanuric Chloride, Others), By End-Use Industry (Chemicals, Mining and Metallurgy, Pharmaceuticals, Agriculture, Textiles, Others), By Regional Insights, Business plan and Project Report, Investment Opportunities, Profitability, Industry Trends, Leading Companies and Growth Forecasts by 2026-2035