

Revenue, 2025
USD 1.1 Bn
Forecast, 2035
USD 17.8 Bn
CAGR, 2025-2035
32.1%
Report Coverage
Global
Market Size and Forecast
The Global Green Hydrogen Production Chemicals Market was worth USD 1.1 billion in 2025 and is expected to reach USD 17.8 billion by 2035, growing at a CAGR of 32.1% from 2025 to 2035. Based on this growth rate, the market is estimated to reach around USD 2.8 billion in 2026. Asia Pacific held the largest regional share of 48.9% in 2025, valued at around USD 0.5 billion, supported by large electrolyzer projects, renewable power expansion, hydrogen hub development, and government-backed clean fuel programs.
The Green Hydrogen Production Chemicals Market includes catalysts, membranes, electrolytes, water treatment chemicals, purification chemicals, and specialty materials used in hydrogen production through renewable-powered electrolysis. These chemicals help improve electrolyzer efficiency, hydrogen purity, system durability, and long-term operating performance. The market is closely linked with green hydrogen plants, fuel cell supply chains, industrial decarbonization, and clean ammonia production.
Key Parameter | Report Details |
|---|---|
Market Revenue, 2025 | USD 1.1 Billion |
Projected Revenue, 2035 | USD 17.8 Billion |
CAGR (2025-2035) | 32.1% |
Largest Region | Asia Pacific (48.9%, USD 0.5 Bn) |
Fastest Growing Region | North America |
Market Concentration | Medium |
Base Year | 2024 |
Forecast Period | 2025-2035 |
The market outlook remains strong as countries and energy companies accelerate investment in low-carbon hydrogen infrastructure. Growth can be attributed to rising demand for clean fuels, increasing electrolyzer deployment, and expanding use of green hydrogen in refining, chemicals, steel, mobility, and power storage. Asia Pacific’s strong renewable energy base, manufacturing capacity, and national hydrogen strategies are expected to support long-term market growth.
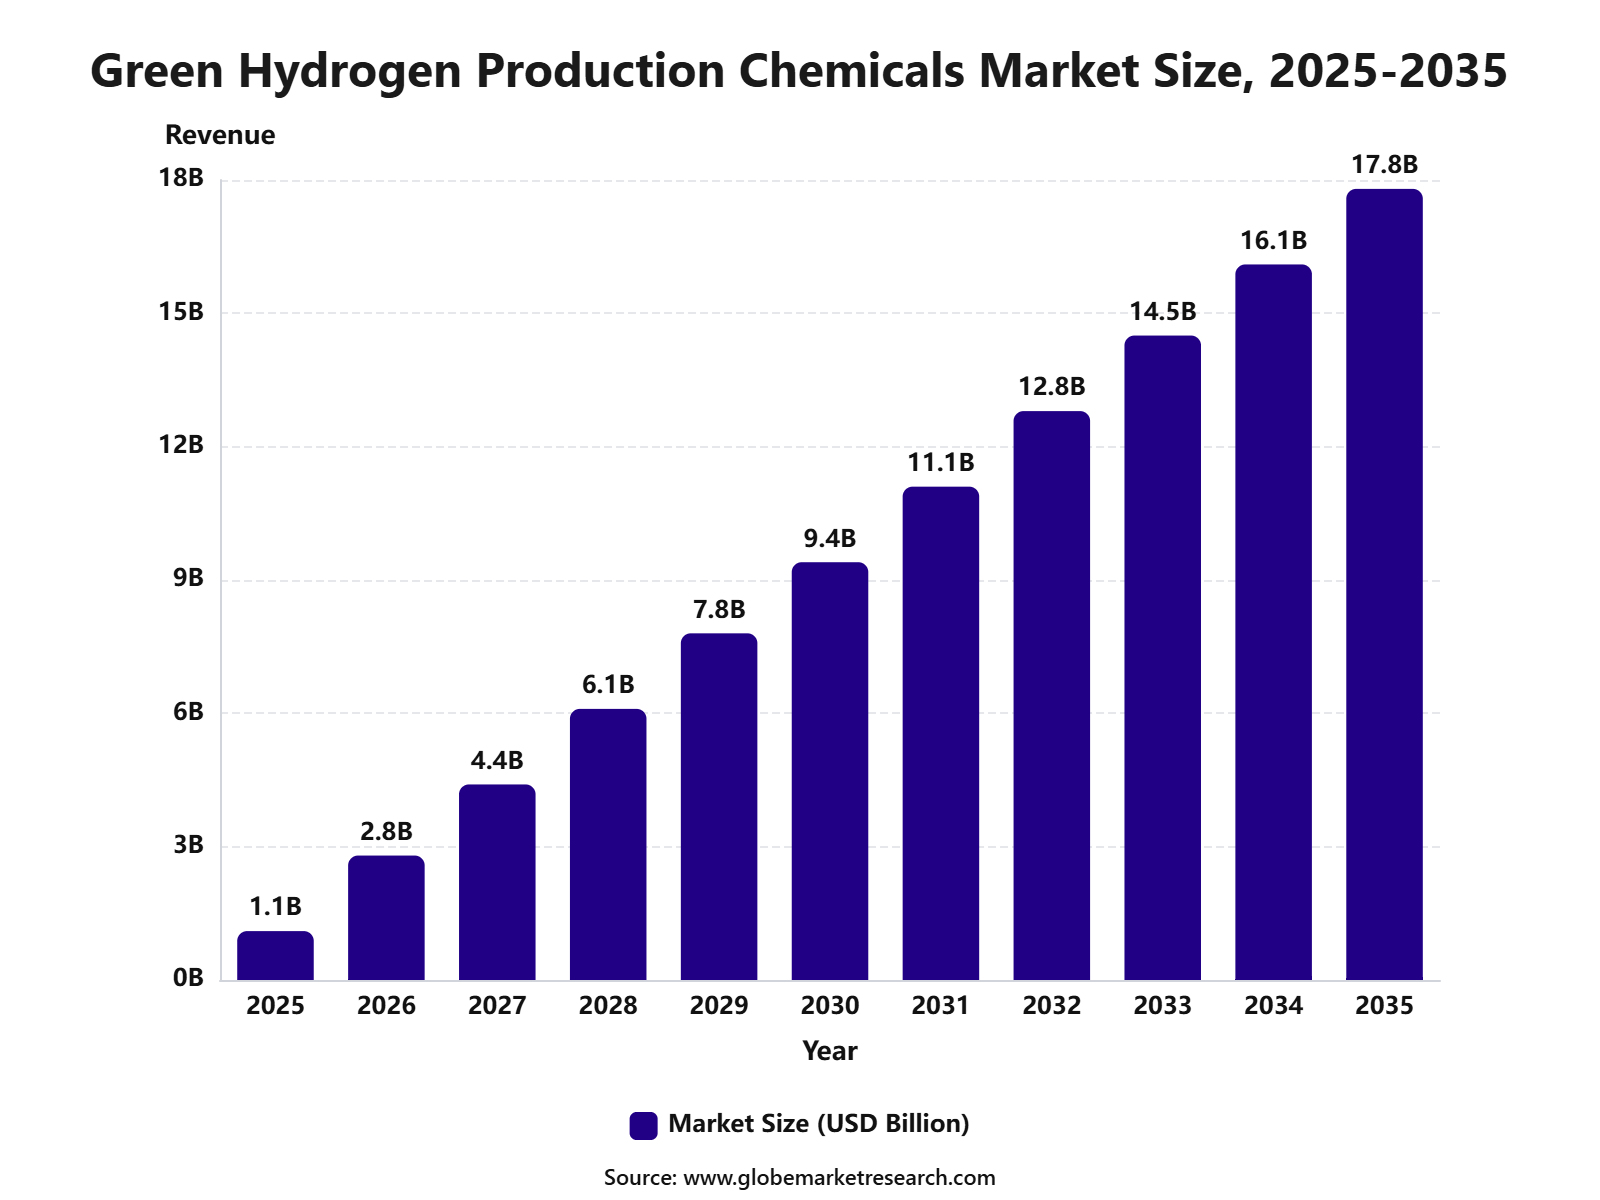 iThe graph shows projected market growth until 2035 based on CAGR analysis. Actual outcomes may vary depending on changing demand, competition, and economic factors.To gain greater insights - request a sample report PDF
Key Market Insights
Membranes and ion exchange materials led the chemical type segment with 62.1% share, supported by their critical role in ion transport, electrolyte separation, system efficiency, and stable electrolyzer performance.
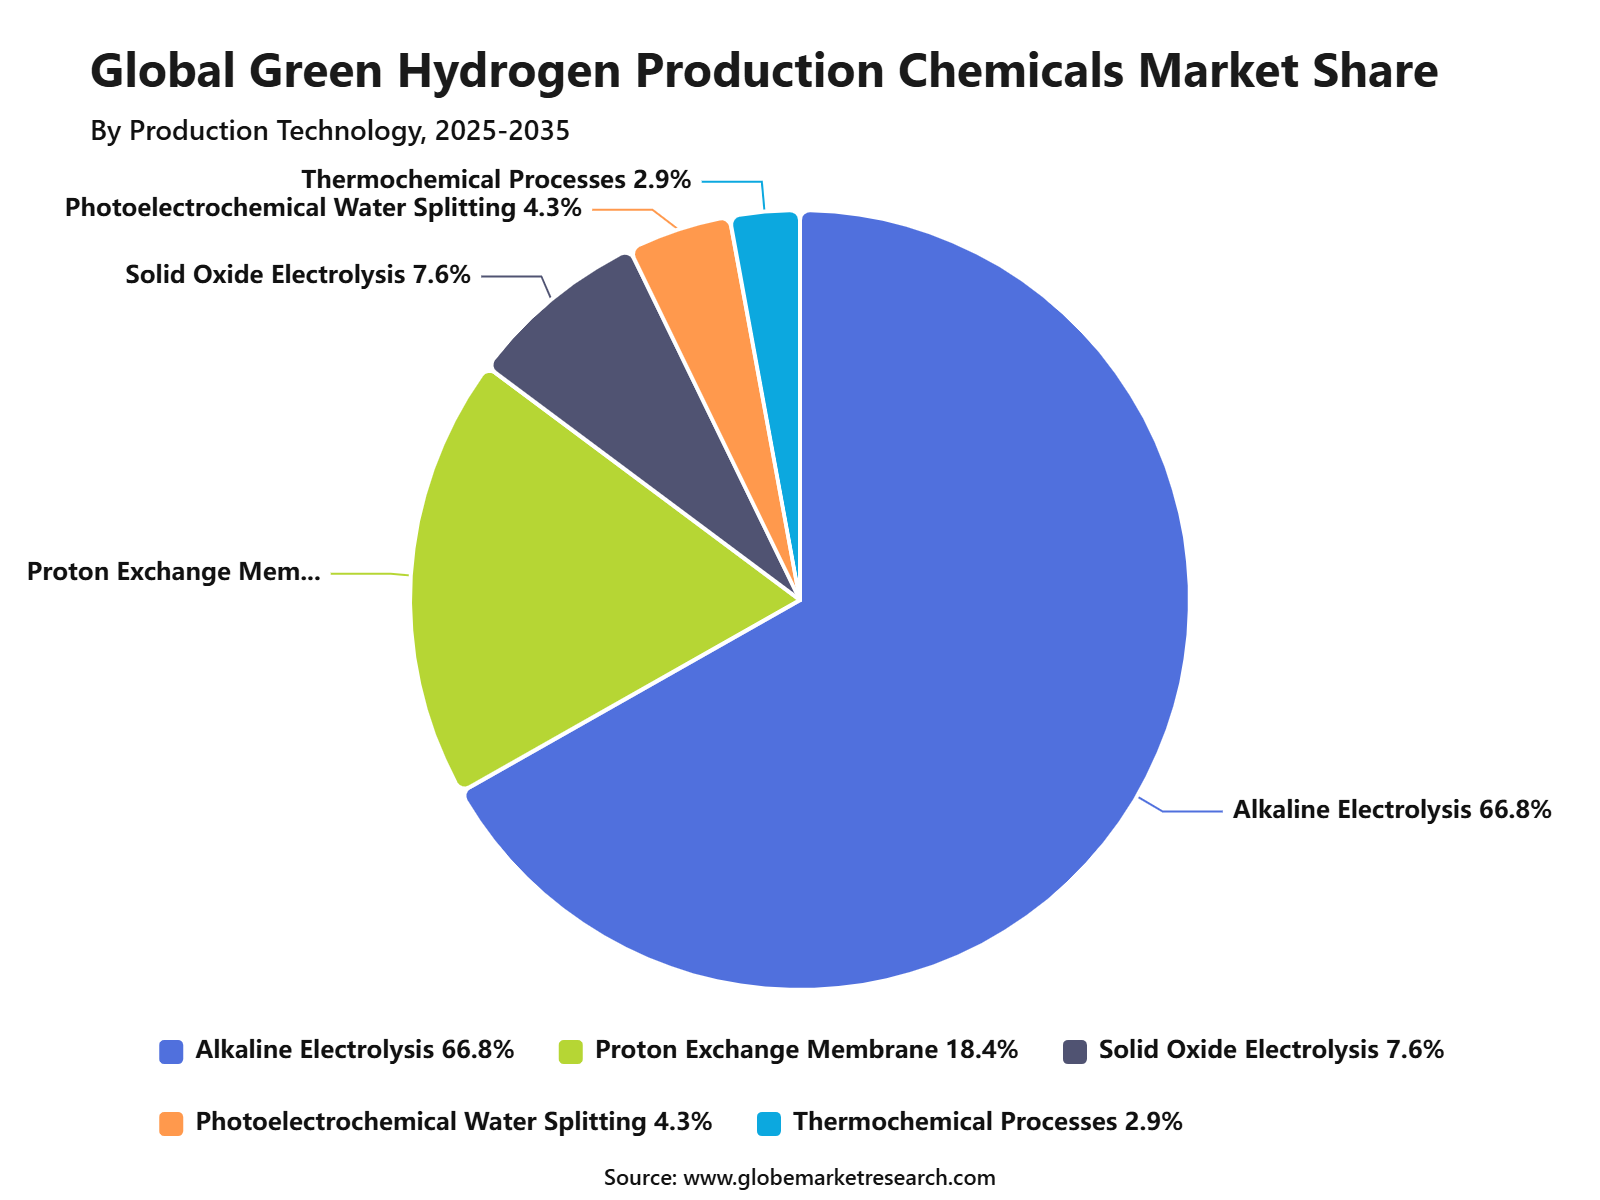
Alkaline electrolysis accounted for 66.8% share by production technology, driven by its mature commercial use, lower operating cost, and wider adoption in large-scale green hydrogen projects.
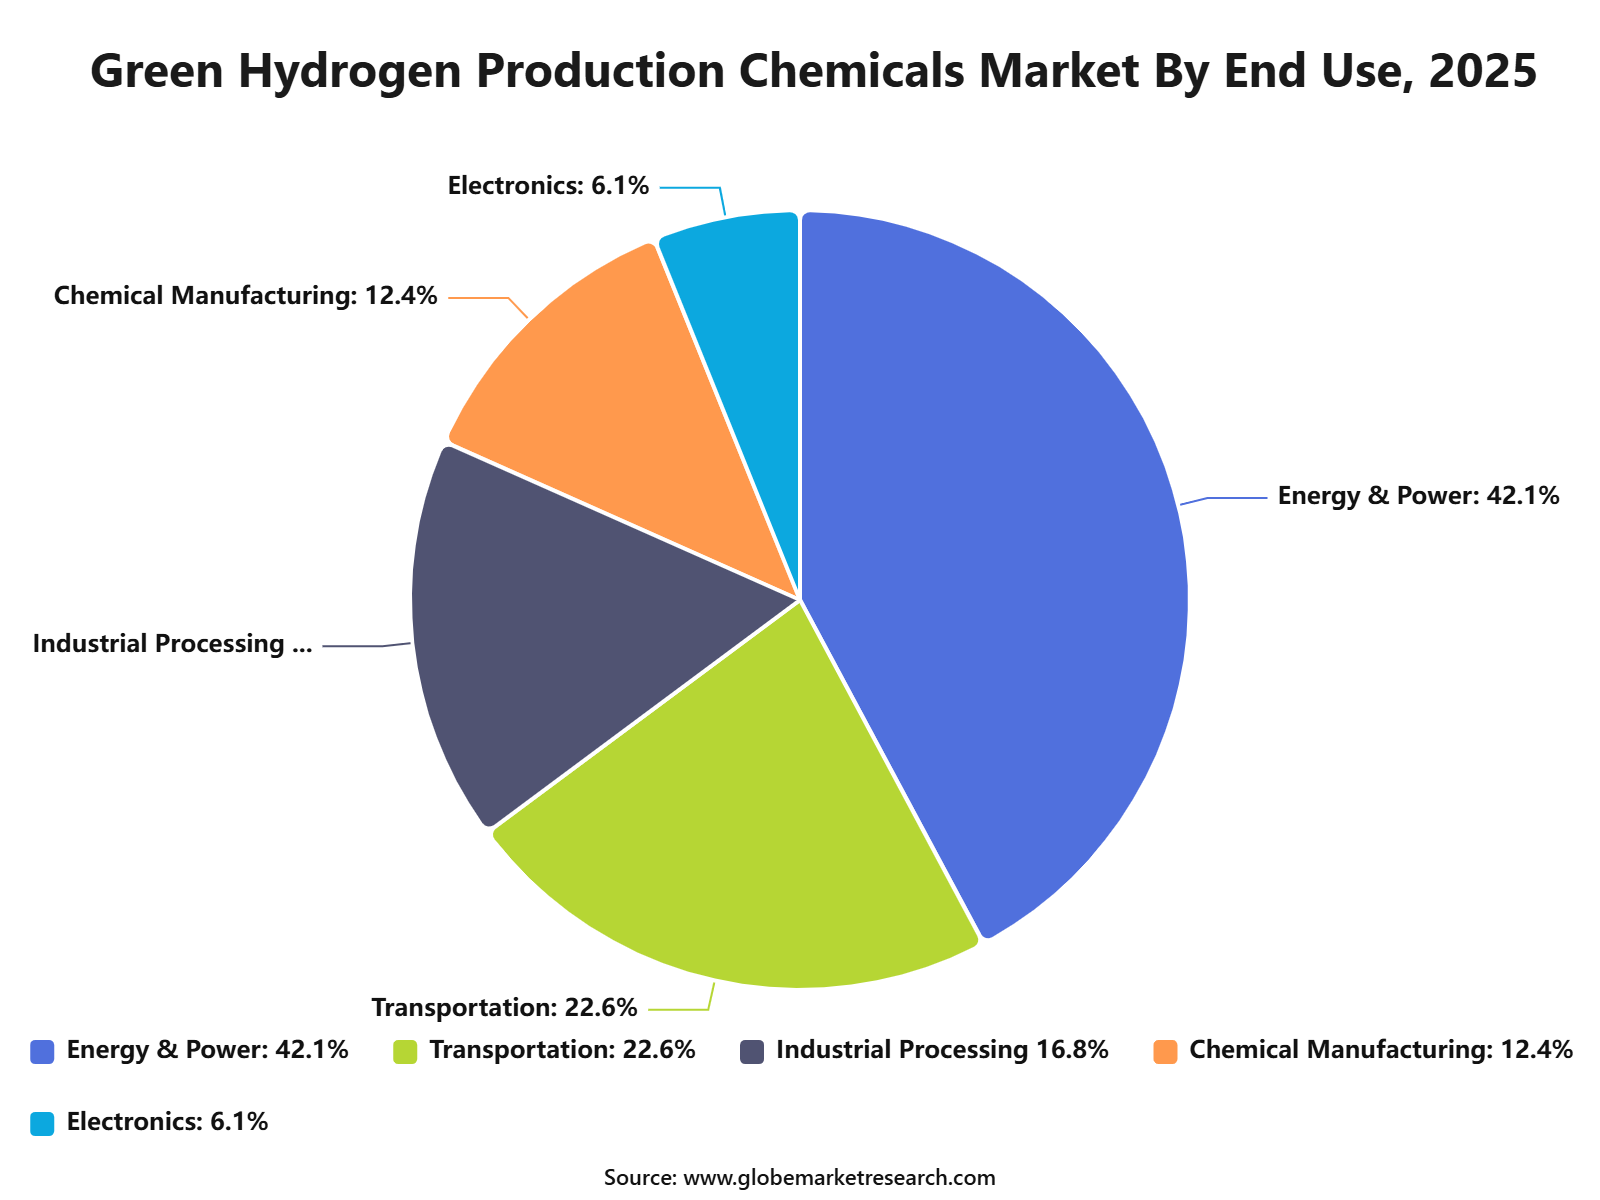
Energy and power held 42.1% share by end-use industry, supported by rising demand for clean hydrogen in renewable energy storage, grid balancing, power generation, and industrial decarbonization.
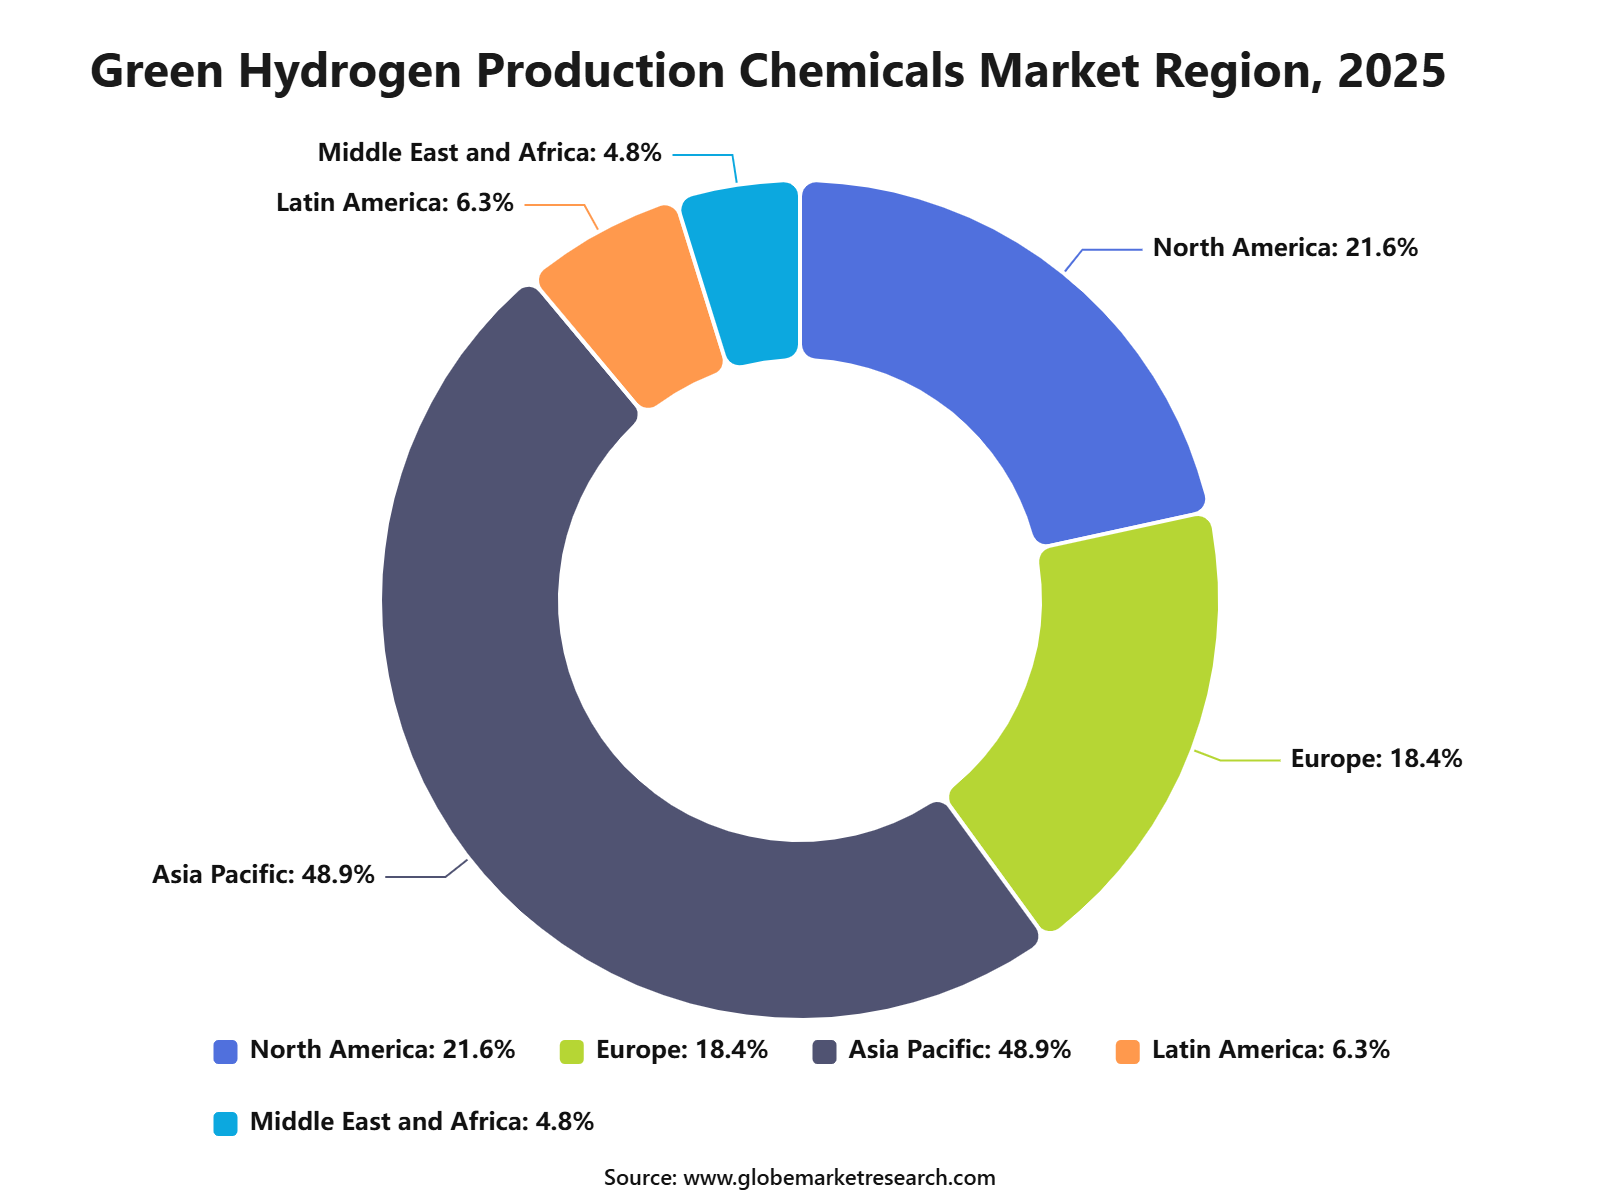
Asia Pacific led the green hydrogen production chemicals market with 48.9% share, valued at USD 0.5 billion, supported by expanding electrolyzer manufacturing, strong renewable energy investment, and growing hydrogen project development across China, India, Japan, South Korea, and Australia.
Top Funding and Investment
Top Investments
Air Liquide and TotalEnergies announced combined investments exceeding EUR 1 billion for two large-scale hydrogen projects in the Netherlands. The developments comprise a 200 MW ELYgator electrolyzer in Rotterdam and a separate 250 MW electrolyzer in Zeeland. Together, the facilities could produce approximately 53,000 tonnes of renewable and low-carbon hydrogen annually.
Topsoe inaugurated its solid oxide electrolyzer cell manufacturing facility in Herning following a total project investment of approximately DKK 2.2 billion. The facility has an initial annual manufacturing capacity of 500 MW, with the option to expand to 5 GW. It will produce high-efficiency SOEC stacks containing advanced ceramic electrodes and electrolyte materials for industrial green hydrogen projects.
BASF commissioned a 54 MW proton exchange membrane electrolyzer at its Ludwigshafen chemical complex. BASF invested approximately EUR 25 million, while German federal and Rhineland-Palatinate authorities provided up to EUR 124.3 million in project support. The system can produce as much as 8,000 tonnes of hydrogen annually and reduce site emissions by up to 72,000 tonnes per year.
Evonik invested a low double-digit million-euro amount in a pilot plant producing DURAION anion-exchange membranes in Marl. The facility entered production in June 2026 and can manufacture sufficient membrane material to support up to 2.5 GW of electrolysis capacity annually. DURAION is designed to enable AEM electrolyzers to operate without expensive fluorinated membrane materials.
Ionomr Innovations opened a 22,000-square-foot development and low-volume manufacturing centre in Boston for PFAS-free ion-exchange membranes and polymers. The facility expands production of materials used in AEM electrolyzers and other electrochemical systems. More than 40 jobs are expected to be created over three years.
Top Funding Transactions
Stargate Hydrogen raised EUR 11 million in Series A equity financing from strategic customers and financial investors, including SmartCap, Giga and UG Investments. The funding is being used to expand manufacturing and testing capacity for precious-metal-free electrolyzers. Stargate’s technology uses ceramic catalyst materials intended to reduce dependence on iridium, platinum, and other costly metals.
Newtrace secured USD 6.3 million, approximately INR 56.9 crore, in funding led by HDFC Bank and Mitsui Sumitomo Insurance Venture Capital. The capital will support pilot manufacturing and commercialization of Voltagen advanced electrodes for alkaline electrolyzers. Initial commercial electrode deliveries are planned within 12 months, with the technology designed as a replacement for conventional electrolyzer electrodes.
HYDGEN raised USD 5 million through a combination of equity and debt led by Transition VC. The proceeds will support a semi-automated production line in Mangaluru and further development of its anion-exchange membrane electrolyzers. HYDGEN currently offers systems ranging from 1 kW to 100 kW and is developing a 250 kW single-stack platform.
Top Acquisitions
thyssenkrupp nucera completed the acquisition of key technology assets from Green Hydrogen Systems. The acquired portfolio includes intellectual property for pressurized alkaline electrolysis and a test facility containing a full-size prototype in Skive, Denmark. The acquisition strengthens thyssenkrupp nucera’s access to electrode, electrolyte-circulation, pressure-management, and stack-design technologies for next-generation alkaline hydrogen systems.
John Cockerill acquired a significant portion of McPhy’s operations and assets following approval from the Belfort Commercial Court. The transaction included the Belfort Gigafactory, electrolyzer technologies, intellectual property, industrial equipment, and 51 of McPhy’s 71 French employees. The assets will support the development and production of John Cockerill’s next-generation pressurized alkaline electrolyzers.
By Chemical Type
Membranes and ion exchange materials accounted for 62.1% share of the Green Hydrogen Production Chemicals Market. This leading position is supported by their critical role in separating ions, improving electrolyzer efficiency, and supporting high-purity hydrogen production.
These materials are widely used in alkaline electrolyzers, proton exchange membrane systems, and other electrolysis technologies. They help control ion movement, reduce gas crossover, improve system durability, and support stable hydrogen output during continuous operation.
Demand is expected to remain strong as green hydrogen projects move from pilot scale to commercial deployment. The need for reliable, efficient, and long-life electrolyzer materials will continue to support the dominance of membranes and ion exchange materials.
By Production Technology
Alkaline electrolysis accounted for 66.8% share of the Green Hydrogen Production Chemicals Market. This dominance is driven by its mature technology base, lower system cost, long operating history, and suitability for large-scale hydrogen production.
This technology uses an alkaline electrolyte solution and specific membrane or separator materials to split water into hydrogen and oxygen. It is widely preferred for industrial hydrogen projects because it offers reliable performance and can be scaled for energy and power applications.
Demand for alkaline electrolysis chemicals is expected to remain strong as developers seek cost-effective green hydrogen production routes. Growth will be supported by renewable power integration, electrolyzer capacity expansion, and rising investment in low-carbon hydrogen infrastructure.
 iThe graph shows projected market growth until 2035 based on CAGR analysis. Actual outcomes may vary depending on changing demand, competition, and economic factors.To gain greater insights - request a sample report PDF
By End Use Industry
Energy and power accounted for 42.1% share of the Green Hydrogen Production Chemicals Market. This leading share is supported by the growing use of green hydrogen in renewable energy storage, grid balancing, power generation, and clean fuel production.
Green hydrogen can store excess solar and wind electricity and supply energy during periods of low renewable output. Chemicals used in hydrogen production systems help maintain electrolyzer performance, hydrogen purity, and long-term operating reliability.
The segment is expected to remain a major demand area as utilities, project developers, and energy companies invest in hydrogen-based clean power systems. Demand will be supported by renewable energy expansion, power-to-gas projects, and the need for flexible low-carbon energy storage.
 iThe graph shows projected market growth until 2035 based on CAGR analysis. Actual outcomes may vary depending on changing demand, competition, and economic factors.To gain greater insights - request a sample report PDF
By Region
Asia Pacific accounted for 48.9% share of the Green Hydrogen Production Chemicals Market, reaching USD 0.5 billion. The region’s leadership is supported by strong renewable energy investment, rising hydrogen project development, and growing demand from energy, power, chemicals, and industrial sectors.
China, India, Japan, South Korea, and Australia are key contributors to regional demand. The region benefits from large clean energy targets, electrolyzer manufacturing capacity, industrial hydrogen consumption, and government-backed hydrogen economy programs.
Asia Pacific is expected to maintain its leading position as green hydrogen production capacity expands across utility and industrial projects. Demand for membranes, ion exchange materials, electrolytes, catalysts, and other production chemicals will remain strong as hydrogen infrastructure continues to scale.
 iThe graph shows projected market growth until 2035 based on CAGR analysis. Actual outcomes may vary depending on changing demand, competition, and economic factors.To gain greater insights - request a sample report PDF
Regional Impact Analysis
Asia Pacific leads the Green Hydrogen Production Chemicals Market with 48.9% share in 2025, valued at around USD 0.5 billion, supported by large green hydrogen project pipelines, electrolyzer manufacturing, renewable power growth, and industrial decarbonization demand. China, India, Japan, South Korea, and Australia remain major regional contributors.
Europe remains important because of hydrogen valleys, industrial decarbonization policy, renewable hydrogen targets, and strong demand from refining, chemicals, steel, and transport fuel projects. North America supports future growth through hydrogen hubs, clean fuel incentives, renewable power projects, and investment in electrolyzer-based production.
Impact Factor | Estimated CAGR Impact | Regional Relevance | Market Impact |
|---|---|---|---|
Asia Pacific market leadership | +9.3% | Asia Pacific, 48.9% share in 2025 | Leads global value demand. |
China electrolyzer manufacturing scale | +6.8% | China | Drives chemical and material demand. |
India green hydrogen programs | +5.5% | India | Supports future project growth. |
Japan and South Korea technology focus | +4.6% | Japan, South Korea | Adds advanced material demand. |
Australia hydrogen export projects | +3.8% | Australia | Supports large-scale production chemicals. |
Go-To-Market and Sales Economics
Green hydrogen chemical suppliers should sell directly to electrolyzer manufacturers, engineering contractors, and project developers rather than relying only on commodity distributors. Installed electrolysis capacity exceeded 4 GW in 2025, while more than 2.5 GW was under construction for 2026 operation. This pipeline supports demand for electrolytes, catalysts, membranes, ionomers, and water-treatment chemicals.
Technical qualification should be organised by electrolyzer chemistry. Alkaline systems require potassium hydroxide electrolyte and nickel-based catalytic materials, while PEM systems depend on specialty polymer membranes, iridium, and platinum. Suppliers should provide application testing, purity certificates, recycling plans, and indexed pricing because performance, durability, and material intensity differ substantially between technologies and operating conditions.
India offers a practical route through local manufacturing partnerships and approved project developers. In February 2026, the government reported incentives covering 3,000 MW of annual electrolyzer manufacturing capacity and green hydrogen awards totalling 862,000 tonnes per year. Local warehousing, technical service, and compliant chemical handling can improve tender eligibility, delivery reliability, and customer conversion.
Risk Factors & Market Barriers
Project delays remain the largest commercial barrier for chemical suppliers. The IEA reported that the announced hydrogen production pipeline for 2030 contracted by 10 million tonnes to 27 million tonnes. More than 100 GW of electrolyzer capacity could miss 2030 operation unless investment decisions are completed before the end of 2027, weakening forecast chemical volumes.
PEM-related revenue is exposed to scarce platinum-group metals. USGS reported 2025 iridium and platinum prices of about USD 4,400 and USD 1,200 per troy ounce, respectively. South Africa produced an estimated 120,000 kilograms of platinum from a global total of 170,000 kilograms, creating concentration, price, and procurement risks for catalyst producers.
Alkaline electrolyzer suppliers also face nickel sourcing volatility. USGS estimated 2025 global nickel mine output at 3.9 million tonnes, including 2.6 million tonnes from Indonesia. Australian production declined 54%, while Philippine output fell 24%. Dual sourcing, recycled content, and price-adjustment clauses are therefore important for protecting catalyst availability and contract margins.
Revenue Potential Analysis
Revenue Landscape Across
China offers scale, while Europe offers higher-value specifications and project spending. The IEA estimated that China represented more than 60% of committed electrolysis capacity in 2026 but only 25% of investment. Europe represented below 20% of capacity and 45% of investment, supporting differentiated opportunities for premium catalysts, membranes, electrolyte management, and technical services.
European public funding is creating a visible chemical demand pipeline. The 2026 European Hydrogen Bank auction selected 13 projects, covering more than 95% of its available budget. The original nine projects are expected to install almost 1.1 GW of electrolyzers and produce over 1.3 million tonnes of renewable hydrogen during their first ten operating years.
Revenue opportunities are concentrated in refining, fertilisers, steel, methanol, and hydrogen-based fuels. Global hydrogen demand exceeded 100 million tonnes in 2025, but low-emissions hydrogen remained close to 1 million tonnes. By the first quarter of 2026, more than 0.3 million tonnes per year had been contracted through procurement tenders, mainly for refining and fertilisers.
Financial Impact
Capital spending creates near-term sales potential for initial electrolyte fills, catalyst-coated components, replacement materials, and purification chemicals. Global investment in low-emissions hydrogen projects is expected to approach USD 10 billion in 2026, with electrolysis accounting for around 70%. Suppliers with qualified products and secured capacity can convert project construction into recurring lifecycle revenue.
Customer affordability will place continuous pressure on chemical usage and pricing. The IEA found that, without policy support, the maximum acceptable low-emissions hydrogen cost remains below USD 2 per kilogram for most sector and regional combinations. Chemical suppliers must therefore improve catalyst loading, membrane durability, electrolyte life, recovery rates, and performance guarantees without increasing total operating cost.
Downstream manufacturer finances affect payment terms and supplier risk. Nel reported first-quarter 2026 revenue of NOK 148 million, an order backlog of NOK 1.113 billion, and negative EBITDA of NOK 100 million. Chemical producers should use milestone billing, credit controls, and diversified customer portfolios because strong backlogs do not automatically translate into positive cash generation.
Drivers Impact Analysis
The Green Hydrogen Production Chemicals Market is driven by rising electrolyzer deployment, clean hydrogen policies, renewable energy expansion, and demand for low-carbon fuels in refining, fertilizers, steel, transport, and power storage. Chemicals used in water treatment, electrolytes, catalysts, membranes, purification, and process conditioning are becoming important for stable hydrogen production.
Asia Pacific leads the market due to strong green hydrogen project pipelines, large renewable power capacity, industrial hydrogen demand, and growing electrolyzer manufacturing. China, India, Japan, South Korea, and Australia remain key contributors because of national hydrogen strategies, export ambitions, and industrial decarbonization programs.
Impact Factor | Estimated CAGR Impact | Regional Relevance | Market Impact |
|---|---|---|---|
Rising electrolyzer installations | +9.0% | Asia Pacific, Europe, North America | Drives core chemical demand. |
Government support for green hydrogen | +7.8% | China, India, Japan, South Korea, Australia | Improves project confidence. |
Renewable energy capacity expansion | +6.6% | Asia Pacific and global markets | Supports clean hydrogen production. |
Industrial decarbonization demand | +5.4% | Steel, refining, chemicals, fertilizer | Adds large end-use demand. |
Growth in hydrogen export projects | +4.5% | Australia, Middle East, Asia Pacific | Builds long-term supply chains. |
Restraints Impact Analysis
The market faces restraints from high green hydrogen production cost, expensive electrolyzer systems, limited water infrastructure, chemical purity requirements, and uncertain project economics. Many green hydrogen plants require high-quality input water, stable chemicals, reliable membranes, and strict operating control.
Another restraint is the early-stage nature of the market. Many announced green hydrogen projects are still in pilot, feasibility, or financing stages, which can delay demand for production chemicals and related consumables.
Impact Factor | Estimated CAGR Impact | Regional Relevance | Market Impact |
|---|---|---|---|
High green hydrogen production cost | -5.0% | Global hydrogen projects | Slows commercial scale-up. |
Expensive electrolyzer systems | -4.4% | Asia Pacific, Europe, North America | Limits faster deployment. |
Water quality and treatment challenges | -3.6% | Dry and industrial regions | Raises operating complexity. |
Project financing uncertainty | -3.0% | Emerging hydrogen markets | Delays chemical demand. |
Strict purity and safety requirements | -2.5% | Electrolyzer and hydrogen plants | Adds quality control burden. |
Opportunities Impact Analysis
Opportunities are strong in alkaline electrolyzer chemicals, PEM electrolyzer materials, catalysts, membranes, water treatment chemicals, purification chemicals, anti-scaling agents, corrosion control chemicals, and process additives. These areas benefit from the need for stable and efficient hydrogen generation.
Higher-value opportunities are emerging in high-purity chemicals, iridium and platinum catalyst optimization, nickel-based catalysts, ion-exchange membranes, deionized water treatment, and chemicals for large-scale electrolyzer plants. Suppliers that support efficiency, durability, and lower operating cost can capture stronger long-term demand.
Impact Factor | Estimated CAGR Impact | Regional Relevance | Market Impact |
|---|---|---|---|
Electrolyzer chemical demand | +8.7% | Asia Pacific, Europe, North America | Builds main opportunity base. |
Water treatment chemical expansion | +7.2% | Industrial and dry regions | Supports plant reliability. |
Catalyst and membrane materials | +6.1% | Advanced electrolyzer markets | Adds high-value demand. |
High-purity process chemicals | +5.0% | Large hydrogen production plants | Improves operating quality. |
Corrosion and scaling control chemicals | +4.2% | Utility-scale hydrogen facilities | Extends equipment life. |
Challenges Impact Analysis
The main challenge is supplying chemicals that can meet strict purity, stability, and performance standards across different electrolyzer technologies. Alkaline, PEM, solid oxide, and anion exchange membrane systems each require different chemical inputs and operating conditions.
Another challenge is building reliable supply chains for critical materials. Catalyst metals, membranes, specialty polymers, and high-purity chemicals need consistent sourcing, quality testing, and cost control to support large-scale hydrogen production.
Impact Factor | Estimated CAGR Impact | Regional Relevance | Market Impact |
|---|---|---|---|
Meeting high-purity standards | -4.8% | Electrolyzer chemical suppliers | Affects plant efficiency. |
Critical material supply constraints | -4.0% | Global specialty chemical markets | Raises cost and sourcing risk. |
Technology-specific chemical needs | -3.4% | PEM, alkaline, solid oxide systems | Adds product complexity. |
Scaling production consistency | -2.8% | Asia Pacific and Europe | Impacts commercial delivery. |
Long validation and qualification cycles | -2.2% | Hydrogen project developers | Slows supplier adoption. |
Segment Covered in the Report
By Chemical Type
Catalysts
Electrolytes
Membranes & Ion Exchange Materials
Water Treatment Chemicals
Gas Purification Chemicals
By Production Technology
Alkaline Electrolysis
Proton Exchange Membrane Electrolysis
Solid Oxide Electrolysis
Photoelectrochemical Water Splitting
Thermochemical Processes
By End Use Industry
Industrial Processing
Electronics
By Region
North America
Europe
Asia Pacific
Latin America
Middle East and Africa
Market Trend Analysis
The market trend is moving toward high-purity electrolyzer chemicals, advanced catalysts, durable membranes, low-cost alkaline systems, PEM performance materials, and integrated water treatment solutions. Green hydrogen developers are focusing on lowering production cost while improving electrolyzer uptime and efficiency.
Asia Pacific remains the largest value region because of strong electrolyzer manufacturing, renewable power expansion, and large industrial hydrogen demand. Europe and North America are also growing through hydrogen hubs, clean fuel policies, and investment in low-carbon industrial projects.
Impact Factor | Estimated CAGR Impact | Regional Relevance | Market Impact |
|---|---|---|---|
High-purity chemical adoption rises | +8.4% | Asia Pacific, Europe, North America | Improves hydrogen plant performance. |
Advanced catalyst development grows | +7.0% | Japan, South Korea, China, Europe | Supports electrolyzer efficiency. |
Water treatment integration expands | +5.8% | Large hydrogen projects | Improves system reliability. |
Alkaline electrolyzer chemical use increases | +4.9% | China, India, Australia | Supports scalable production. |
PEM material demand strengthens | +4.1% | Japan, South Korea, Europe, U.S. | Adds premium chemical value. |
Investor Type Impact Matrix
Investors should focus on chemical companies with strong high-purity production capability, electrolyzer supplier relationships, water treatment expertise, catalyst materials, and membrane technology. Product reliability, purity control, cost efficiency, and project qualification are key success factors.
Strategic investors can also target catalyst developers, membrane suppliers, ion-exchange resin makers, industrial water treatment firms, specialty chemical producers, and hydrogen plant service providers. Companies that reduce electrolyzer operating cost and improve hydrogen output quality are better positioned for long-term growth.
Investor Type | Estimated CAGR Impact | Regional Relevance | Market Impact |
|---|---|---|---|
Electrolyzer Chemical Suppliers | +7.4% | Global green hydrogen markets | Expands core chemical supply. |
Catalyst Material Companies | +6.2% | Asia Pacific, Europe, North America | Supports efficiency improvement. |
Membrane and Polymer Suppliers | +5.1% | PEM and advanced electrolyzer systems | Adds premium material value. |
Water Treatment Chemical Providers | +4.3% | Large hydrogen production plants | Improves plant reliability. |
Strategic Hydrogen Infrastructure Investors | +3.6% | Asia Pacific, Europe, North America | Funds scale and supply localization. |
Recent Developments
In February 2026, Nel reported a NOK 878 million PEM electrolyzer backlog after securing its largest order, a 40 MW contract exceeding USD 50 million, strengthening its containerized green-hydrogen equipment business.
In November 2025, Ohmium achieved an iridium-utilization rate of 18 GW per tonne in its Lotus Mark 2 PEM electrolyzer, reducing iridium use by 50% and lowering dependence on scarce catalyst metals.
In February 2025, Enapter received 5.5 MW of AEM electrolyzer orders from four Italian companies, supporting renewable refuelling, industrial production and deployment across ten government-backed Hydrogen Valley projects in Italy.
Competitive Landscape
The market is characterized by intense competition among established players and emerging companies. Strategic partnerships, mergers and acquisitions, and product innovation are key strategies employed by market participants.
Key Market Players
Air Liquide S.A.
Air Products and Chemicals, Inc.
Linde plc
Siemens Energy AG
thyssenkrupp nucera
Johnson Matthey
Nel Hydrogen
Plug Power Inc.
Bloom Energy Corporation
Cummins Inc.
Topsoe A/S
DuPont
Solvay S.A.
Chemours Company
3M
Other Key Players
Research Methodology
This market study is prepared using a combination of primary and secondary research. Primary research includes discussions with manufacturers, suppliers, distributors, consultants, industry experts, and end users. Secondary research covers company reports, government databases, trade associations, technical publications, regulatory sources, and trusted industry documents. The collected information is used to assess market demand, pricing trends, technology adoption, competitive activity, and regional performance.
AI language models are not used as primary data sources, and publicly available AI-generated content is not treated as market evidence. Computational tools may be used to support data processing, translation, data classification, and pattern identification. However, every published assessment is supported by verified sources, human review, and primary market discussions.
Market estimates are developed through top-down and bottom-up approaches and validated using data triangulation. Revenue, production, shipment, pricing, and application-level data are compared across multiple sources. Forecasts consider economic conditions, regulatory changes, investment activity, innovation, supply chain developments, and industry risks. All findings are reviewed through source verification and internal quality checks before publication.
Part I
Source Management & Input Data Standards
Who provides data, how sources are qualified, and what types of evidence are admissible.
Part II
Research Scope & Market Coverage
How we define the markets we assess and the parameters that govern each product.
Part III
Data Collection, Verification & Submission
The mechanics of gathering, cross-checking, and hierarchically ranking evidence.
Part IV
Assessment Determination & Quality Controls
How raw data becomes a published assessment — normalisation, expert judgement, and outlier exclusion.
Part V
Publication, Corrections & Revision
Our publication schedule, corrections policy, and methodology review cycle.
Part VI
Independence, Ethics & Complaints
Conflict-of-interest policies, editorial independence, and how clients raise concerns.
Google · Preferred Sources
Don't miss the latest market research insights and industry updates on Google.
Add Globe Market Research as a preferred source in the Google app to see our reports, analysis, and market stories in your news suggestions.
Meet the Team
This report was prepared by our expert analysts with deep industry knowledge and research experience.
Pratiksha K. is a Senior Research Analyst with more than five years of experience in market research, industry analysis, competitive intelligence, and business strategy. She has contributed to detailed market reports, customized research studies, company profiling, market sizing, trend analysis, and strategic consulting projects for clients across different regions. Her industry expertise covers Chemical and Material, Consumer Goods, Food & Beverages and Energy & Power. She closely evaluates changing customer requirements, technology developments, regulatory conditions, supply chain structures, investment activity, and competitive strategies to provide clear and practical market insights.
Sayali brings more than 7 years of experience to Globe Market Research, supporting the accuracy, clarity, and relevance of research content across multiple industries. She reviews market data, segment analysis, competitive insights, and industry trends to ensure each report meets strong quality standards and provides practical value to business decision-makers. Her expertise spans healthcare, information technology, consumer goods, and diverse cross-industry domains. With a strong focus on data reliability, structured analysis, and clear presentation, Sayali helps ensure that each research output delivers well-reviewed insights for clients, investors, consultants, and industry stakeholders.
Frequently Asked Questions
Related Reports
More in Chemical and Material
Sulfuric Acid Market to Hit USD 61.5 Billion by 2035
Sulfuric Acid Market Size, Share, Analysis By Raw Material (Elemental Sulfur, Base Metal Smelters, Pyrite Ore, Others), By Application (Fertilizers, Chemical Manufacturing, Metal Processing, Petroleum Refining, Textile, Automotive, Pulp and Paper, Others), By Distribution Channel (Direct Sales, Distributors), By Regional Insights, Business plan and Project Report, Investment Opportunities, Profitability, Industry Trends, Leading Companies and Growth Forecasts by 2026-2035
Powder Metallurgy Market to Hit USD 17.0 Billion by 2035
Powder Metallurgy Market Size, Share, Analysis By Material (Ferrous Metals, Non-Ferrous Metals, Others), By Process (Additive Manufacturing, Powder Metal Hot Isostatic Pressing, Conventional Powder Metallurgy), By Application (Automotive, Aerospace and Defense, Healthcare, Electrical and Electronics, Industrial Machinery, Others) , By Regional Insights, Business plan and Project Report, Investment Opportunities, Profitability, Industry Trends, Leading Companies and Growth Forecasts by 2026-2035
Bromine Market to Hit USD 1.5 Billion by 2035
Bromine Market Size, Share, Analysis By Derivative (Organobromine, Clear Brine Fluids, Hydrogen Bromide, Others), By Application (Flame Retardants, Oil and Gas Drilling, Biocides, PTA Synthesis, Plasma Etching, Pharmaceuticals, Energy Storage, Others), By End-Use Industry (Chemicals, Oil and Gas, Pharmaceuticals, Electrical and Electronics, Automotive, Agriculture, Others), By Regional Insights, Business plan and Project Report, Investment Opportunities, Profitability, Industry Trends, Leading Companies and Growth Forecasts by 2026-2035
Hydrogen Cyanide Market to Hit USD 5.95 Billion by 2035
Hydrogen Cyanide Market Size, Share, Analysis By Product Form (Hydrogen Cyanide Liquid, Hydrogen Cyanide Gas), By Application (Adiponitrile, Acetone Cyanohydrin, Sodium Cyanide and Potassium Cyanide, Methionine, Cyanuric Chloride, Others), By End-Use Industry (Chemicals, Mining and Metallurgy, Pharmaceuticals, Agriculture, Textiles, Others), By Regional Insights, Business plan and Project Report, Investment Opportunities, Profitability, Industry Trends, Leading Companies and Growth Forecasts by 2026-2035