

Revenue, 2025
$361.2Bn
Forecast, 2035
$1,411.2Bn
CAGR, 2025-2035
14.6%
Report Coverage
Global
Market Size and Forecast
2025
$361.2Bn
2035
$1,411.2Bn
CAGR
14.6%
The Sharing Economy Apps Market covers digital platforms that allow users to access rides, homes, vehicles, tools, services, freelance work, and local tasks without owning the asset directly. The market is estimated at USD 361.2 billion in 2025 and is projected to reach USD 1,411.2 billion by 2035, growing at around 14.6% CAGR. The model is supported by high smartphone use, secure digital payments, user reviews, location tracking, and real-time matching between supply and demand. In 2025, about 6 billion people, or nearly 74% of the global population, were using the internet, which shows the large digital base available for app-based sharing services.
Sharing economy apps are becoming important because they reduce the need for asset ownership and make underused resources commercially useful. Consumers use these apps for lower cost, faster access, flexible booking, and wider service choice. Providers use them to earn income from cars, rooms, equipment, time, skills, and local services. The market is also supported by digital financial access, as 79% of adults globally now have an account, while 84% of adults in low and middle income countries own a mobile phone and 3 billion have smartphones.
Key Market Insights - 2025 Share
Shared transportation led the product segment with 29.90% share in 2025, supported by rising use of ride-sharing, bike-sharing, carpooling, and short-distance mobility services.
Online platforms dominated the channel segment with 81.3% share, driven by easy app-based booking, secure digital payments, real-time availability, and location-based service access.
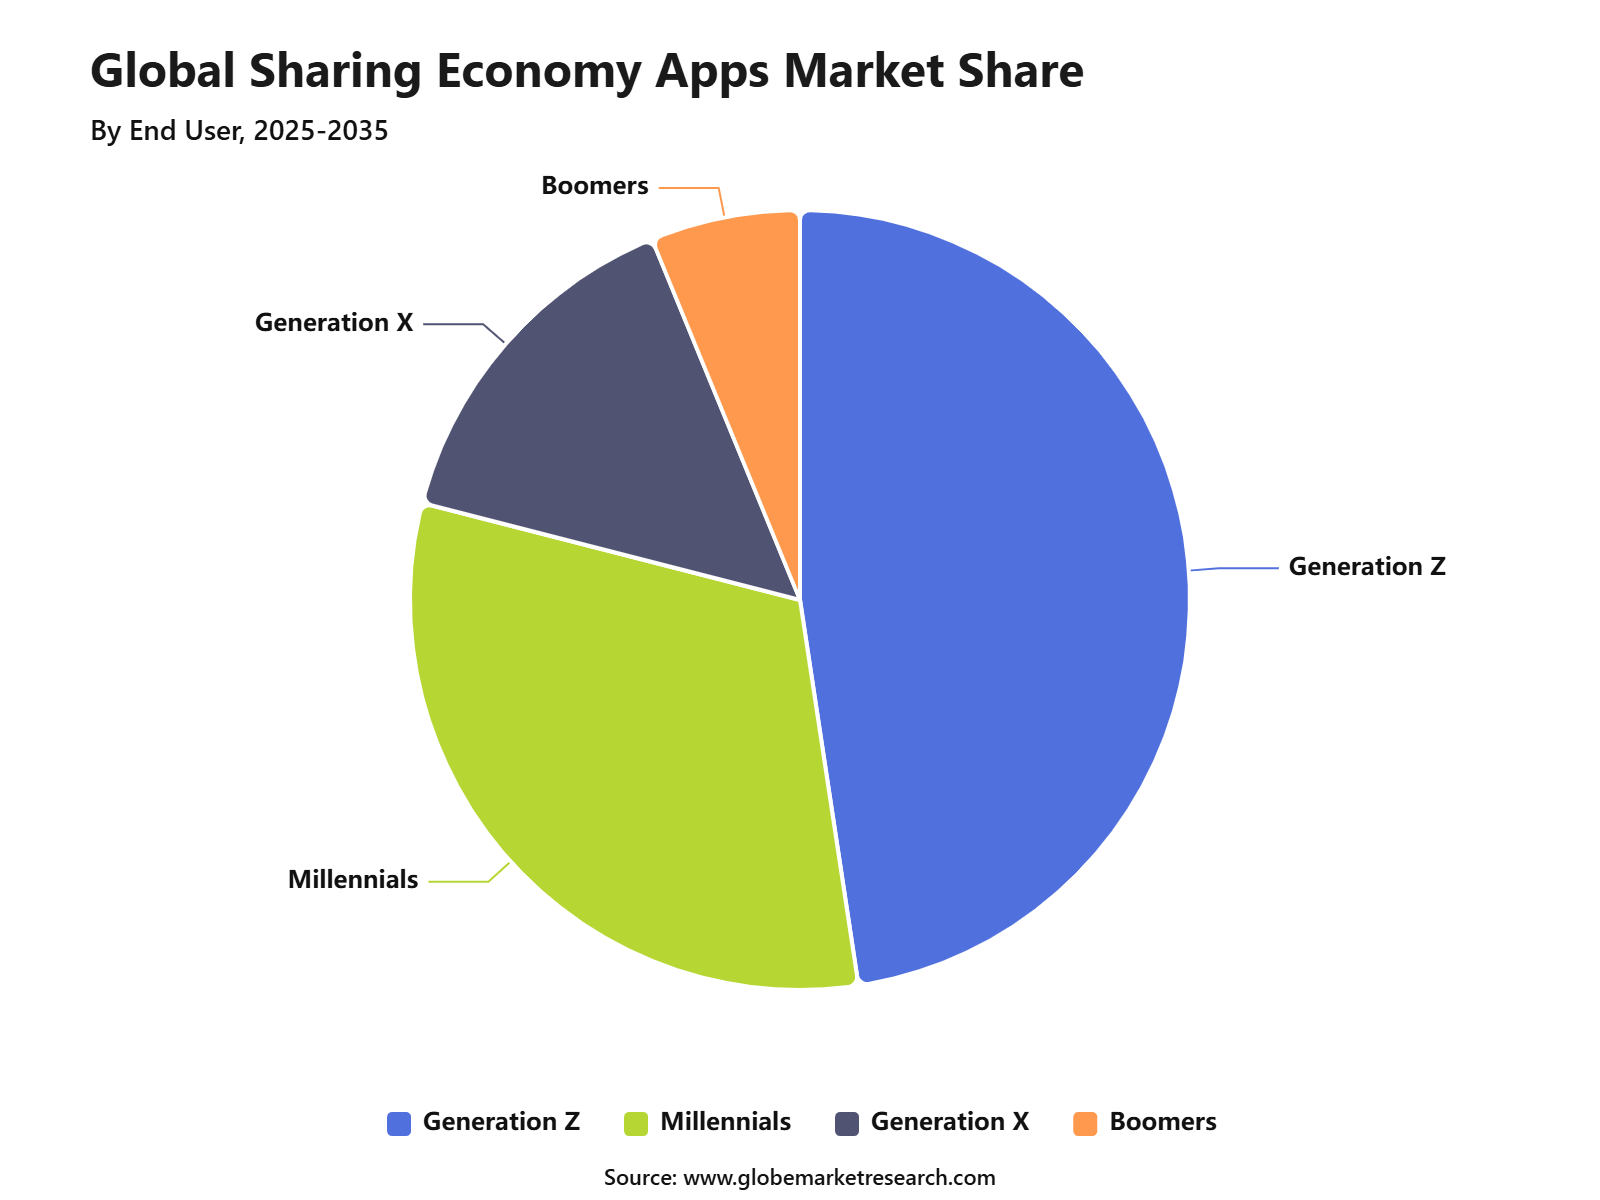
Generation Z r epresented the leading end-user group with 47.6% share, supported by strong mobile usage, preference for flexible access, and higher adoption of app-based services.
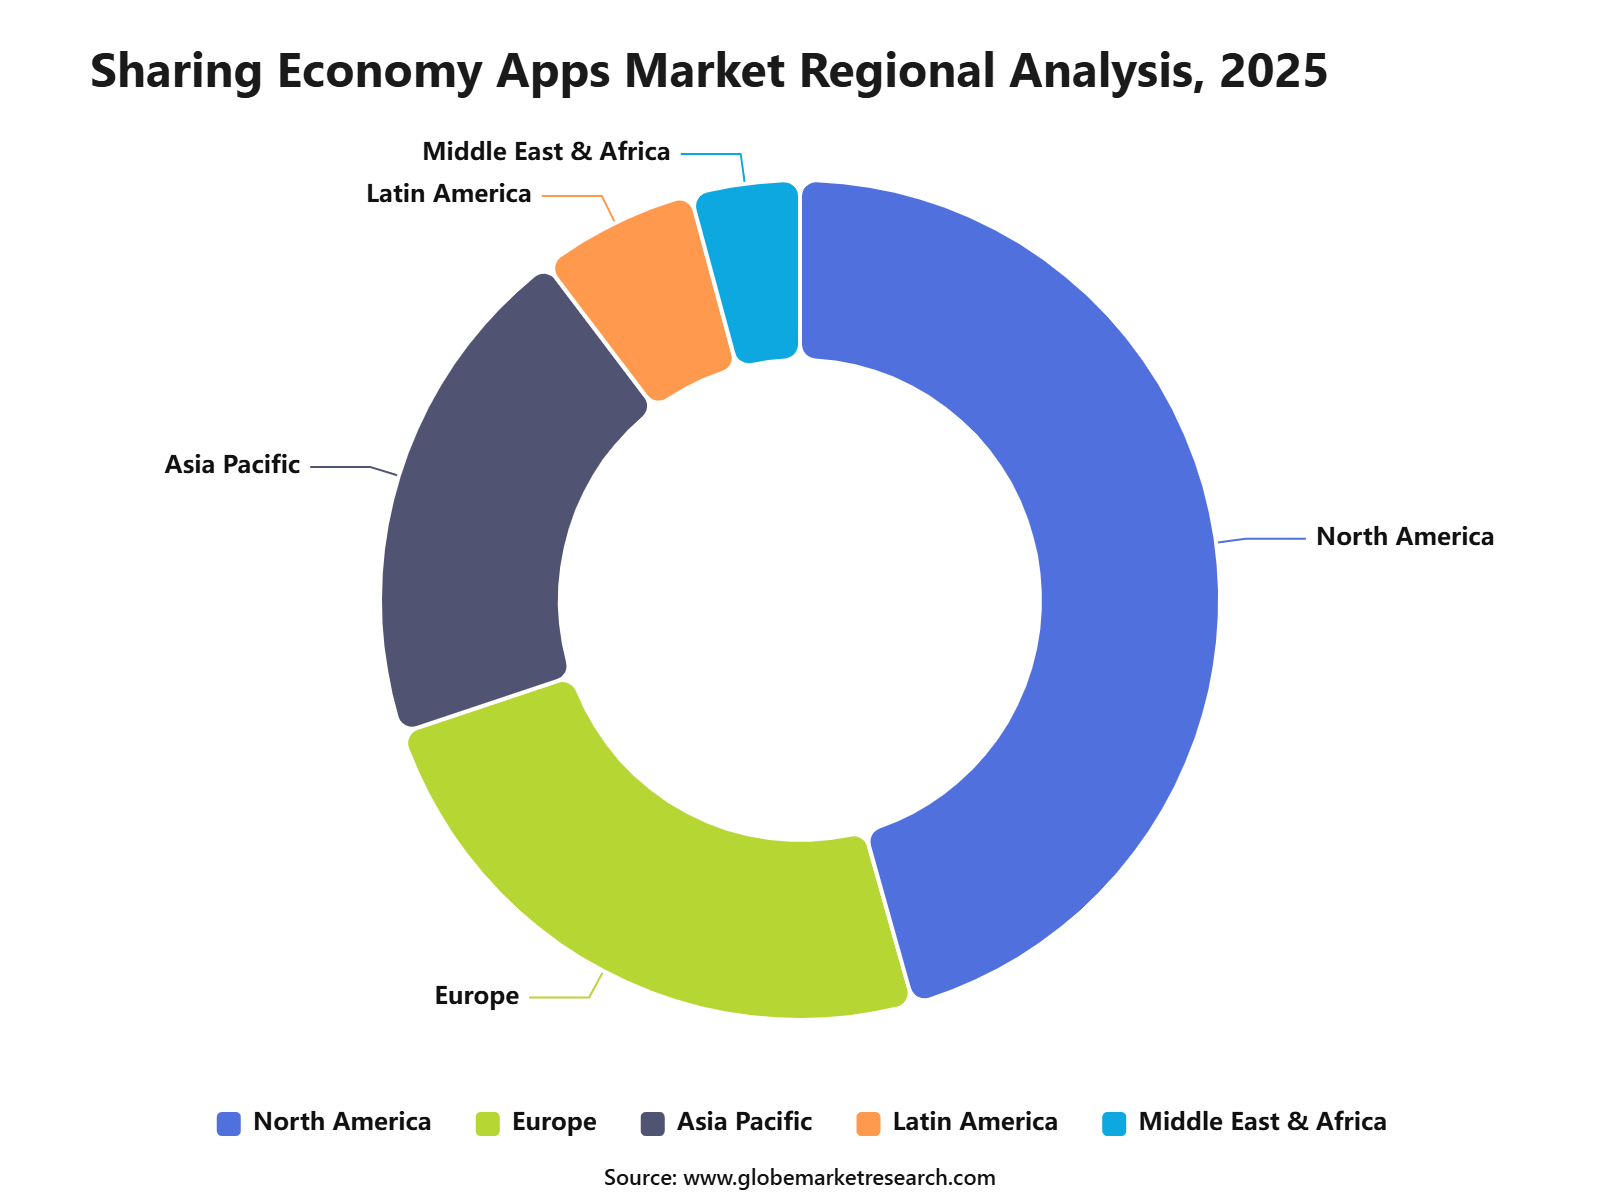
North America held 45.67% share of the sharing economy apps market, supported by high smartphone penetration, strong platform adoption, and mature digital payment infrastructure.
Airbnb reported strong Q4 2025 growth, with revenue up 12%, Gross Booking Value up 16%, and Nights and Seats Booked up 10% year over year.
Uber reported USD 193.45 billion in full-year 2025 gross bookings and USD 52.02 billion in revenue. This confirms scale, but not total market share.
Lyft reported USD 18.5 billion in full-year 2025 gross bookings, USD 6.3 billion in revenue, 945.5 million rides, and 51.3 million annual riders.
DoorDash reported 903 million Q4 2025 orders and USD 29.68 billion in Q4 Marketplace GOV. It also exited 2025 with more than 56 million monthly active users.
Market Overview
The growth of the sharing economy apps market can be attributed to rising internet access, wider smartphone penetration, higher use of digital payments, and consumer preference for access-based services. Mobile connectivity has become a strong foundation for this market, as GSMA reported 5.8 billion unique mobile subscribers in 2026, equal to around 70% of the global population. This connected base supports on-demand booking, digital identity checks, in-app payments, ratings, route tracking, and instant communication.
Demand for sharing economy apps is being supported by convenience, affordability, time savings, and real-time service availability. Users prefer platforms that allow them to compare prices, check reviews, confirm availability, and complete payments within one app. In Q4 2025, Uber had 202 million monthly active platform consumers, up 18% year over year, while quarterly trips increased 22% to 3.75 billion . This shows that repeated usage is becoming stronger, not only first-time adoption.
Investment opportunities are strongest in shared transportation, short-term accommodation, peer-to-peer rentals, delivery-linked local commerce, business travel management, and service marketplaces. Shared transportation remains a high-value area, supported by the 2025 estimate that this segment accounted for 29.90% of the market. Based on the USD 361.2 billion market size, this indicates an estimated shared transportation opportunity of about USD 108.0 billion in 2025. Continued growth in ride sharing, car-pooling, micro-mobility, EV fleets, and autonomous vehicle partnerships can support future revenue expansion.
 iThe graph shows projected market growth until 2035 based on CAGR analysis. Actual outcomes may vary depending on changing demand, competition, and economic factors.To gain greater insights - request a sample report PDF
Revenue Potential Analysis
Revenue potential in the Sharing Economy Apps Market is created through commissions, booking fees, service fees, subscription plans, advertising, premium listings, insurance products, payments, and partner services. Mobility platforms generate revenue from ride commissions, delivery fees, fleet partnerships, and subscription-based user benefits. Accommodation platforms earn through guest and host service fees, experience bookings, and travel-related add-ons. Service marketplaces generate revenue from project fees, freelancer commissions, client subscriptions, enterprise tools, and AI-based productivity services.
The strongest revenue upside is expected in high-frequency use cases. Transportation, delivery, and local services benefit from repeat demand, while accommodation and peer-to-peer rental benefit from higher transaction values. Turo reported 5.5 million trips, 26.6 million trip days, and USD 1.4 billion in host earnings in the United States during 2025. This shows that asset-sharing platforms can create meaningful income for individual asset owners while reducing idle asset value loss.
Revenue Landscape Across Key App Models
The revenue landscape is shifting from single-service apps to multi-service ecosystems. Large platforms are adding new categories such as grocery, retail, travel experiences, advertising, membership programs, AI support, and business tools. DoorDash ended 2025 with more than 56 million monthly active users and more than 35 million paid membership users across DashPass, Wolt+, and Deliveroo Plus. This indicates that subscription-led retention is becoming an important revenue layer for sharing economy platforms.
Revenue is also being shaped by regional expansion and platform localization. Airbnb stated that its expansion markets grew at roughly twice the rate of its core markets in 2025, while India became one of its fastest-growing origin countries, with nights booked up 50% year over year. This reflects a strong opportunity in emerging travel and urban consumer markets. As app-based payments, smartphone access, digital identity, and AI-based recommendations improve, more demand is expected to move from informal channels to structured platforms.
Financial Impact
The financial impact of sharing economy apps extends beyond platform revenue. These apps support host income, driver earnings, merchant sales, local tourism, flexible work, and consumer savings. Airbnb stated that hosts and guests generated more than USD 93 billion in economic activity across the United States in 2025 and supported more than 1.1 million jobs. The platform also reported that typical U.S. hosts earned about USD 15,600 in supplemental income during 2025.
The market also has a strong labor and income-generation role. The EU estimated that platform workers would rise from over 28.1 million in 2022 to 43.2 million by 2025, showing the growing role of app-based work in employment systems. The World Bank estimated that there were 154.2 million to 435.3 million online gig workers globally, with online gig work accounting for up to 12% of the global labor force. This supports long-term demand for apps that connect users with flexible labor, local services, and digital work opportunities.
Product Segment Insights
Shared transportation led the Sharing Economy Apps Market with a 29.90% share in 2025, supported by strong adoption of ride-hailing, carpooling, bike-sharing, e-scooter sharing, and short-distance mobility services. The segment’s growth can be attributed to rising urban travel demand, higher traffic congestion, and the need for lower-cost mobility alternatives. In Q4 2025, Uber recorded 3.8 billion trips, reflecting 22% year-on-year growth, which shows the continued strength of app-based shared transportation services.
Shared micromobility has also gained strong traction, with e-scooter systems in the U.S. and Canada recording 69 million trips in 2023, up 15% from the previous year. The segment is further supported by consumers who prefer access over ownership, especially in large cities where vehicle ownership is costly. Shared transportation apps reduce the need for fuel expenses, parking, insurance, and vehicle maintenance. In North America, shared bike and scooter systems have remained important for first-mile and last-mile transport, while ride-hailing platforms continue to serve daily commuting, airport transfers, and flexible urban travel.
Channel Insights
Online platforms dominated the Sharing Economy Apps Market with an 81.3% share in 2025, as most sharing-based services are now booked, paid for, reviewed, and managed through mobile apps or web platforms. The growth of this channel can be attributed to real-time availability, digital payments, user ratings, identity verification, location tracking, and instant booking features. Airbnb reported 533.0 million Nights and Seats Booked in 2025 and USD 91.3 billion in gross booking value, which shows how digital platforms are supporting large-scale sharing transactions.
The company also reported that app-based nights booked accounted for 63% of total nights booked in Q1 2026, up from 58% a year earlier. Online platforms are also preferred because they create trust between users and service providers through ratings, reviews, secure payments, cancellation policies, and customer support. This has made the online channel important across shared transportation, home sharing, equipment rental, peer-to-peer rental, food delivery, freelance services, and resale platforms. The 81.3% share shows that the market is largely digital-first, with offline channels playing a smaller role.
End User Insights
Generation Z accounted for the largest end-user share at 47.6% in 2025, driven by strong use of mobile apps, digital payments, rental services, resale platforms, and subscription-based access models. This consumer group is more comfortable using platforms for transport, accommodation, fashion rental, peer-to-peer services, and flexible work opportunities. Deloitte’s 2025 Gen Z and Millennial Survey covered more than 23,000 respondents and found that more than half of Gen Zs and millennials live paycheck to paycheck. This financial pressure supports higher interest in affordable, flexible, and low-commitment services instead of full ownership.
Generation Z users are also more open to shared access because they value convenience, lower upfront costs, and flexible usage. Many younger users prefer renting a vehicle, booking a shared stay, using resale platforms, or accessing services on demand rather than purchasing assets permanently. This behavior has helped sharing economy apps become part of daily consumer activity among younger age groups. The 47.6% share indicates that Gen Z is not only a user base but also a key demand driver for future platform growth.
 iThe graph shows projected market growth until 2035 based on CAGR analysis. Actual outcomes may vary depending on changing demand, competition, and economic factors.To gain greater insights - request a sample report PDF
Regional Insights
North America held the leading regional share of 45.6% in 2025, supported by high smartphone usage, advanced payment systems, strong platform penetration, and early adoption of shared mobility and home-sharing services. The region has a mature ecosystem for ride-hailing, short-term rentals, bike-sharing, scooter-sharing, freelance platforms, and peer-to-peer rental apps. North America’s leadership can also be linked to strong consumer trust in app-based ratings, verified profiles, cashless payments, and platform support systems.
The U.S. and Canada have large urban populations that use shared transportation for commuting, short-distance travel, and flexible mobility. Shared micromobility adoption has also expanded in the region, with Canada recording a 40% rise in shared micromobility trips in 2023. These factors have helped North America maintain the largest share in the Sharing Economy Apps Market in 2025.
 iThe graph shows projected market growth until 2035 based on CAGR analysis. Actual outcomes may vary depending on changing demand, competition, and economic factors.To gain greater insights - request a sample report PDF
Regional Impact Analysis
Impact Factor | Estimated CAGR Impact | Regional Relevance | Market Impact |
|---|---|---|---|
North America market leadership | +4.1% | U.S. and Canada | Leads platform revenue. |
Asia Pacific rapid expansion | +3.8% | China, India, Japan, Southeast Asia | Drives user growth. |
Europe regulated sharing economy growth | +3.0% | UK, Germany, France, Spain | Supports structured adoption. |
Latin America emerging adoption | +2.1% | Brazil, Mexico, Chile, Colombia | Builds digital rental demand. |
Middle East and Africa early growth | +1.8% | UAE, Saudi Arabia, South Africa, Nigeria | Shows future potential. |
Drivers Impact Analysis
Impact Factor | Estimated CAGR Impact | Regional Relevance | Market Impact |
|---|---|---|---|
Rising adoption of app-based shared services | +3.8% | North America, Europe, Asia Pacific | Expands platform usage. |
Growth in shared transportation demand | +3.5% | U.S., China, India, Europe | Drives core revenue. |
Increasing smartphone and internet penetration | +3.1% | Asia Pacific, Latin America, MEA | Improves user access. |
Rising preference for asset-light lifestyles | +2.8% | Urban global markets | Reduces ownership need. |
Expansion of digital payments and in-app verification | +2.6% | Global | Builds transaction trust. |
Restraints Impact Analysis
Impact Factor | Estimated CAGR Impact | Regional Relevance | Market Impact |
|---|---|---|---|
Regulatory restrictions on platform operations | -2.0% | U.S., Europe, Asia Pacific | Limits market expansion. |
Trust and safety concerns | -1.8% | Global | Slows user adoption. |
Platform fee sensitivity | -1.4% | Price-sensitive markets | Affects repeat usage. |
Worker classification and labor issues | -1.5% | U.S., Europe, Australia | Raises compliance pressure. |
Competition from traditional service providers | -1.2% | Global | Pressures platform margins. |
Opportunities Impact Analysis
Impact Factor | Estimated CAGR Impact | Regional Relevance | Market Impact |
|---|---|---|---|
Growth in peer-to-peer rental models | +3.4% | North America, Europe, Asia Pacific | Opens new revenue streams. |
Expansion of shared mobility services | +3.2% | U.S., Europe, China, India | Supports urban transport demand. |
Rising adoption in emerging economies | +2.9% | India, Brazil, Indonesia, Africa | Creates new user growth. |
Integration of insurance-backed services | +2.5% | North America, Europe, Asia Pacific | Improves platform trust. |
Growth in subscription-based sharing models | +2.3% | Urban global markets | Supports recurring revenue. |
Challenges Impact Analysis
Impact Factor | Estimated CAGR Impact | Regional Relevance | Market Impact |
|---|---|---|---|
Fraud and user verification risks | -1.8% | Global | Affects platform trust. |
Regulatory variation across cities | -1.7% | North America, Europe, Asia Pacific | Creates compliance complexity. |
Asset damage and liability issues | -1.5% | Global | Raises operating cost. |
Supply-demand imbalance | -1.2% | Emerging markets | Reduces service reliability. |
Data privacy and cybersecurity concerns | -1.4% | Global | Increases security burden. |
Segments Covered in the Report
By Product / Service Type
Shared Transportation
Shared Space
Sharing Financial
Sharing Food
Shared Healthcare
Shared Knowledge & Education
Shared Task Services
Shared Items
Others
By Distribution Channel
Online
Offline
By End User
Generation Z
Millennials
Generation X
Boomers
By Region
North America
Europe
Asia-Pacific
Latin America
Middle East and Africa
Market Trend Analysis
Impact Factor | Estimated CAGR Impact | Regional Relevance | Market Impact |
|---|---|---|---|
Mobile-first platform adoption | +3.7% | Global | Improves booking convenience. |
Growth of shared transportation platforms | +3.4% | North America, Europe, Asia Pacific | Leads usage volume. |
Rise of short-term rental services | +3.0% | U.S., Europe, Asia Pacific | Strengthens transaction value. |
AI-based matching and dynamic pricing | +2.6% | North America, Europe, China, India | Improves platform efficiency. |
Sustainability-driven sharing models | +2.2% | Europe, North America, urban Asia | Supports eco-conscious usage. |
Investment Opportunity Analysis
Impact Factor | Estimated CAGR Impact | Regional Relevance | Market Impact |
|---|---|---|---|
Shared mobility platforms | +3.5% | U.S., Europe, China, India | Offers strong transaction growth. |
Peer-to-peer rental apps | +3.2% | North America, Europe, Asia Pacific | Expands asset monetization. |
Insurance and protection services | +2.7% | Global | Improves user confidence. |
AI-enabled platform management tools | +2.5% | Global | Enhances operational efficiency. |
Emerging market platform expansion | +2.8% | India, Brazil, Southeast Asia, Africa | Builds long-term user growth. |
Recent Developments
May 2026 - Airbnb expanded its app with car rentals, grocery delivery, airport pickups, luggage storage, boutique hotels, and FIFA World Cup 2026 Experiences. The rollout included grocery delivery in more than 25 U.S. cities, airport pickups in over 160 cities, and luggage storage at more than 15,000 locations.
May 2026 - Getaround Europe and GoMore merged to create one of Europe’s largest peer-to-peer car-sharing networks. The combined platform serves more than 5 million users across 11 countries, with over 70,000 shared vehicles and around 1.5 million rentals per year.
April 2026 - Vinted reported strong 2025 performance in the second-hand marketplace segment. Gross merchandise value rose 47% to EUR 10.8 billion, while revenue increased 38% to EUR 1.1 billion. This reflects rising demand for app-based resale and circular commerce models.
March 2025 - Pickle, a peer-to-peer fashion rental app, raised USD 12 million in Series A funding. Total funding reached USD 20 million. The company is using the funding to expand its clothing rental marketplace across major U.S. cities.
Report Scope
Report Highlights | Details |
|---|---|
Market Revenue (2025) | USD 361.2 Bn |
Forecast Revenue (2035) | USD 1,411.2 Bn |
CAGR (2025-2035) | 14.6% |
Base Year for Estimation | 2025 |
Historic Data | 2020-2024 |
Forecast Period | 2025-2035 |
Report Coverage | AI market impact analysis, Market surveys, trade analysis, Industry & competitive intelligence, Revenue projections, company positioning, competitive analysis, growth drivers, and emerging market trends, Strategic Consultation & Advisory Services |
Segments Covered | By Product / Service Type (Shared Transportation, Shared Space, Sharing Financial, Sharing Food, Shared Healthcare, Shared Knowledge & Education, Shared Task Services, Shared Items, Others), By Distribution Channel (Online, Offline), By End User (Generation Z, Millennials, Generation X, Boomers) |
Regional Analysis | North America - US, Canada; Europe - Germany, France, The UK, Spain, Italy, Russia, Netherlands, Rest of Europe; Asia Pacific - China, Japan, South Korea, India, New Zealand, Singapore, Thailand, Vietnam, Rest of Latin America; Latin America - Brazil, Mexico, Rest of Latin America; Middle East & Africa - South Africa, Saudi Arabia, UAE, Rest of MEA |
Key companies profiled | Uber Technologies, Inc., Airbnb, Inc., Lyft, Inc., DoorDash, Inc., Upwork Inc., Fiverr International Ltd., Turo Inc., TaskRabbit, Instacart, Deliveroo, Bolt Technology, BlaBlaCar, DiDi Global Inc., Rapido, Swiggy, Zomato, Thumbtack, Rover, Freelancer.com , Gojek |
Customization Scope | Tailored insights for specific regions, countries, and market segments can be provided. Additional report customization is available upon request. |
Competitive Landscape
The market is characterized by intense competition among established players and emerging companies. Strategic partnerships, mergers and acquisitions, and product innovation are key strategies employed by market participants.
Key Market Players
Uber Technologies, Inc
Airbnb, Inc.
Lyft, Inc.
DoorDash, Inc.
Upwork Inc.
Fiverr International Ltd.
Turo Inc.
TaskRabbit
Instacart
Deliveroo
Bolt Technology
BlaBlaCar
DiDi Global Inc.
Rapido
Swiggy
Zomato
Thumbtack
Other Key Players
Meet the Team
This report was prepared by our expert analysts with deep industry knowledge and research experience.
Pratiksha is market research analyst with strong experience in industry research, market forecasting, and competitive analysis. She specializes in identifying market trends, evaluating growth opportunities, and preparing data-driven insights across global industries. Her work supports businesses in understanding market dynamics, customer demand, regional opportunities, and strategic investment areas.
Suraj is a Senior Management Consultant with over 7 years of experience in market research, business strategy, and consulting. He has worked with Fortune 500 companies and growing startups, helping them with market entry, cross-border expansion, demand analysis, competitive assessment, and growth planning. His analytical thinking and strong industry knowledge help clients make clear, confident, and informed business decisions.
Frequently Asked Questions
Related Reports
More in Information and Technology
Operating Room Integration Market to hit USD 10.3 Bn by 2035
Global Operating Room Integration Market Size, Share Report By Component (Software, Hardware, Services), By Device Type (Audio and Video Management Systems, Display Systems, Others), By Application (General Surgery, Orthopedic Surgery, Others), By End User (Hospitals, Ambulatory Surgical Centers, Specialty Clinics), By Deployment Mode On-premise, Cloud-based, Hybrid), By Operating Room Type (Hybrid Operating Rooms, Integrated Operating Rooms), By Technology (Surgical Workflow Integration, Image and Video Integration, Others), By Regional (North America, Europe, Asia Pacific, Others), By Regional Insights, Business plan and Project Report, Investment Opportunities, Profitability, Industry Trends, Leading Companies and Growth Forecasts by 2025-2035
AI Receptionist Market to hit USD 23.8 Bn by 2035
Global AI Receptionist Market Size, Share Analysis Report By Component (Solutions, Services), By Deployment (Cloud-based, On-premises), By Service Type (Voice Reception Services, Chat Reception Services, Appointment Scheduling, Call Routing, Lead Qualification, Customer Support), By Service Model (24/7 Receptionist Solutions, Business Hours Receptionist Solutions, Hybrid Receptionist Solutions), By Technology (Voice AI Integration, Conversational AI, Natural Language Processing, Speech Recognition and Others), By Enterprise Size (Small and Medium Enterprises, Large Enterprises), By End-use (Healthcare, Legal Services, Real Estate, Retail and E-commerce, BFSI, Hospitality, Automotive, Home Services, IT and Telecom, Others), By Regional Insights, Business plan and Project Report, Investment Opportunities, Profitability, Industry Trends, Leading Companies and Growth Forecasts by 2025-2035
Voice AI Agents Market to Hit USD 113.7 Billion by 2035
Global Voice AI Agents Market Size, Share Analysis Report By Solution (Voice AI Platform, Services (Professional Services(Implementation & Integration, Consulting & Training Services, Support and Maintenance Services), Managed Services)), By Deployment (Cloud Based, On Premises), By Enterprise Size (Small & Medium Enterprise Size, Large Enterprises), By Industry (BFSI, Automotive, Healthcare, Retail & E-commerce, IT & Telecom, Aerospace & Defence, Others (Utilities, Media & Entertainment)), By Regional Insights, Business plan and Project Report, Investment Opportunities, Profitability, Industry Trends, Leading Companies and Growth Forecasts by 2025-2035
AI Trust, Risk and Security Management (AI TRiSM) Market to hit USD 39.8 Bn by 2026
Global AI Trust, Risk and Security Management (AI TRiSM) Market Size, Share Analysis Report By Component (Solutions, Services), By Technology (ML based TRiSM, Natural Language Processing based TRiSM, Explainable AI (XAI), Federated Learning/Privacy-Preserving ML), By Application (Model Governance & Compliance, Model Monitoring & Observability, Data Privacy & Security, Bias Detection & Mitigation, Identity & Access Security for AI), By Deployment (On-premises, Cloud), By Organization Size (Large Enterprises, Small & Medium Enterprises), By Industry Vertical (BFSI, Healthcare, Retail & E-commerce, IT & Telecom, Government & Defense, Manufacturing, Transportation & Logistics), By Regional Insights, Business plan and Project Report, Investment Opportunities, Profitability, Industry Trends, Leading Companies and Growth Forecasts by 2025-2035