

Revenue, 2025
$ 85.1 Bn
Forecast, 2035
$ 136.0 Bn
CAGR, 2025-2035
4.8%
Report Coverage
Global
Market Size and Forecast
The Global Ammonia Market was worth USD 85.1 billion in 2025 and is expected to reach USD 136.0 billion by 2035, growing at a CAGR of 4.8% from 2025 to 2035. Asia Pacific held the largest regional share of 57.8% in 2025, supported by strong fertilizer production, large agricultural demand, expanding chemical manufacturing, and high consumption across China, India, Japan, South Korea, and Southeast Asia.
The Ammonia Market includes the production and use of ammonia as a key chemical for fertilizers, industrial chemicals, refrigeration, pharmaceuticals, textiles, and cleaning applications. It is mainly used to produce urea, ammonium nitrate, ammonium sulfate, nitric acid, and other nitrogen-based compounds. The market is closely linked with natural gas supply, hydrogen production, agricultural output, industrial processing, and global food security needs.
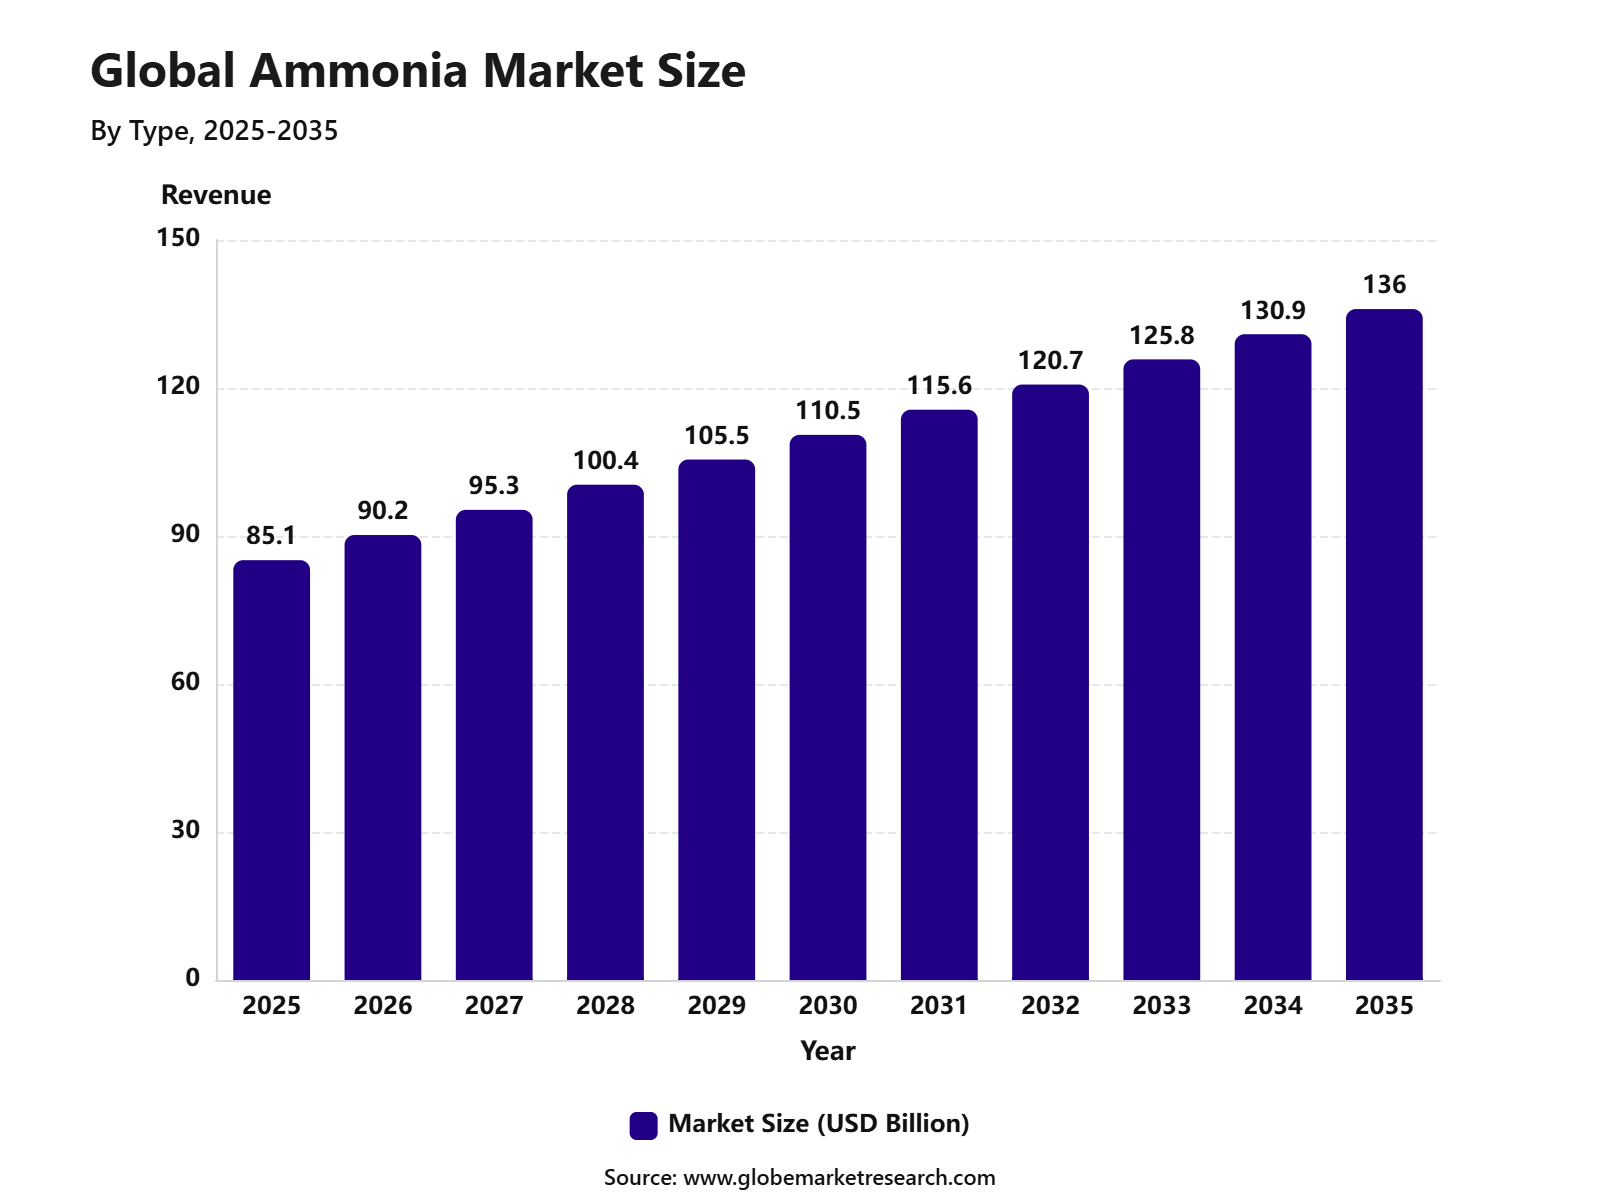 iThe graph shows projected market growth until 2035 based on CAGR analysis. Actual outcomes may vary depending on changing demand, competition, and economic factors.To gain greater insights - request a sample report PDF
The market outlook remains steady as ammonia continues to play an important role in crop nutrition and industrial chemical production. Growth can be attributed to rising food demand, increasing fertilizer use, expanding agricultural activity, and wider interest in low-carbon ammonia for energy and shipping applications. The development of green ammonia projects, improved production efficiency, and stronger demand for nitrogen fertilizers are expected to support long-term market growth.
Key Market Insights
Anhydrous ammonia led the type segment with 61.1% share, supported by its high nitrogen content, strong use in fertilizer production, and wide adoption across agricultural applications.
Direct sales accounted for 68.6% share, driven by bulk procurement from large agricultural buyers, fertilizer producers, and industrial users requiring stable ammonia supply.
Agriculture held 82.1% share by end-use industry, supported by strong demand for nitrogen-based fertilizers used to improve crop yield and soil nutrient availability.
Asia Pacific led the ammonia market with 57.8% share, supported by large agricultural activity, strong fertilizer consumption, expanding chemical production, and high demand from China, India, and Southeast Asia.
Top Funding and Investment Highlights
Hyphen Hydrogen Energy’s Namibia project has a total planned capital investment of over USD 10.0 billion and is designed to cut 5.0 to 6.0 million tonnes of CO₂ emissions annually. The project is positioned as a large green hydrogen and green ammonia export platform. The African Development Bank also approved a USD 10.0 million loan to support project preparation work.
NEOM Green Hydrogen Company achieved financial close on a project with a total investment value of USD 8.4 billion. The project includes USD 6.1 billion in non-recourse financing from 23 banks and financial institutions, along with a USD 6.7 billion EPC agreement with Air Products. It is being built to produce green ammonia at scale in 2026.
CF Industries, JERA, and Mitsui announced a low-carbon ammonia project at Blue Point, Louisiana, with an estimated facility cost of about USD 4.0 billion. The plant is planned with 1.4 million metric tonnes per year of ammonia capacity, while CF Industries will invest another USD 550.0 million in storage, loading, and support infrastructure.
Reliance Industries signed a binding long-term supply and purchase agreement with Samsung C&T for green ammonia supply over 15 years. The agreement is valued at more than USD 3 billion and will begin in the second half of FY2029. This supports Reliance’s green ammonia scale-up and gives long-term demand visibility.
Woodside Energy acquired OCI’s clean ammonia project in Beaumont, Texas, for USD 2.35 billion. The project has planned capacity of 1.1 MTPA and is targeting first ammonia production from the second half of 2025. Lower-carbon ammonia production is targeted from the second half of 2026, linked with carbon capture infrastructure.
Yamna signed an MoU with the Government of Andhra Pradesh to develop a green hydrogen and ammonia project with an estimated investment of about INR 16,000 crore, equal to roughly USD 2.0 billion. The project is planned with up to 1 MTPA green ammonia capacity near Krishnapatnam port and is expected to create around 5,500 direct and indirect jobs.
Jordan Green Ammonia is developing a green hydrogen and ammonia production plant at the Port of Aqaba with stated capex of USD 1.6 billion. The project is planned to produce 100,000 tonnes per year of green ammonia, with investment start-up in 2024 and operation start-up targeted for 2029
Go-To-Market Startagy
The Ammonia Market should be positioned through fertilizer producers, farm distributors, industrial chemical buyers, mining explosives users, refrigeration operators, and low-carbon fuel developers in 2026. Ammonia demand remains strongly tied to agriculture because about 88% of U.S. domestic ammonia production is used for fertilizers, including anhydrous ammonia, urea, ammonium nitrate, ammonium phosphates, and other nitrogen compounds.
Go-to-market planning should focus on long-term offtake contracts, reliable logistics, storage safety, and feedstock-secure production. USGS reported that ammonia was produced by 18 companies at 38 plants across 19 U.S. states in 2025. About 57% of U.S. ammonia capacity was concentrated in Louisiana, Oklahoma, and Texas due to natural gas access.
Product positioning should also include low-carbon ammonia for future industrial and marine applications. IEA states that ammonia production accounts for around 2% of global final energy consumption and 1.3% of energy-system CO₂ emissions. This creates a clear commercial case for green ammonia, blue ammonia, carbon capture integration, and renewable hydrogen-linked production.
Revenue Potential Analysis
Revenu landscape Across
Revenue opportunities are strongest across anhydrous ammonia, urea, ammonium nitrate, ammonium sulfate, nitric acid, ammonium phosphates, explosives, plastics, synthetic fibers, resins, and industrial chemicals. USGS estimated U.S. ammonia production at 14,000 thousand metric tons on a nitrogen-content basis in 2025, while apparent consumption reached 15,000 thousand metric tons.
Global revenue concentration is expected to remain strong in fertilizer-producing and agriculture-heavy countries. USGS estimated world ammonia production at 160,000 thousand metric tons on a nitrogen-content basis in 2025. China led with 49,000 thousand metric tons, followed by India and Russia at 15,000 thousand metric tons each, showing Asia’s strategic demand base.
The revenue landscape is also widening through low-carbon ammonia and energy transition applications. FAO-linked analysis states that about 80% of global ammonia supply, equal to nearly 152 million tonnes, is processed into fertilizers. Future demand can also come from clean shipping fuel, hydrogen transport, power generation trials, and decarbonized industrial feedstocks.
Financial Impact
The financial impact in 2026 will depend on gas prices, plant utilization, nitrogen fertilizer prices, trade flows, and regional production costs. USDA AMS reported Illinois distributor anhydrous ammonia at an average of USD 1,133.50 per ton for the week ending June 12, 2026, showing strong cost pressure during the planting season.
Margins can improve for producers with natural gas access, integrated ammonia-urea assets, export terminals, and long-term fertilizer customers. USGS reported that U.S. active ammonia plants operated at about 80% of rated capacity in 2025. Higher utilization can reduce unit cost, but outages, port limits, and gas disruptions can quickly reduce financial performance.
Capital planning is becoming more complex because low-carbon ammonia requires electrolysers, renewable power, carbon capture, storage access, certification, and new safety systems. Companies that secure clean energy, government incentives, storage infrastructure, and creditworthy buyers may improve long-term returns. However, conventional producers must still manage price volatility, compliance cost, and farmer affordability pressure.
Type Analysis
Anhydrous ammonia led the Ammonia Market with 61.1% share, supported by its high nitrogen content and wide use in fertilizer production. It is used directly as a nitrogen fertilizer in some farming systems and also serves as a key input for urea, ammonium nitrate, ammonium sulfate, and other nitrogen-based fertilizers.
The growth of this segment can be attributed to rising demand for high-efficiency nitrogen sources in agriculture. Anhydrous ammonia is preferred in large-scale farming because it provides concentrated nitrogen and supports crop productivity when applied under controlled conditions.
Anhydrous ammonia is expected to remain the leading type as food production demand and fertilizer use continue to support nitrogen consumption. However, safe storage, transport, and application will[object Object],[object Object],[object Object],[object Object] remain important because the product requires pressurized handling and strict safety practices.
Sales Channel Analysis
Direct sales accounted for 68.6% share of the Ammonia Market, supported by large-volume supply agreements between producers, fertilizer manufacturers, agricultural distributors, chemical companies, and industrial buyers. This channel is preferred because ammonia is commonly traded in bulk and requires specialized handling, storage, and logistics.
The dominance of direct sales can be linked to the need for stable supply, pricing visibility, and long-term procurement planning. Fertilizer plants and industrial users often depend on direct contracts to secure consistent ammonia availability for seasonal and continuous production needs.
Direct sales are expected to remain the leading sales channel because ammonia buyers usually require large quantities and reliable delivery schedules. The channel will remain important for fertilizer manufacturing, agricultural supply chains, refrigeration, chemical production, and industrial processing.
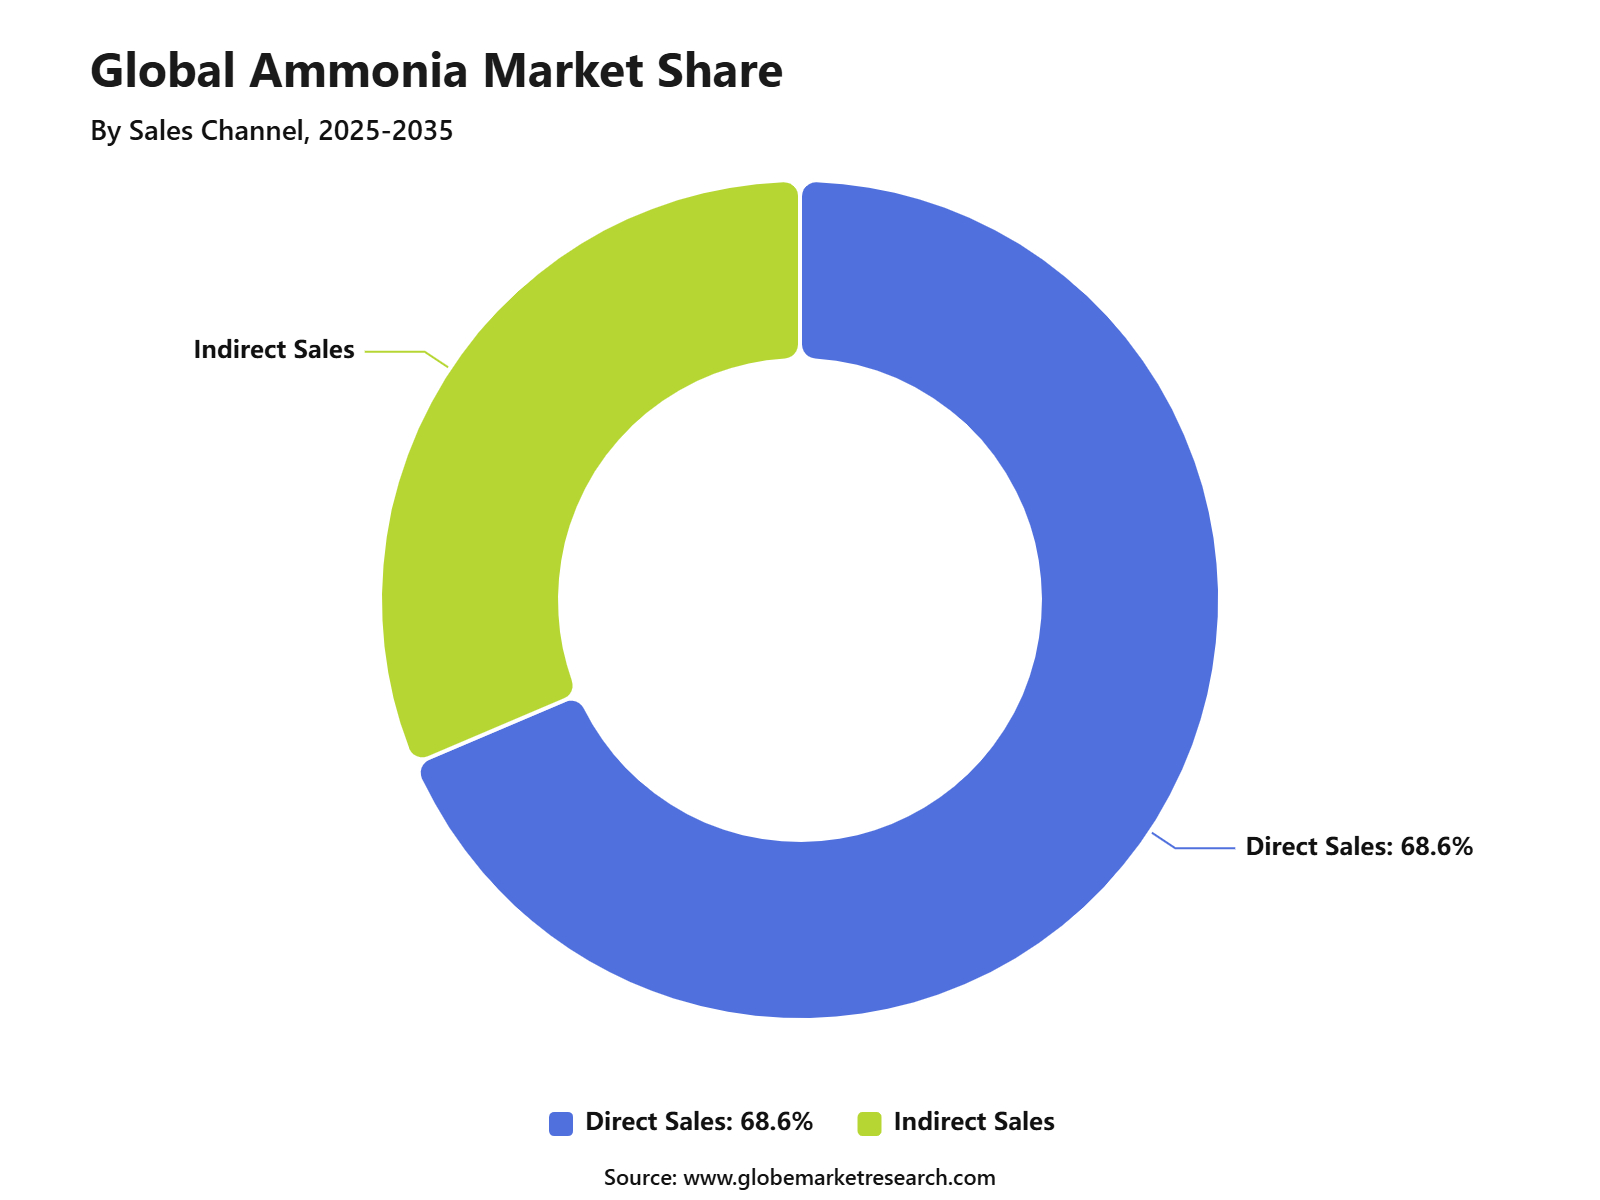 iThe graph shows projected market growth until 2035 based on CAGR analysis. Actual outcomes may vary depending on changing demand, competition, and economic factors.To gain greater insights - request a sample report PDF
End-Use Industry Analysis
Agriculture led the end-use industry segment with 82.1% share, supported by ammonia’s central role in nitrogen fertilizer production. Nitrogen is essential for crop growth, and ammonia is one of the most important base chemicals used to produce fertilizers that improve yield across cereals, oilseeds, fruits, vegetables, and other crops.
The growth of this segment is being driven by the need to improve farm productivity and support global food security. Ammonia-based fertilizers are widely used because they help restore soil nitrogen and support higher crop output from limited agricultural land.
Agriculture is expected to remain the largest end-use industry as fertilizer demand stays closely linked with population growth, food consumption, and crop intensification. Demand will remain strong across major farming regions where nitrogen application is needed to support grain, corn, wheat, rice, and oilseed production.
Regional Analysis
Asia Pacific led the Ammonia Market with 57.8% share, supported by large agricultural production, high fertilizer consumption, strong chemical manufacturing, and major ammonia-producing economies. China and India remain important contributors due to their large farming bases and strong demand for nitrogen fertilizers.
The region’s dominance can be attributed to high crop production needs, rising food demand, and continued investment in fertilizer manufacturing capacity. Ammonia is also used across industrial applications, including chemicals, refrigeration, textiles, and pharmaceuticals, which adds further demand support.
Asia Pacific is expected to remain the leading regional market because agriculture continues to be a major ammonia consumption area. Future opportunities are likely to remain strong in anhydrous ammonia, urea production, fertilizer manufacturing, direct sales cntracts, and lower-carbon ammonia production technologies.
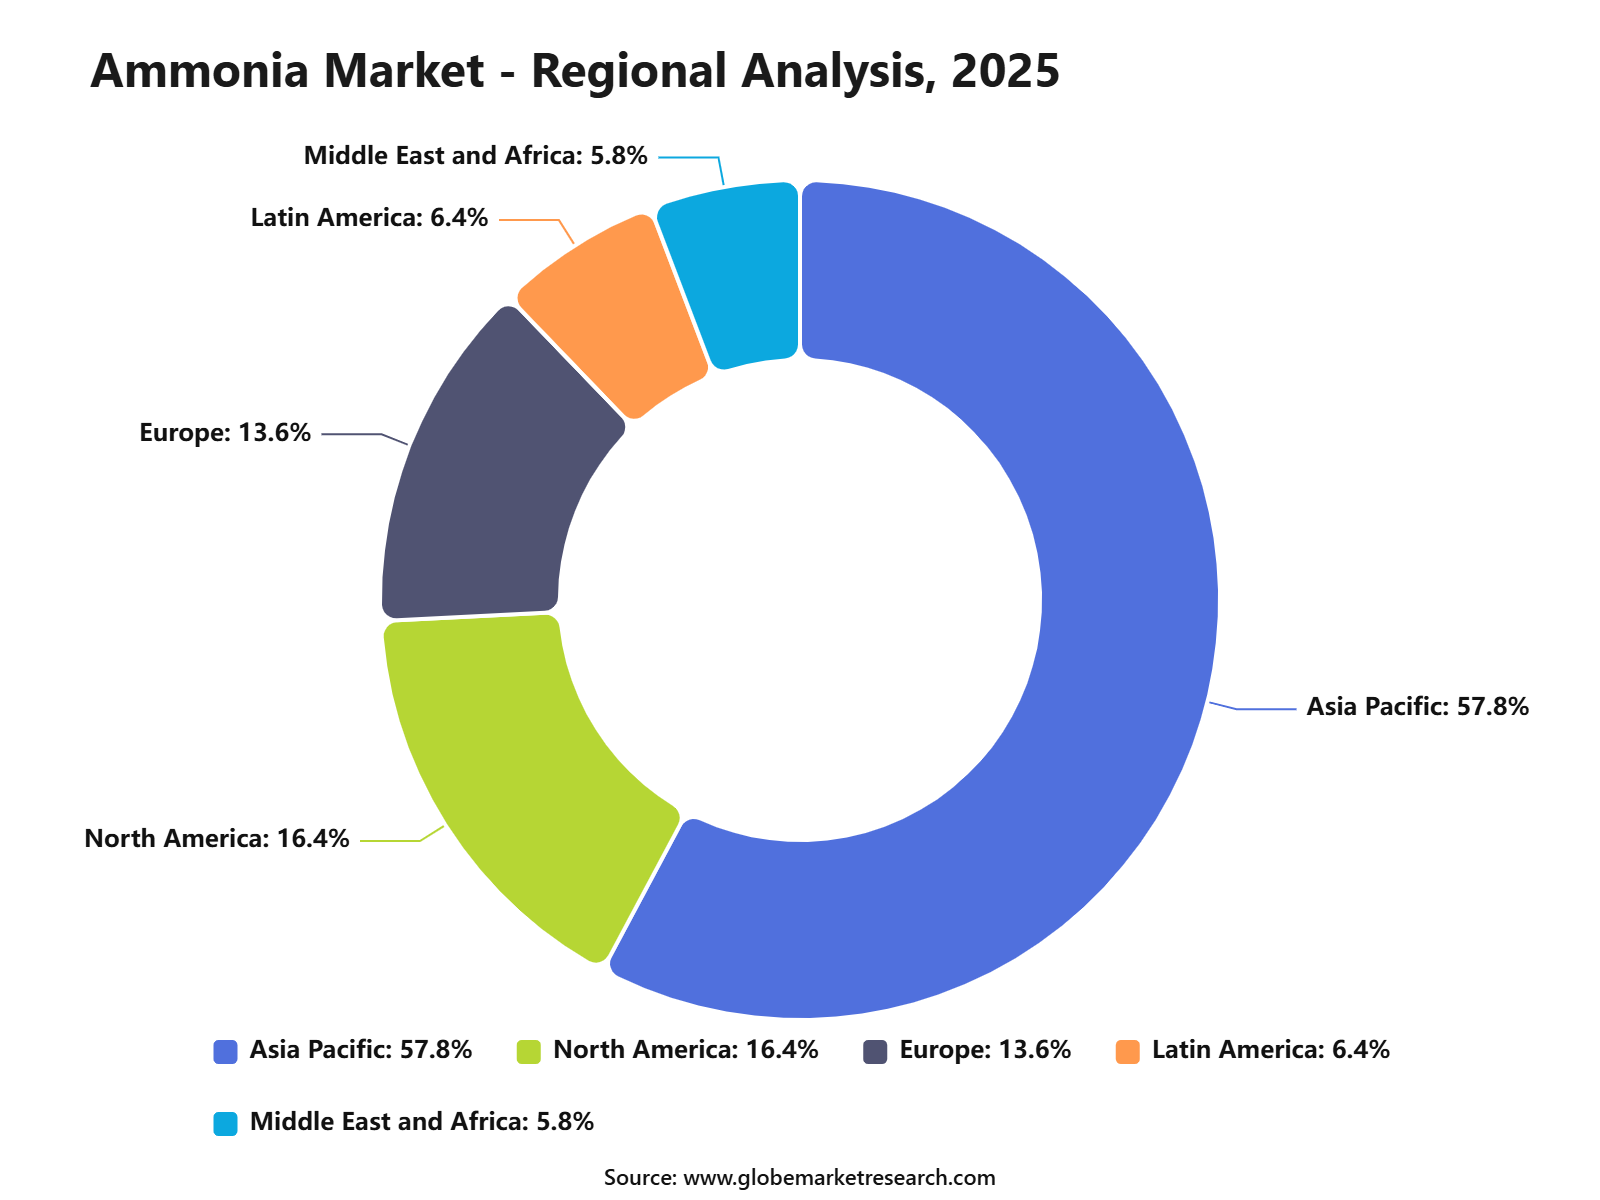 iThe graph shows projected market growth until 2035 based on CAGR analysis. Actual outcomes may vary depending on changing demand, competition, and economic factors.To gain greater insights - request a sample report PDF
Regional Impact Analysis
Impact Factor | Estimated CAGR Impact | Regional Relevance | Market Impact |
|---|---|---|---|
Asia Pacific market leadership | +2.0% | Asia Pacific, 57.8% share in 2025 | Leads fertilizer demand. |
China and India agriculture demand | +1.3% | China, India | Drives volume growth. |
North America anhydrous ammonia use | +0.8% | U.S. and Canada | Supports bulk fertilizer demand. |
Europe low-carbon ammonia shift | +0.7% | Germany, Netherlands, Norway, UK | Supports cleaner production. |
Middle East export capacity growth | +0.6% | Saudi Arabia, UAE, Qatar, Oman | Strengthens trade supply. |
Market Trend Analysis
Impact Factor | Estimated CAGR Impact | Regional Relevance | Market Impact |
|---|---|---|---|
Anhydrous ammonia leads product demand | +1.2% | Asia Pacific, North America | Supports fertilizer use. |
Agriculture remains dominant end use | +1.1% | Global farming regions | Drives market stability. |
Direct sales remain preferred channel | +0.9% | Bulk fertilizer and industrial buyers | Improves supply efficiency. |
Green ammonia investment increases | +0.8% | Europe, Japan, Australia, Middle East | Supports energy transition. |
Ammonia fuel trials gain attention | +0.6% | Maritime and power sectors | Builds future demand. |
Investor Type Impact Matrix
Investor Type | Estimated CAGR Impact | Regional Relevance | Market Impact |
|---|---|---|---|
Ammonia Producers | +1.1% | Global | Expands production capacity. |
Fertilizer Companies | +1.0% | Asia Pacific, Latin America, Africa | Drives direct consumption. |
Energy and Hydrogen Investors | +0.8% | Europe, Middle East, Japan | Supports green ammonia. |
Industrial Chemical Companies | +0.7% | Asia Pacific, North America, Europe | Expands downstream use. |
Infrastructure and Logistics Investors | +0.6% | Global ammonia trade hubs | Improves supply movement. |
Segment Covered in the Report
By Type
Anhydrous Ammonia
Aqueous Ammonia
By Sales Channel
Direct Sales
Indirect Sales
By End-Use Industry
Agriculture
Textile
Refrigeration
Mining
Pharmaceutical
Others
By Region
North America
Europe
Asia Pacific
Latin America
Middle East and Africa
Drivers Impact Analysis
Impact Factor | Estimated CAGR Impact | Regional Relevance | Market Impact |
|---|---|---|---|
Rising fertilizer demand | +1.3% | Asia Pacific, Latin America, Africa | Drives core consumption. |
Growth in agricultural production | +1.1% | China, India, Southeast Asia, Brazil | Supports crop input use. |
Strong use of anhydrous ammonia | +0.9% | North America, Asia Pacific | Builds fertilizer demand. |
Expansion of industrial chemical production | +0.8% | Asia Pacific, Europe, North America | Supports downstream use. |
Rising food security focus | +0.7% | Emerging agricultural economies | Increases nutrient demand. |
Restraints Impact Analysis
Impact Factor | Estimated CAGR Impact | Regional Relevance | Market Impact |
|---|---|---|---|
Volatile natural gas prices | -0.8% | Europe, Asia Pacific, North America | Pressures production cost. |
Carbon emission concerns | -0.7% | Europe, U.S., Japan, South Korea | Raises compliance burden. |
Safety risks in handling and transport | -0.6% | Global | Limits operational flexibility. |
Fertilizer price sensitivity | -0.5% | Emerging farming regions | Affects farmer purchases. |
Strict environmental regulations | -0.4% | Developed markets | Increases operating cost. |
Opportunities Impact Analysis
Impact Factor | Estimated CAGR Impact | Regional Relevance | Market Impact |
|---|---|---|---|
Green ammonia production | +1.2% | Europe, Japan, Australia, Middle East | Supports low-carbon growth. |
Ammonia as clean fuel carrier | +1.0% | Japan, South Korea, Europe | Opens energy applications. |
Expansion of direct sales channels | +0.9% | Asia Pacific, North America | Improves bulk supply. |
Fertilizer capacity additions | +0.8% | India, China, Brazil, Africa | Builds stable demand. |
Demand from refrigeration and chemicals | +0.6% | Global industrial markets | Expands non-fertilizer use. |
Challenges Impact Analysis
Impact Factor | Estimated CAGR Impact | Regional Relevance | Market Impact |
|---|---|---|---|
Reducing production emissions | -0.7% | Global producers | Requires cleaner technology. |
Managing feedstock supply risk | -0.6% | Gas-dependent regions | Affects output stability. |
Safe storage and logistics | -0.5% | Global ammonia trade routes | Raises safety requirements. |
Balancing fertilizer affordability | -0.5% | Asia Pacific, Africa, Latin America | Impacts farm demand. |
Scaling green ammonia economically | -0.4% | Europe, Middle East, Australia | Slows early adoption. |
Recent Developments
In April 2026, Yara reported Q1 EBITDA excluding special items of USD 896.0 million, up from USD 638.0 million. The company noted stronger nitrogen margins and flexibility to source ammonia globally during supply disruptions.
In May 2026, CF Industries reported Q1 gross ammonia production of about 2.5 million tons, equal to 99% utilization of available gross ammonia capacity. Full-year 2026 production is expected near 9.5 million tons.
Report Scope
Report Highlights | Details |
|---|---|
Market Revenue (2025) | USD 85.1 Billion |
Forecast Revenue (2035) | USD 136.0 Billion |
CAGR (2025-2035) | 4.8% |
Base Year for Estimation | 2025 |
Historic Data | 2020-2024 |
Forecast Period | 2025-2035 |
Report Coverage | AI market impact analysis, market surveys, trade analysis, Industry & competitive intelligence, Revenue projections, company positioning, competitive analysis, growth drivers, and emerging market trends, Strategic Consultation & Advisory Services |
Segments Covered | By Type (Anhydrous Ammonia, Aqueous Ammonia), By Sales Channel (Direct Sales, Indirect Sales), By End-Use Industry (Agriculture, Textile, Refrigeration, Mining, Pharmaceutical, Others) |
Regional Analysis | North America - US, Canada; Europe - Germany, France, The UK, Spain, Italy, Russia, Netherlands, Rest of Europe; Asia Pacific - China, Japan, South Korea, India, New Zealand, Singapore, Thailand, Vietnam, Rest of Latin America; Latin America - Brazil, Mexico, Rest of Latin America; Middle East & Africa - South Africa, Saudi Arabia, UAE, Rest of MEA |
Key companies profiled | Yara International ASA, CF Industries Holdings, Inc., Nutrien Ltd., OCI N.V., Koch Fertilizer, Acron Group, SABIC, Qatar Fertiliser Company, Togliattiazot, Sumitomo Chemical Co., Ltd. |
Customization Scope | Tailored insights for specific regions, countries, and market segments can be provided. Additional report customization is available upon request. |
Competitive Landscape
The market is characterized by intense competition among established players and emerging companies. Strategic partnerships, mergers and acquisitions, and product innovation are key strategies employed by market participants.
Key Market Players
Yara International ASA
CF Industries Holdings, Inc
Nutrien Ltd.
OCI N.V.
Koch Fertilizer
Acron Group
SABIC
Qatar Fertiliser Company
Togliattiazot
Sumitomo Chemical Co., Ltd.
Other Key Players
Meet the Team
This report was prepared by our expert analysts with deep industry knowledge and research experience.
Pratiksha is market research analyst with strong experience in industry research, market forecasting, and competitive analysis. She specializes in identifying market trends, evaluating growth opportunities, and preparing data-driven insights across global industries. Her work supports businesses in understanding market dynamics, customer demand, regional opportunities, and strategic investment areas.
Sayali brings more than 5 years of experience to Globe Market Research, supporting the accuracy, clarity, and relevance of research content across multiple industries. She reviews market data, segment analysis, competitive insights, and industry trends to ensure each report meets strong quality standards and provides practical value to business decision-makers. Her expertise spans healthcare, information technology, consumer goods, and diverse cross-industry domains. With a strong focus on data reliability, structured analysis, and clear presentation, Sayali helps ensure that each research output delivers well-reviewed insights for clients, investors, consultants, and industry stakeholders.
Frequently Asked Questions
Related Reports
More in Chemical and Material
Carbon Capture Chemicals Market Size to Reach USD 78.0 Billion by 2035
Carbon Capture Chemicals Market By Chemical Type (Amines, Carbonates, Ammonia-based Solvents, Ionic Liquids, Solid Sorbent Chemicals, Others), By Absorption Type (Chemical Absorption, Physical Absorption), By End-Use Industry (Oil and Gas, Power Generation, Chemical and Petrochemical, Cement, Iron and Steel, Others), By Application (Post-combustion Capture, Pre-combustion Capture, Industrial Gas Separation, Direct Air Capture, Others), By Regional Insights, Business plan and Project Report, Investment Opportunities, Profitability, Industry Trends, Leading Companies and Growth Forecasts by 2025-2035
Bio-based Chemicals Market Size to Hit USD 296.7 Bn by 2035
Bio-based Chemicals Market By Product Category (Platform Chemicals, Polymers for Plastics, Paints, Coatings, Inks and Dyes, Surfactants, Cosmetics and Personal Care Products, Adhesives, Man-made Fibers, Others), By Application (Industrial, Agricultural, Pharmaceutical, Others), By Source (Plant-based, Animal-based, Microbial-based, Waste-based), By End Use (Chemical Manufacturing, Agriculture, Food and Beverage, Personal Care, Pharmaceuticals, Automotive), By Regional Insights, Business plan and Project Report, Investment Opportunities, Profitability, Industry Trends, Leading Companies and Growth Forecasts by 2025-2035
Hydrogen Processing Chemicals Market Size to Hit USD 14.6 Billion by 2035
Hydrogen Processing Chemicals Market By Chemical Type (Catalysts, Adsorbents, Solvents, Corrosion Inhibitors, Scavengers, Others), By Function (Reforming Chemicals, Purification Chemicals, Hydroprocessing Chemicals, Gas Treatment Chemicals, Corrosion Control Chemicals, Others), By Process (Steam Methane Reforming, Hydrocracking, Hydrotreating, Pressure Swing Adsorption, Water-Gas Shift Reaction, Others), By End Use (Refineries, Ammonia Production, Methanol Production, Petrochemicals, Clean Hydrogen Plants, Others), By Regional Insights, Business plan and Project Report, Investment Opportunities, Profitability, Industry Trends, Leading Companies and Growth Forecasts by 2025-2035
Electrolyte Chemicals Market to Cross USD 49.4 Billion by 2035
Electrolyte Chemicals Market By Battery Type (Lithium-ion Electrolytes, Lead-acid Electrolytes, Flow Battery Electrolytes, Others), By Electrolyte Form (Liquid Electrolytes, Gel, Solid-State Electrolytes), By Application (Electric Vehicles, Energy Storage Systems, Consumer Electronics, Industrial and Motive Batteries, Others), By Product Type (Lithium-Based Electrolytes, Sulfide-Based Electrolytes, Polymer-Based Electrolytes, Oxide-Based Electrolytes, Others), By Regional Insights, Business plan and Project Report, Investment Opportunities, Profitability, Industry Trends, Leading Companies and Growth Forecasts by 2025-2035