

Revenue, 2025
$ 111.3 Bn
Forecast, 2035
$ 296.7 Bn
CAGR, 2025-2035
10.3%
Report Coverage
Global
Market Size and Forecast
The Global Bio-based Chemicals Market was worth USD 111.3 billion in 2025 and is expected to reach USD 296.7 billion by 2035, growing at a CAGR of 10.3% from 2025 to 2035. Based on this growth rate, the market is estimated to reach around USD 129.8 billion in 2026. Europe held the largest regional share of 51.2% in 2025, supported by strong sustainability regulations, bioeconomy initiatives, renewable feedstock use, and rising demand for low-carbon chemical solutions.
Key Parameter | Report Details |
|---|---|
Market Revenue, 2025 | USD 111.3 Billion |
Projected Revenue, 2035 | USD 296.7 Billion |
CAGR (2025-2035) | 10.3% |
Largest Region | Europe |
Fastest Growing Region | Asia Pacific |
Market Concentration | Medium |
Base Year | 2025 |
Forecast Period | 2025-2035 |
What is Bio-based Chemicals Market?
The Bio-based Chemicals Market includes chemicals produced from renewable biological sources such as biomass, sugar, starch, vegetable oils, agricultural residues, and microbial fermentation processes. These chemicals are widely used in packaging, personal care, food additives, agriculture, textiles, coatings, adhesives, plastics, detergents, and industrial formulations. The market is closely linked with green chemistry, biorefineries, circular economy goals, and sustainable manufacturing practices.
The market outlook remains strong as industries continue to shift from petroleum-based chemicals toward renewable and lower-emission alternatives. Growth can be attributed to rising demand for bio-based polymers, solvents, surfactants, acids, and platform chemicals across consumer and industrial applications. The expansion of biomanufacturing capacity, supportive policy frameworks, and corporate sustainability targets is expected to support long-term market demand.
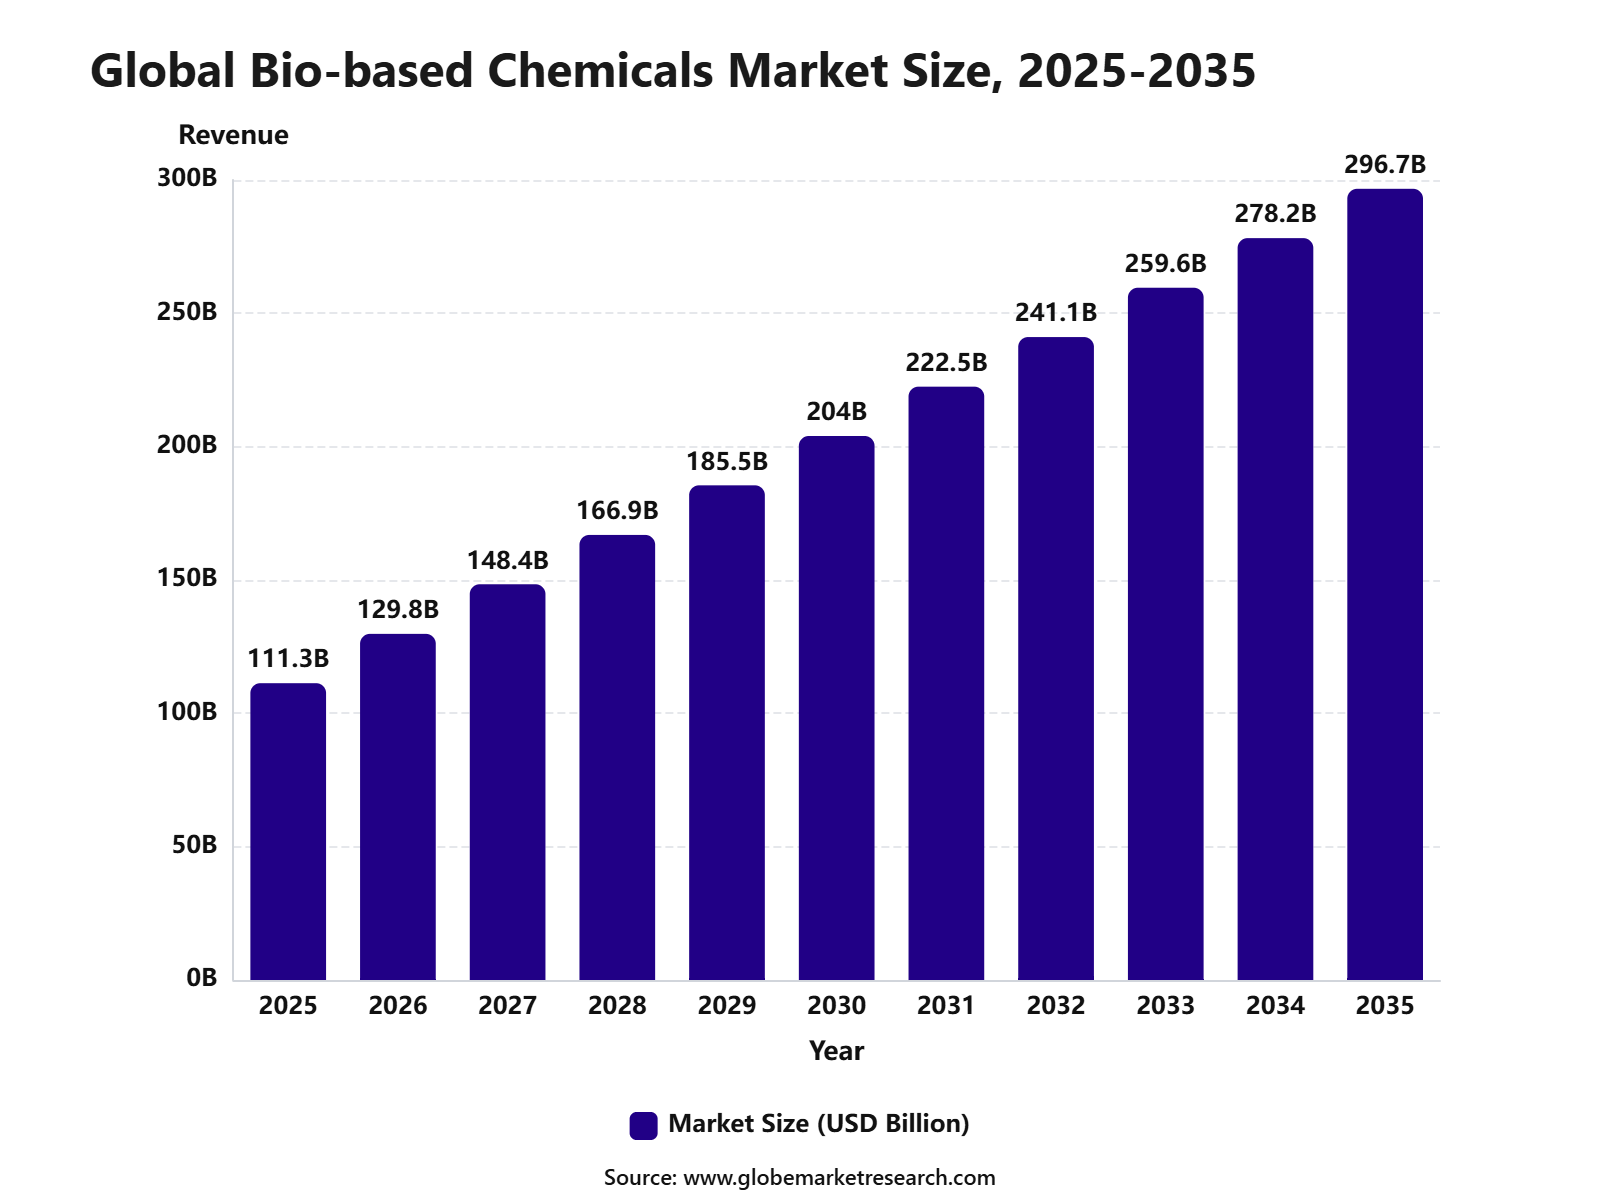 iThe graph shows projected market growth until 2035 based on CAGR analysis. Actual outcomes may vary depending on changing demand, competition, and economic factors.To gain greater insights - request a sample report PDF
Key Market Insights
Surfactants led the product category segment with 26.8% share, supported by rising demand for bio-based cleaning agents, emulsifiers, detergents, personal care ingredients, and industrial formulations.
Industrial applications accounted for 45.9% share, driven by growing use of bio-based chemicals in manufacturing, processing, coatings, lubricants, and specialty chemical production.
Plant-based sources held 49.4% share, supported by increasing preference for renewable feedstocks, lower environmental impact, and wider use of biomass-derived raw materials.
Chemical manufacturing captured 36.6% share by end use, driven by rising adoption of bio-based inputs in solvents, polymers, surfactants, additives, and other downstream chemical products.
Europe led the bio-based chemicals market with 51.2% share, supported by strong sustainability regulations, circular economy goals, advanced bio-refinery development, and rising demand for renewable chemical alternatives.
Top Funding and Investment
NatureWorks received final authorization from Cargill and GC to invest more than USD 600.0 million in a fully integrated Ingeo PLA manufacturing complex in Thailand. The site includes lactic acid, lactide, and polymer production in one complex. The facility opened in 2026 and adds about 75,000 metric tons per year of Ingeo biopolymer capacity, supporting bio-based plastics, packaging, fibers, and 3D printing materials.
BioMADE is investing USD 400.0 million in a U.S. bioindustrial pilot plant network to scale domestic biomanufacturing. The network is designed to support U.S. based production of critical chemicals and materials, including fermentation-based and bio-derived products. Facilities have been announced in Minnesota, California, and Iowa, improving pilot and demonstration-scale capacity for bio-based chemical producers.
Solugen raised over USD 350.0 million in Series C funding to expand its Bioforge platform for lower-carbon and carbon-negative chemicals. The company also secured a USD 213.6 million conditional loan guarantee from the U.S. Department of Energy for Bioforge Marshall, a 500,000-square-foot facility in Minnesota. The plant will produce bio-based organic acids for wastewater treatment, construction, agriculture, and energy applications.
Cargill and HELM committed a combined USD 300.0 million to build the first commercial-scale renewable 1,4-butanediol facility in the U.S. The Qore joint venture produces QIRA bio-BDO through fermentation of plant-based sugars. The facility was planned for at least 65,000 metric tons per year of bio-based BDO, used in spandex, polyester fibers, biodegradable plastics, polyurethane coatings, sealants, and artificial leather.
Product Category Insights
Surfactants accounted for 26.8% of the Bio-based Chemicals Market, supported by their wide use in detergents, cleaning products, personal care, agrochemicals, textile processing, coatings, and industrial formulations. Demand has been strengthened because surfactants improve wetting, foaming, emulsifying, dispersion, and cleaning performance across daily-use and industrial products.
The segment is also supported by the shift toward renewable ingredients in Europe, where around 50% of surfactants already contain at least one constituent from renewable feedstock. In detergent and cleaning applications, biodegradability remains a key purchase factor, as EU rules have required readily biodegradable surfactants for relevant applications since 2005.
Application Insights
Industrial applications held 45.9% of the Bio-based Chemicals Market, mainly due to rising use in lubricants, solvents, coatings, adhesives, polymers, cleaning chemicals, and processing aids. The industrial segment benefits from strong demand for lower fossil dependency and safer production inputs across manufacturing value chains.
Bio-based chemicals are increasingly being considered for industrial deployment because they can replace fossil-derived materials while supporting circularity and resource efficiency. The European Environment Agency noted that bio-based innovation is closely linked with biomass-use efficiency and fossil-resource substitution, which supports wider industrial adoption.
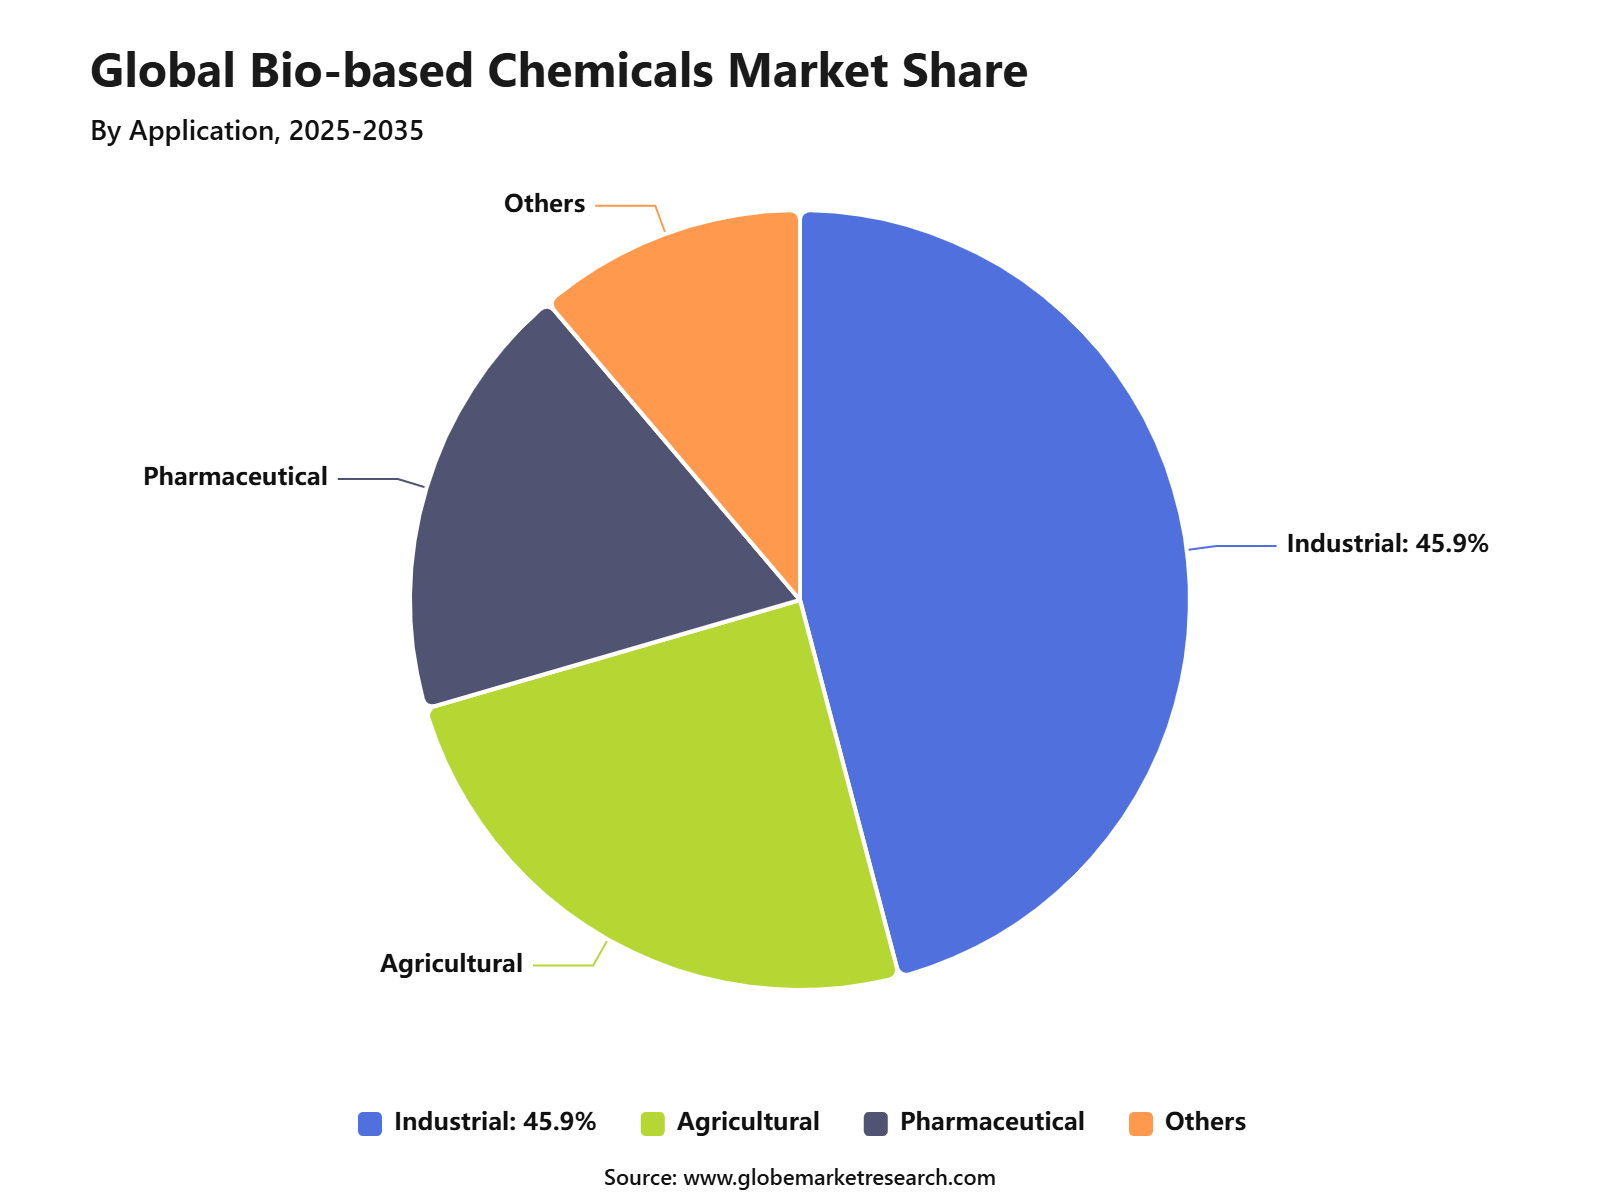 iThe graph shows projected market growth until 2035 based on CAGR analysis. Actual outcomes may vary depending on changing demand, competition, and economic factors.To gain greater insights - request a sample report PDF
Source Insights
Plant-based sources captured 49.4% of the market, making them the leading source category. Their strong position can be attributed to the availability of starch crops, sugar crops, oilseed crops, lignocellulosic biomass, wood, straw, flax, hemp, and other plant-derived materials used in bio-based chemical conversion.
Plant-based feedstocks are preferred because they can be processed through oleochemistry, sugar chemistry, thermochemical routes, and wood chemistry. These feedstocks are also suitable for making chemicals used in construction materials, hygiene products, packaging, cosmetics, adhesives, oils, lubricants, and automotive components.
End Use Insights
Chemical manufacturing represented 36.6% of the market, supported by the use of bio-based intermediates in polymers, solvents, resins, surfactants, plasticizers, coatings, and specialty chemical formulations. This end-use segment remains important because bio-based chemicals can be blended into existing production systems or used to create new chemical chains.
The growth of this segment can be linked to the chemical industry’s need to reduce reliance on fossil resources and improve product carbon profiles. Bio-based chemistry allows fossil resources to be partly or fully replaced with biomass-derived inputs, helping reduce dependence on oil, coal, and natural gas.
Region Insights
Europe led the Bio-based Chemicals Market with 51.2% share, supported by strong bioeconomy policy, strict sustainability standards, and higher adoption of renewable feedstocks in chemicals, materials, and industrial products. The region has a mature regulatory base, advanced biorefinery activity, and strong demand from cleaning, packaging, automotive, cosmetics, and specialty chemical sectors.
The European Commission’s 2025 bioeconomy plan highlights the role of bio-based products in replacing fossil-based materials and supporting clean industries. The EU bioeconomy already employs more than 17 million people, equal to around 8% of EU jobs, which shows the depth of Europe’s industrial and policy base for bio-based chemicals.
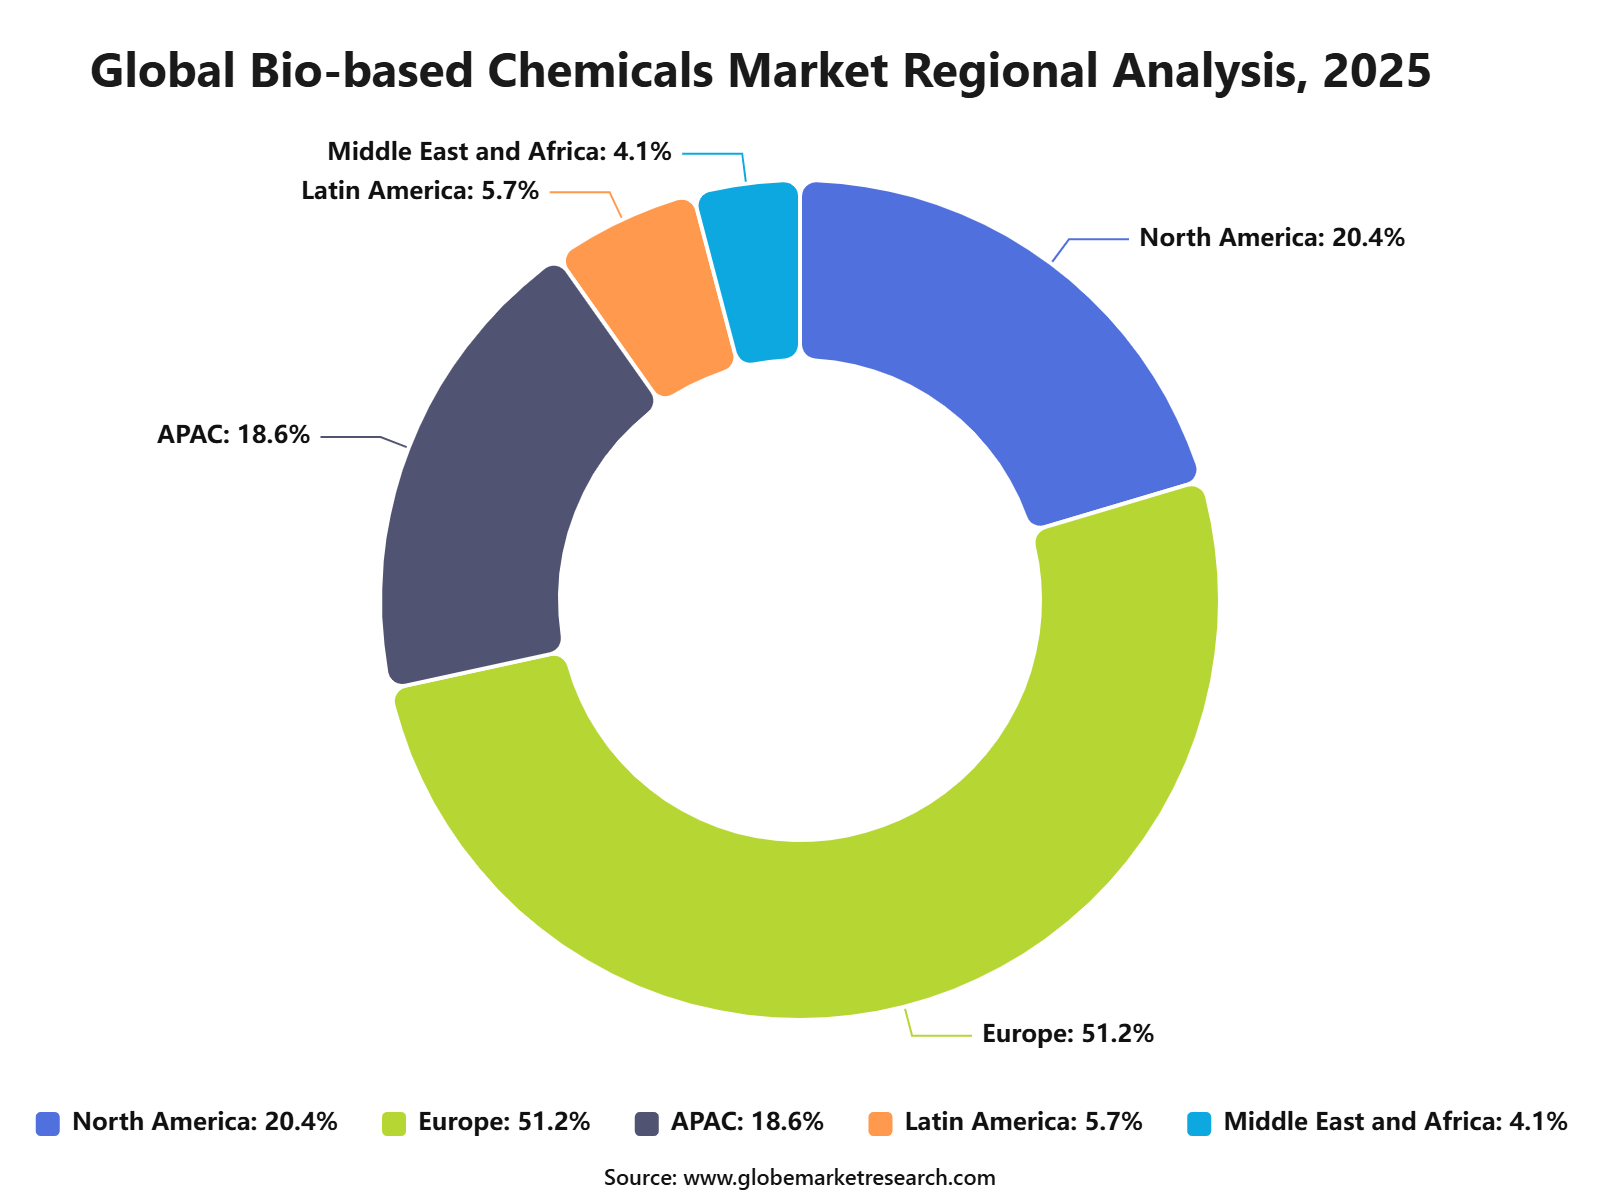 iThe graph shows projected market growth until 2035 based on CAGR analysis. Actual outcomes may vary depending on changing demand, competition, and economic factors.To gain greater insights - request a sample report PDF
Regional Impact Analysis
North America remains important due to bio-manufacturing capability, agricultural feedstock availability, and demand from packaging and consumer goods. Asia Pacific is expected to build future demand through industrial growth, consumer goods manufacturing, and rising interest in renewable materials.
Impact Factor | Estimated CAGR Impact | Regional Relevance | Market Impact |
|---|---|---|---|
Europe market leadership | +3.2% | Europe, 51.2% share in 2025 | Leads global value demand. |
Germany and France chemical innovation | +2.0% | Germany, France | Supports premium development. |
Netherlands and Nordic bioeconomy focus | +1.6% | Netherlands, Denmark, Sweden, Finland | Builds circular supply. |
North America bio-manufacturing growth | +1.3% | U.S. and Canada | Adds production value. |
Asia Pacific industrial demand | +1.1% | China, India, Japan, South Korea | Builds future volume. |
Go-To-Market and Sales Economics
The go-to-market strategy for bio-based chemicals should be focused on high-volume buyers in packaging, personal care, home care, food ingredients, coatings, adhesives, textiles, agriculture, and industrial solvents. Buyers are increasingly asking for renewable carbon, lower fossil dependency, and traceable feedstocks, but commercial adoption still depends on price, performance, certification, and supply reliability. USDA’s BioPreferred Program remains an important procurement route in the U.S. because it supports mandatory federal purchasing and voluntary product labeling for biobased products.
Sales economics are strongest where bio-based chemicals can replace petroleum-based inputs without forcing major reformulation costs. Bioplastics, bio-based solvents, bio-surfactants, organic acids, bio-based polymers, enzymes, and platform chemicals have better adoption potential when they offer equal performance, lower carbon profile, and stable supply. Global bio-based plastics production capacity is forecast to rise from 2.31 million tonnes in 2025 to 4.69 million tonnes by 2030, showing a clear scale-up path for renewable materials used in packaging and consumer goods.
Risk Factors & Market Barriers
The main barriers are feedstock availability, fermentation yield, purification cost, scale-up risk, and price competition with petrochemical alternatives. Bio-based chemicals often depend on sugar, starch, vegetable oils, agricultural residues, waste streams, and biomass. Any change in crop output, feedstock quality, logistics, or energy cost can affect production economics.
Technology qualification remains another barrier because customers require stable purity, odor, color, viscosity, activity, and shelf life. DBT-BIRAC identified bio-based chemicals, biopolymers, and APIs as priority areas under India’s BioE3 Policy, but commercial scale-up still needs optimized production strains, reliable bioprocessing, and downstream recovery efficiency.
Regulatory and sustainability claims must also be carefully managed. Buyers may request proof of renewable carbon content, biodegradability, food-contact suitability, toxicity data, and lifecycle emissions. If evidence is weak, companies can face claim challenges, delayed approvals, or customer rejection, especially in packaging, cosmetics, food ingredients, healthcare, and consumer-facing applications.
Revenue Potential Analysis
Revenue Landscape Across
Revenue potential is spread across three major demand groups: drop-in chemicals, specialty bio-based ingredients, and new-performance materials. Drop-in chemicals are easier to sell because they fit existing assets and customer formulations. Specialty products such as bio-based surfactants, cosmetic ingredients, biolubricants, and food-grade fermentation chemicals offer better margins because customers value safety, mildness, biodegradability, and brand positioning.
Europe is becoming a stronger revenue region because public funding is being directed toward circular and bio-based industries. In April 2026, Circular Bio-based Europe Joint Undertaking opened a €170.7 million call across 13 topics to support development and scale-up of circular bio-based industries. This supports demonstration plants, feedstock valorization, industrial biotechnology, and commercial partnerships across chemicals, materials, packaging, agriculture, and construction.
Financial Impact
The financial impact is shaped by feedstock cost, fermentation yield, downstream processing cost, plant utilization, and customer qualification time. Bio-based producers can gain pricing power when they reduce dependence on crude-oil-linked inputs and serve buyers with sustainability targets. However, cost advantage is not automatic because sugar, corn, vegetable oils, biomass residues, enzymes, utilities, and purification steps can create high operating expenses.
Feedstock volatility is a key financial factor in 2026. FAO reported that the Vegetable Oil Price Index reached 192.0 points in June 2026, up 3.8% from May and 23.3% above the previous year. Palm and rapeseed oil prices were supported by biodiesel demand and supply concerns, while sugar prices declined 5.7% month-on-month due to greater sugarcane allocation to sugar production in Brazil. These movements affect oleochemical, fermentation, and sugar-based chemical producers.
Drivers Impact Analysis
The Bio-based Chemicals Market is driven by rising demand for renewable raw materials, lower-carbon production, sustainable packaging, green solvents, bio-based polymers, bio-based surfactants, and fermentation-derived chemicals. These chemicals help reduce dependence on fossil-based feedstocks while supporting cleaner industrial production.
Europe leads the market due to strong sustainability policies, circular economy goals, bioeconomy investment, and demand from packaging, automotive, consumer goods, agriculture, and industrial applications. Germany, France, Netherlands, Italy, and Nordic countries remain key contributors because of advanced chemical manufacturing and strong environmental standards.
Impact Factor | Estimated CAGR Impact | Regional Relevance | Market Impact |
|---|---|---|---|
Rising demand for renewable feedstocks | +2.7% | Europe, North America, Asia Pacific | Drives core growth. |
Growth in sustainable packaging | +2.3% | Europe, U.S., Japan, China | Supports bio-based polymers. |
Shift from fossil-based chemicals | +2.0% | Europe and developed markets | Builds long-term demand. |
Corporate sustainability commitments | +1.7% | Global consumer and industrial brands | Supports procurement shift. |
Expansion of fermentation-based production | +1.4% | Europe, U.S., Asia Pacific | Adds scalable supply. |
Restraints Impact Analysis
The market faces restraints from high production cost, feedstock price volatility, and limited large-scale availability of some bio-based chemical inputs. Biomass, sugar, starch, vegetable oils, and waste-based feedstocks can vary in cost and quality. Another restraint is competition from well-established petrochemical alternatives. Conventional chemicals often have mature supply chains, lower costs, and large installed capacity, which can slow adoption of bio-based products in price-sensitive applications.
Impact Factor | Estimated CAGR Impact | Regional Relevance | Market Impact |
|---|---|---|---|
Higher production cost | -1.4% | Global producers | Limits price competitiveness. |
Bio-feedstock supply volatility | -1.2% | Europe, Asia Pacific, North America | Affects production stability. |
Competition from petrochemicals | -1.0% | Global chemical markets | Slows substitution. |
Scale-up and capacity limitations | -0.9% | Emerging bio-based chemical producers | Restricts volume growth. |
Certification and compliance cost | -0.7% | Europe, North America, Japan | Raises market entry burden. |
Opportunities Impact Analysis
Opportunities are strong in bio-based polymers, organic acids, bio-solvents, bio-surfactants, bio-based platform chemicals, and renewable intermediates. These areas benefit from demand for lower-carbon products across packaging, textiles, personal care, coatings, agriculture, and automotive materials.
Higher-value growth is also emerging in waste-to-chemicals, lignocellulosic feedstocks, precision fermentation, and drop-in bio-based chemicals. Companies that can deliver cost-efficient, scalable, and certified low-carbon products can capture stronger long-term demand.
Impact Factor | Estimated CAGR Impact | Regional Relevance | Market Impact |
|---|---|---|---|
Bio-based polymer expansion | +2.6% | Europe, Asia Pacific, North America | Builds packaging demand. |
Bio-solvent adoption | +2.1% | Europe, North America, Japan | Supports cleaner formulations. |
Bio-surfactant development | +1.8% | Personal care and cleaning markets | Adds premium value. |
Organic acid production growth | +1.6% | Food, pharma, polymer sectors | Supports broad usage. |
Waste-based chemical production | +1.3% | Europe, U.S., Japan | Creates circular opportunity. |
Challenges Impact Analysis
The main challenge is achieving cost parity with fossil-based chemicals without compromising performance. End users require bio-based chemicals that match quality, durability, shelf life, purity, and processing performance in existing manufacturing systems.
Another challenge is securing reliable feedstock without competing heavily with food supply or land use. Producers must manage sustainability certification, traceability, seasonal variation, logistics, and conversion efficiency to build buyer trust.
Impact Factor | Estimated CAGR Impact | Regional Relevance | Market Impact |
|---|---|---|---|
Achieving cost parity | -1.3% | Global end-use markets | Affects adoption speed. |
Matching petrochemical performance | -1.1% | Packaging, coatings, plastics | Impacts buyer confidence. |
Managing feedstock sustainability | -1.0% | Europe, North America, Asia Pacific | Raises sourcing complexity. |
Scaling commercial production | -0.9% | Bio-refinery and fermentation plants | Adds technical risk. |
Maintaining product consistency | -0.7% | Industrial and consumer goods sectors | Protects customer approval. |
Market Concentration: Medium
The Bio-based Chemicals Market shows medium concentration because scale is important, but the industry is still spread across many product types and regional suppliers. Large producers have stronger control in bio-based polymers, organic acids, bio-solvents, oleochemicals, and platform chemicals because they can manage feedstock sourcing, fermentation capacity, quality control, and long buyer approval cycles. However, the market is not highly consolidated because specialist producers continue to serve cosmetics, home care, coatings, lubricants, packaging, agriculture, and food ingredient applications.
The medium concentration level is supported by capacity and utilization trends. Global bio-based plastics production capacity was about 2.31 million tonnes in 2025 and is forecast to reach around 4.69 million tonnes by 2030, while actual 2025 production was 1.67 million tonnes, equal to 72% of global capacity. Packaging held 41.3% of bioplastics applications in 2025, while automotive and transport reached 10.3%, showing that demand is broad across industries rather than dominated by one end-use sector.
In the U.S., the broader biobased products industry contributed USD 489 billion to the economy in 2021 and supported 3.94 million jobs, with each industry job supporting an estimated 1.4 additional jobs in other sectors. The USDA-linked report also identified about 20,000 biobased products, showing that the supplier and product base is wide. This supports the view that the market is moderately competitive, with no single group fully controlling supply across all bio-based chemical categories.
Segment Covered in the Report
By Product Category
Platform Chemicals
Polymers for Plastics
Paints
Coatings
Inks and Dyes
Cosmetics and Personal Care Products
Man-made Fibers
Others
By Application
Industrial
Pharmaceutical
Others
By Source
Plant-based
Animal-based
Microbial-based
Waste-based
By End Use
Chemical Manufacturing
Agriculture
Food and Beverage
Personal Care
Pharmaceuticals
Automotive
By Region
North America
Europe
Asia Pacific
Latin America
Middle East and Africa
Market Trend Analysis
The market trend is moving toward bio-based polymers, bio-based solvents, bio-surfactants, organic acids, platform chemicals, and fermentation-derived intermediates. These product groups are gaining demand as manufacturers reduce carbon footprint and improve product sustainability.
Europe continues to lead because of policy support, customer preference for lower-impact products, and advanced chemical innovation. Asia Pacific is also building demand through packaging, textiles, agriculture, and consumer goods manufacturing.
Impact Factor | Estimated CAGR Impact | Regional Relevance | Market Impact |
|---|---|---|---|
Bio-based polymers gain momentum | +2.5% | Europe, Asia Pacific, North America | Leads product growth. |
Fermentation-derived chemicals rise | +2.0% | Europe, U.S., China, Japan | Supports scalable production. |
Bio-solvents replace conventional solvents | +1.7% | Europe and North America | Supports cleaner manufacturing. |
Bio-surfactants gain consumer interest | +1.5% | Personal care and cleaning markets | Adds green formulation value. |
Circular bioeconomy trend expands | +1.2% | Europe, Japan, North America | Builds policy-led demand. |
Investor Type Impact Matrix
Investors should focus on bio-based chemical companies with strong feedstock access, scalable production technology, certification readiness, and exposure to packaging, personal care, detergents, agriculture, and industrial applications. Supply consistency and cost control remain key success factors.
Strategic investors can also target bio-refineries, fermentation platforms, bio-based polymer producers, bio-solvent suppliers, and bio-surfactant companies. Businesses that combine sustainability performance with reliable commercial-scale output are better positioned for long-term growth.
Investor Type | Estimated CAGR Impact | Regional Relevance | Market Impact |
|---|---|---|---|
Bio-based Chemical Producers | +2.3% | Global | Expands renewable chemical supply. |
Bio-refinery Operators | +2.0% | Europe, North America, Brazil, Asia Pacific | Supports feedstock conversion. |
Packaging Material Companies | +1.7% | Europe, Asia Pacific, North America | Drives bio-based polymer demand. |
Specialty Ingredient Suppliers | +1.4% | Personal care, cleaning, coatings | Adds premium value. |
Strategic and Sustainability Investors | +1.2% | Europe, North America, Asia Pacific | Funds low-carbon growth. |
Recent Developments
In May 2026, UPM acquired Avantium’s Ray Technology intellectual property to strengthen its position in bio-based glycols. The technology supports production of bio-based mono-ethylene glycol and mono-propylene glycol from plant-based sugars, which are used in packaging, polyester, coatings, and industrial formulations. This deal highlights the rising value of protected process technology in renewable chemicals.
In April 2026, Shrieve Chemical Company acquired Vertec BioSolvents, a U.S. based manufacturer of bio-based solvents. The deal expanded Shrieve’s specialty chemicals portfolio and added more sustainable solvent options for agriculture, coatings, inks, industrial cleaning, consumer goods, and food-related applications. Transaction terms were not disclosed.
Research Methodology
Methodology Area | Coverage Details |
|---|---|
Primary Research | Interviews with manufacturers, suppliers, distributors, consultants, procurement teams, and industry experts. |
Secondary Research | Company filings, annual reports, regulatory databases, government publications, trade associations, and verified industry sources. |
Data Validation | Cross-verification through source triangulation, historical trend review, demand-side checks, and supply-side assessment. |
Market Estimation | Bottom-up and top-down analysis based on product demand, regional consumption, company presence, and application-level usage. |
Forecasting Approach | Forecasts based on regulatory shifts, infrastructure investment, technology adoption, pricing trends, industrial expansion, and end-use demand. |
Quality Review | Analyst review, peer validation, outlier checks, internal consistency review, and final publication approval. |
AI Policy | AI is not used as a primary data source. All published insights are reviewed against human-verified evidence. |
Competitive Landscape
The market is characterized by intense competition among established players and emerging companies. Strategic partnerships, mergers and acquisitions, and product innovation are key strategies employed by market participants.
Key Market Players
BASF SE
Vertec BioSolvents Inc.
Archer Daniels Midland Company
Cargill, Incorporated
DuPont
Braskem S.A.
Corbion N.V.
NatureWorks LLC
Mitsubishi Chemical Corporation
Evonik Industries AG
LyondellBasell Industries N.V.
DSM-Firmenich
Novozymes
Methanex Corporation
PTT Global Chemical Public Company Limited
Other Key Players
Meet the Team
This report was prepared by our expert analysts with deep industry knowledge and research experience.
Prashant is a skilled research analyst with five years of practical experience in market intelligence, strategic research, and business consulting. His expertise covers primary research, secondary research, competitive benchmarking, and industry trend analysis across sectors such as semiconductors, automotive, transportation and logistics, machinery, and industrial equipment. Prashant focuses on delivering clear, data-backed insights that help clients understand market shifts, technology adoption, regulatory developments, and emerging growth opportunities.
Sayali brings more than 5 years of experience to Globe Market Research, supporting the accuracy, clarity, and relevance of research content across multiple industries. She reviews market data, segment analysis, competitive insights, and industry trends to ensure each report meets strong quality standards and provides practical value to business decision-makers. Her expertise spans healthcare, information technology, consumer goods, and diverse cross-industry domains. With a strong focus on data reliability, structured analysis, and clear presentation, Sayali helps ensure that each research output delivers well-reviewed insights for clients, investors, consultants, and industry stakeholders.
Frequently Asked Questions
Related Reports
More in Chemical and Material
Carbon Capture Chemicals Market Size to Reach USD 78.0 Billion by 2035
Carbon Capture Chemicals Market By Chemical Type (Amines, Carbonates, Ammonia-based Solvents, Ionic Liquids, Solid Sorbent Chemicals, Others), By Absorption Type (Chemical Absorption, Physical Absorption), By End-Use Industry (Oil and Gas, Power Generation, Chemical and Petrochemical, Cement, Iron and Steel, Others), By Application (Post-combustion Capture, Pre-combustion Capture, Industrial Gas Separation, Direct Air Capture, Others), By Regional Insights, Business plan and Project Report, Investment Opportunities, Profitability, Industry Trends, Leading Companies and Growth Forecasts by 2025-2035
Hydrogen Processing Chemicals Market Size to Hit USD 14.6 Billion by 2035
Hydrogen Processing Chemicals Market By Chemical Type (Catalysts, Adsorbents, Solvents, Corrosion Inhibitors, Scavengers, Others), By Function (Reforming Chemicals, Purification Chemicals, Hydroprocessing Chemicals, Gas Treatment Chemicals, Corrosion Control Chemicals, Others), By Process (Steam Methane Reforming, Hydrocracking, Hydrotreating, Pressure Swing Adsorption, Water-Gas Shift Reaction, Others), By End Use (Refineries, Ammonia Production, Methanol Production, Petrochemicals, Clean Hydrogen Plants, Others), By Regional Insights, Business plan and Project Report, Investment Opportunities, Profitability, Industry Trends, Leading Companies and Growth Forecasts by 2025-2035
Electrolyte Chemicals Market to Cross USD 49.4 Billion by 2035
Electrolyte Chemicals Market By Battery Type (Lithium-ion Electrolytes, Lead-acid Electrolytes, Flow Battery Electrolytes, Others), By Electrolyte Form (Liquid Electrolytes, Gel, Solid-State Electrolytes), By Application (Electric Vehicles, Energy Storage Systems, Consumer Electronics, Industrial and Motive Batteries, Others), By Product Type (Lithium-Based Electrolytes, Sulfide-Based Electrolytes, Polymer-Based Electrolytes, Oxide-Based Electrolytes, Others), By Regional Insights, Business plan and Project Report, Investment Opportunities, Profitability, Industry Trends, Leading Companies and Growth Forecasts by 2025-2035
Nickel Chemicals Market to Cross USD 19.1 Billion by 2035
Nickel Chemicals Market By Product Type (Nickel Sulfate, Nickel Hydroxide, Nickel Chloride, Nickel Nitrate, Nickel Carbonate, Nickel Acetate, Others), By Grade (Battery Grade, Plating Grade, Industrial Grade, High-Purity Grade, Others), By Form (Powder, Crystal, Solution, Granules, Others), By Application (Batteries, Electroplating, Catalysts, Ceramics and Pigments, Chemical Intermediates, Others), By End Use (Automotive, Electronics, Chemicals, Aerospace, Industrial Manufacturing, Others), By Regional Insights, Business plan and Project Report, Investment Opportunities, Profitability, Industry Trends, Leading Companies and Growth Forecasts by 2025-2035