

Revenue, 2025
$ 11.4 Bn
Forecast, 2035
$ 159.6 Bn
CAGR, 2025-2035
30.2%
Report Coverage
Global
Market Size and Forecast
The Global Bioplastics Market was worth USD 11.4 billion in 2025 and is expected to reach USD 159.6 billion by 2035, growing at a CAGR of 30.2% from 2025 to 2035. Based on this growth rate, the market is estimated to reach around USD 26.2 billion in 2026. Europe held the largest regional share of 49.5% in 2025, valued at around USD 5.6 billion, supported by strict plastic waste regulations, strong demand for compostable packaging, circular economy policies, and rising adoption of bio-based materials.
The Bioplastics Market includes plastic materials made from renewable biological sources or designed to biodegrade under suitable conditions. These materials include PLA, PHA, PBS, PBAT, starch blends, bio-PE, bio-PET, and other bio-based or biodegradable polymers. They are widely used in packaging, foodservice products, agriculture films, consumer goods, textiles, automotive parts, and medical applications.
Key Parameter | Report Details |
|---|---|
Market Revenue, 2025 | USD 11.4 Billion |
Projected Revenue, 2035 | USD 159.6 Billion |
CAGR (2025-2035) | 30.2% |
Largest Region | Europe (49.5%, USD 5.6 Bn) |
Fastest Growing Region | Asia Pacific |
Market Concentration | Medium |
Base Year | 2025 |
Forecast Period | 2025-2035 |
The market outlook remains strong as industries move away from conventional petroleum-based plastics and adopt sustainable material alternatives. Growth can be attributed to rising demand for eco-friendly packaging, single-use plastic restrictions, and increasing investment in bio-based polymer production. The expansion of compostable materials, recycling infrastructure, and brand-led sustainability initiatives is expected to support long-term market demand.
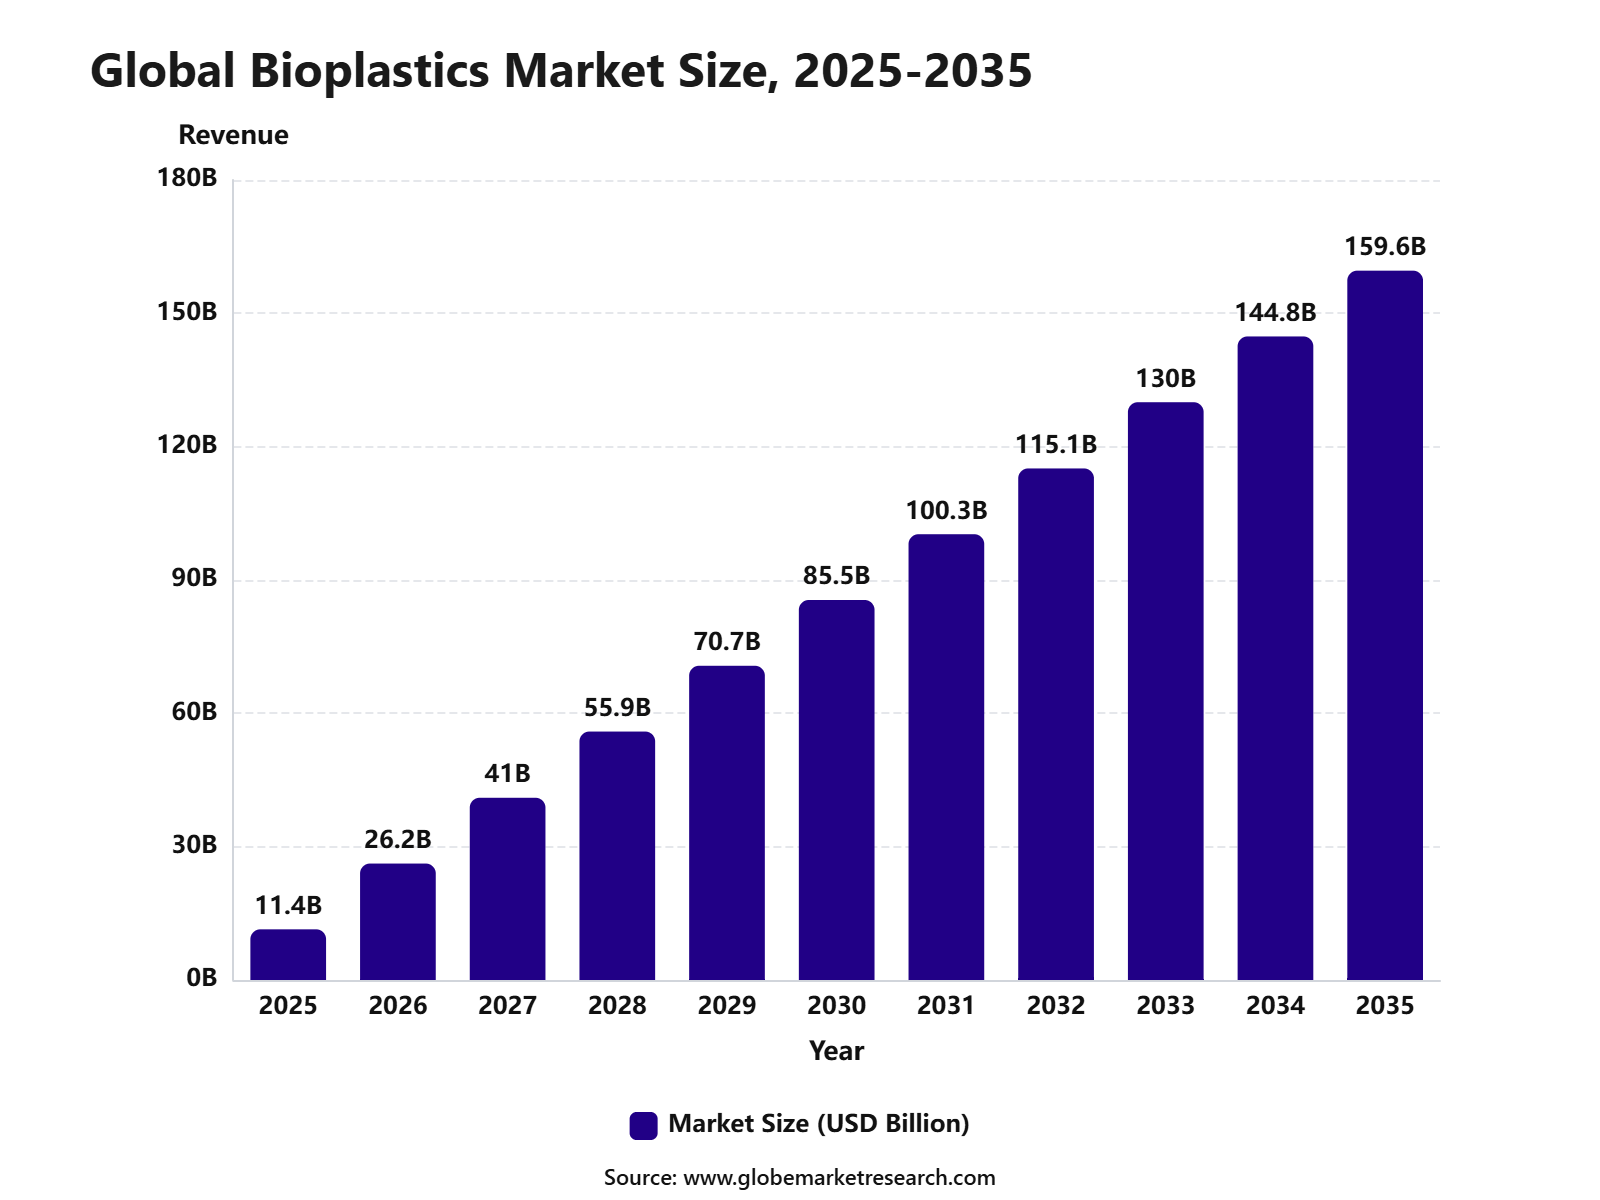 iThe graph shows projected market growth until 2035 based on CAGR analysis. Actual outcomes may vary depending on changing demand, competition, and economic factors.To gain greater insights - request a sample report PDF
Key Market Insights
Biodegradable bioplastics led the type segment with 65.8% share, supported by rising demand for compostable materials, lower plastic waste, and wider use in packaging, foodservice, and disposable product applications.
Rigid packaging accounted for 25.9% share by application, driven by growing use of bioplastics in bottles, containers, trays, cups, jars, and other durable packaging formats.
Europe led the bioplastics market with 49.5% share, valued at USD 5.6 billion, supported by strict plastic waste regulations, strong sustainability targets, and rising adoption of bio-based packaging materials.
Top Funding and Investment
Top Investment
In February 2025, Balrampur Chini Mills set ₹2,850 crore gross capex for India’s first industrial-scale PLA biopolymer plant. The plant capacity was revised to 80,000 TPA, with net capex of ₹1,750 crore after expected subsidy.
In May 2026, traceless opened its Hamburg-Harburg production facility with more than €20 million investment, including €5.13 million public funding. The facility has around 3,000 tons per year capacity for natural polymer plastic substitutes.
In July 2025, Futamura UK announced a £15 million, or €17.32 million, investment at its Wigton site for renewable cellulose packaging films, supported by up to £4.5 million UK government grant aid.
In October 2025, Uluu raised A$16 million, about €9 million, Series A investment to build a 10-tonne-per-year demonstration plant for seaweed-derived PHA bioplastic.
In April 2026, Foamlab raised €3 million growth capital to build a pilot plant and scale bacterial-cellulose foam materials designed to replace fossil-based plastic foams.
Top Funding
In September 2025, Avantium completed an €84.8 million equity raise, including a €65.4 million rights offering and €19.4 million additional placement, with €15.0 million placed with the Dutch State.
In March 2025, ReSource Chemical raised $15 million, co-led by Khosla Ventures and Fathom Fund, with participation from Chevron Technology Ventures and Mitsubishi Gas Chemical Company.
In March 2026, Shellworks raised $15 million in Series A funding to scale production of Vivomer, its plant-based biodegradable plastic alternative.
Top Acquisition
In June 2025, Teknor Apex acquired Danimer Scientific. It acquired a biodegradable materials company with PHA and PLA resin expertise, two facilities, and more than 480 patent assets.
In April 2025, Buscar Company acquired a 50% stake in Terramer through a stock swap. It acquired access to TERBO-1000 hemp-based bioplastic technology, a 350,000 sq. ft. production facility, and a 300 million pounds per year production-capable platform.
By Type
Biodegradable bioplastics accounted for 65.8% share of the Bioplastics Market. This leading position is supported by rising demand for materials that can reduce long-term plastic waste and support more sustainable packaging, agriculture, consumer goods, and foodservice applications.
The segment includes materials such as PLA, PHA, starch blends, and other compostable or biodegradable polymers. These materials are used in bags, films, trays, cups, cutlery, agricultural mulch films, and disposable packaging where end-of-life management is an important concern.
Demand for biodegradable bioplastics is expected to remain strong as governments, brands, and consumers focus on reducing conventional plastic use. Their adoption will continue to increase in short-life applications where compostability, renewable sourcing, and waste reduction are key priorities.
By Application
Rigid packaging accounted for 25.9% share of the Bioplastics Market. This dominance is driven by growing use in food containers, trays, cups, bottles, jars, lids, cosmetic packaging, and personal care packaging.
Bioplastics are preferred in rigid packaging because they offer structure, product protection, shelf appeal, and lower environmental impact compared with many fossil-based plastic formats. They are increasingly used by food, beverage, retail, and consumer goods companies seeking sustainable packaging alternatives.
The segment is expected to maintain steady demand as brands expand recyclable, compostable, and bio-based packaging formats. Growth will be supported by packaged food consumption, foodservice demand, and stronger sustainability commitments across consumer-facing industries.
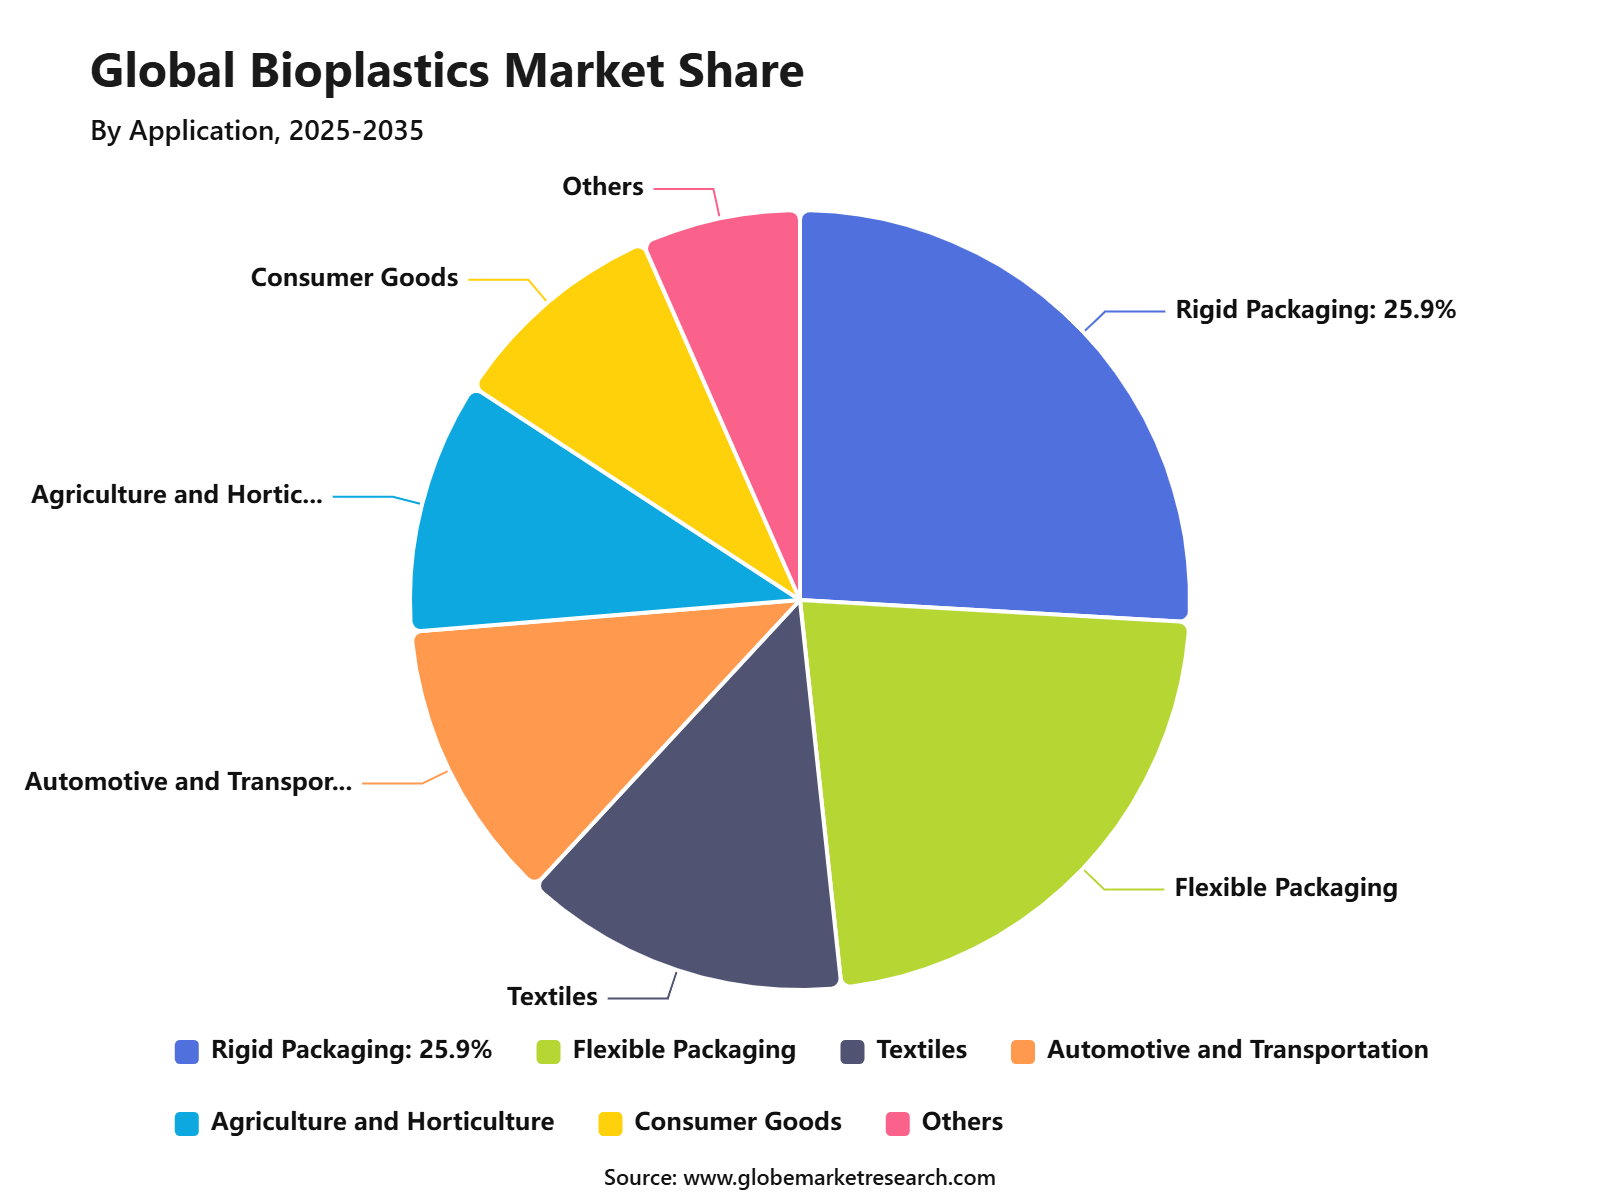 iThe graph shows projected market growth until 2035 based on CAGR analysis. Actual outcomes may vary depending on changing demand, competition, and economic factors.To gain greater insights - request a sample report PDF
By Region
Europe accounted for 49.5% share of the Bioplastics Market, reaching USD 5.6 billion. The region’s leadership is supported by strict plastic waste regulations, strong circular economy policies, and high consumer acceptance of sustainable packaging materials.
Germany, France, Italy, the United Kingdom, Spain, and the Netherlands are key contributors to regional demand. The region has strong adoption of biodegradable bags, compostable foodservice items, bio-based rigid packaging, and agricultural films.
Europe is expected to maintain its leading position as regulations continue to support lower plastic waste and renewable material adoption. Demand will remain supported by packaging producers, retailers, foodservice companies, and brands shifting toward bio-based and biodegradable plastic solutions.
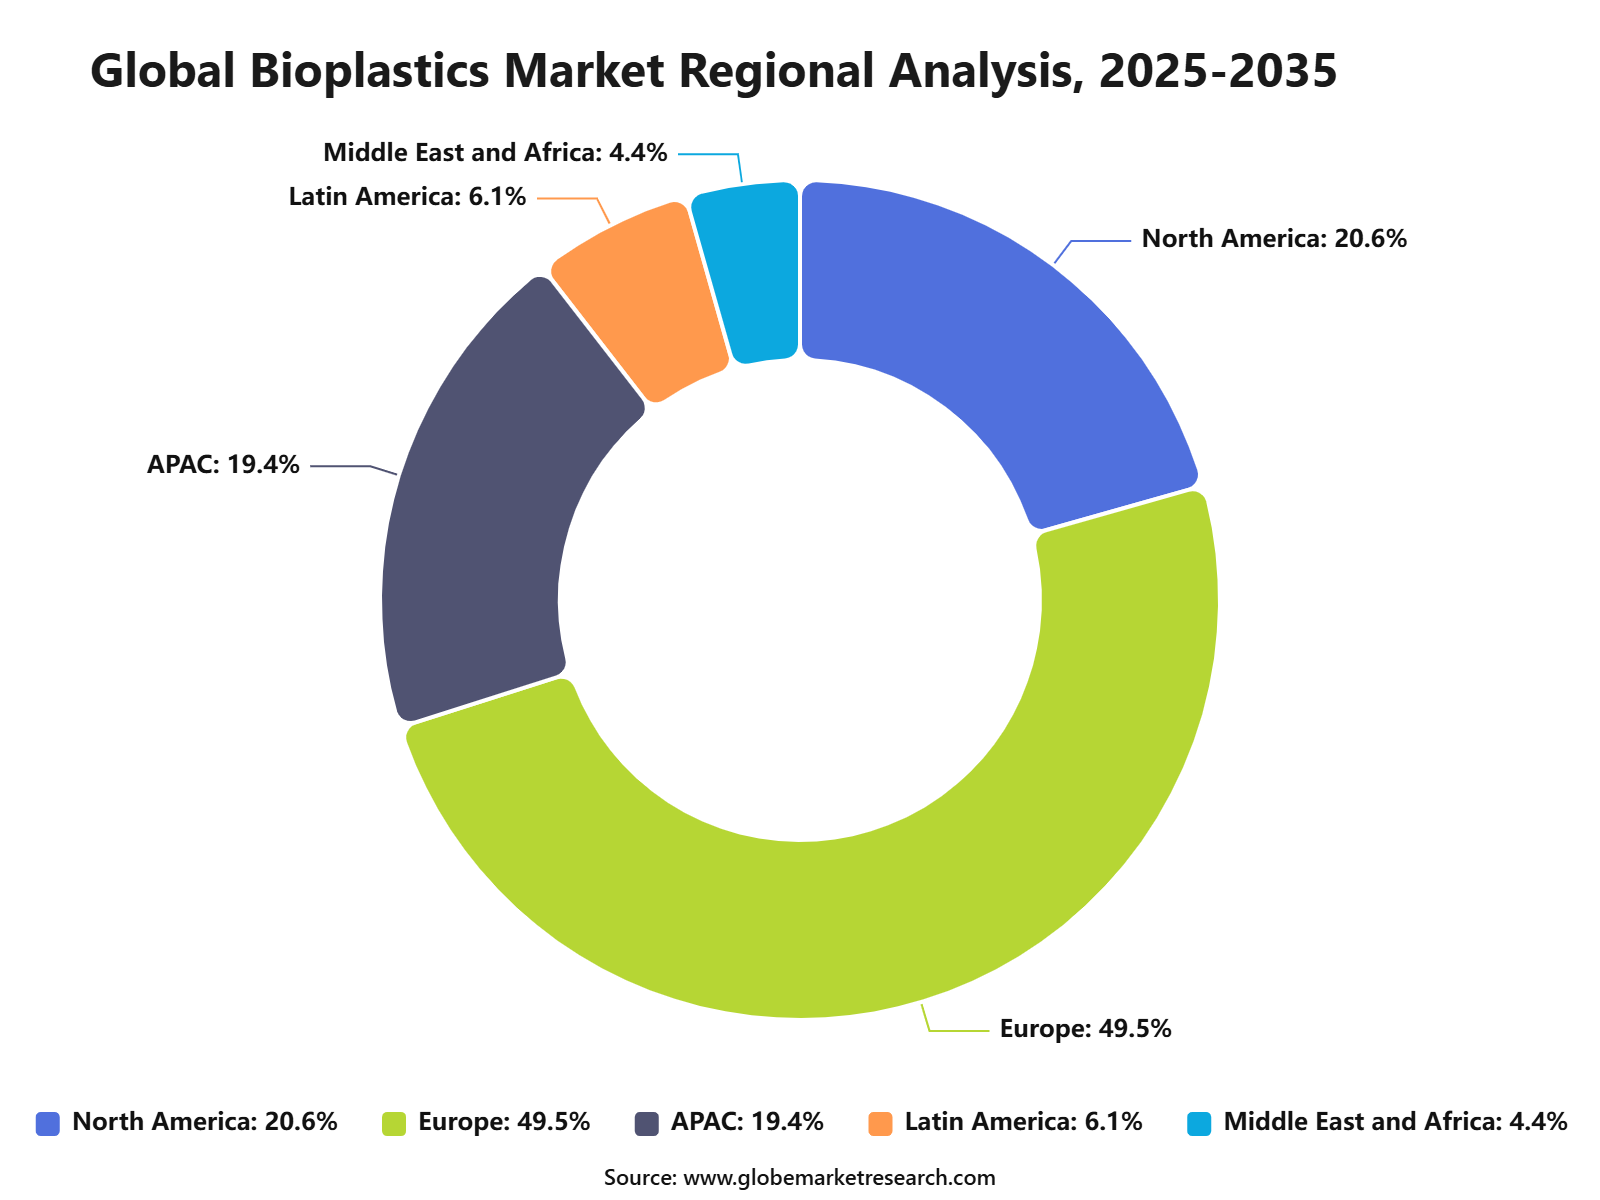 iThe graph shows projected market growth until 2035 based on CAGR analysis. Actual outcomes may vary depending on changing demand, competition, and economic factors.To gain greater insights - request a sample report PDF
Regional Impact Analysis
Europe leads the Bioplastics Market with 49.5% share in 2025, equal to about USD 5.6 billion, supported by strict plastic waste rules, circular economy programs, high consumer awareness, and strong demand for compostable and bio-based packaging. Germany, France, Italy, the UK, Spain, and Nordic countries remain major contributors.
Asia Pacific is expected to build future demand through packaging growth, manufacturing scale, biopolymer production, and rising sustainability commitments. North America supports value growth through foodservice packaging, consumer brand commitments, bio-based material innovation, and demand for certified compostable products.
Impact Factor | Estimated CAGR Impact | Regional Relevance | Market Impact |
|---|---|---|---|
Europe market leadership | +8.5% | Europe, 49.5% share in 2025 | Leads global value demand. |
EU circular economy regulation | +6.6% | EU packaging and retail sectors | Drives policy-led adoption. |
Germany, France, and Italy packaging demand | +5.0% | Western and Southern Europe | Supports commercial scale. |
Asia Pacific production and packaging growth | +4.4% | China, Japan, India, Southeast Asia | Builds future capacity. |
North America compostable packaging adoption | +3.8% | U.S. and Canada | Adds premium growth. |
Go-To-Market and Sales Economics
Bioplastics are commercialized through resin producers, compounders, packaging converters, food-service suppliers, agriculture-film distributors, brand owners, and retailers. Packaging is the strongest route because global bioplastics production capacity reached 2.31 million tonnes in 2025, with packaging holding 41.3%, equal to 0.95 million tonnes of capacity.
Sales economics should be built around certified performance, compostability where relevant, food-contact suitability, converter compatibility, and brand sustainability goals. Global bioplastics capacity is forecast to double from 2.31 million tonnes in 2025 to about 4.69 million tonnes by 2030, giving suppliers a clear scale-up path across packaging and durable applications.
The go-to-market model is also being shaped by packaging regulation. The EU Packaging and Packaging Waste Regulation entered into force in February 2025 and will apply from August 12, 2026. It requires all packaging to be recyclable by 2030, pushing demand for better material design, labeling, and end-of-life planning.
Risk Factors & Market Barriers
High cost remains the main adoption barrier. The European Commission’s Joint Research Centre stated in 2026 that bio-based and biodegradable plastics account for only around 0.5% of total global plastics production. Related EU circular-bioeconomy data also notes that bioplastic production is generally 1.5 to 2 times costlier than conventional plastics.
Consumer and buyer confusion is another barrier because bio-based, biodegradable, and compostable do not mean the same thing. Bio-based plastics can be durable and non-biodegradable, while some fossil-based plastics can biodegrade. Poor labeling can create greenwashing risk, weak disposal behavior, and lower confidence among retailers and public procurement buyers.
Infrastructure limitations also restrict market adoption. Bioplastics need suitable sorting, recycling, or composting systems to deliver their intended value. OECD warns that under current policies, plastic leakage to the environment will increase significantly in the next two decades, showing that material substitution alone cannot solve waste leakage without better collection systems.
Revenue Potential Analysis
Revenue Landscape Across
Revenue is spread across flexible packaging, rigid packaging, food-service products, compostable bags, agricultural mulch films, fibers, coatings, adhesives, consumer goods, automotive parts, and electronics applications. European Bioplastics lists packaging, food services, agriculture, consumer electronics, automotive, household appliances, construction, coatings, adhesives, and fibers as active bioplastics use areas.
Packaging remains the largest revenue pool, while automotive and transport are becoming stronger durable-use channels. European Bioplastics reported that automotive and transport reached 0.24 million tonnes in 2025, equal to 10.3% of bioplastics applications. This supports longer-life use cases beyond single-use bags and food-service items.
Regional revenue is strongest where regulation, brand commitments, and converter capability work together. Europe remains important because plastics-sector circularity is under pressure. Circular plastics production in Europe was around 8 million tonnes in 2024, equal to only 15% of total European plastics production, leaving room for material innovation.
Financial Impact
Bioplastics can create financial value through premium packaging, lower fossil-material exposure, stronger brand positioning, and compliance support. The financial case is strongest where customers need certified compostability, renewable content, reduced carbon communication, or regulatory readiness. However, higher resin prices require clear product benefits and reliable end-of-life claims.
Producer economics depend on feedstock cost, plant utilization, conversion efficiency, certification cost, and demand certainty. Since bioplastics still represent only about 0.5% of the 431 million tonnes of plastics produced globally each year, even small share gains can create meaningful volume upside for scaled producers.
The strongest financial returns are expected from suppliers that target high-value packaging, agriculture films, specialty compounds, and brand-backed offtake contracts. Europe’s plastics sector generated EUR 398 billion in turnover in 2024, but turnover fell 13% from 2022. This makes differentiated, circular, and regulation-aligned materials more important for margin protection.
Drivers Impact Analysis
The Bioplastics Market is driven by rising demand for sustainable packaging, biodegradable materials, bio-based polymers, compostable foodservice products, and lower-carbon plastic alternatives. Brand owners, retailers, and packaging converters are adopting bioplastics to reduce dependence on fossil-based plastics and meet sustainability targets.
Europe leads the market due to strict plastic waste rules, strong circular economy policies, high consumer awareness, and growing use of compostable packaging. Germany, France, Italy, the UK, Spain, and Nordic countries remain important demand centers because of active regulation and strong sustainable packaging adoption.
Impact Factor | Estimated CAGR Impact | Regional Relevance | Market Impact |
|---|---|---|---|
Rising demand for sustainable packaging | +8.2% | Europe, North America, Asia Pacific | Drives core market growth. |
Plastic waste reduction policies | +7.0% | Europe, Japan, India, Canada | Supports regulatory-led adoption. |
Growth in compostable foodservice products | +5.9% | Europe and urban retail markets | Builds high-volume demand. |
Brand commitments to lower-carbon materials | +5.1% | Global consumer goods companies | Supports long-term procurement. |
Demand for bio-based polymer alternatives | +4.4% | Packaging and consumer goods sectors | Expands material substitution. |
Restraints Impact Analysis
The market faces restraints from higher production cost, limited feedstock availability, and performance gaps compared with conventional plastics. Bioplastics often need specialized processing, certification, and separate end-of-life infrastructure, which can raise adoption barriers.
Another restraint is confusion around bio-based, biodegradable, and compostable claims. Consumers and businesses may misunderstand disposal requirements, especially when industrial composting or proper sorting systems are not widely available.
Impact Factor | Estimated CAGR Impact | Regional Relevance | Market Impact |
|---|---|---|---|
Higher cost than conventional plastics | -4.1% | Global packaging markets | Limits mass adoption. |
Limited composting infrastructure | -3.5% | North America, Asia Pacific, some EU markets | Slows biodegradable product use. |
Feedstock availability concerns | -3.0% | Bio-based polymer producers | Affects production scale. |
Performance limitations in some applications | -2.6% | Packaging, automotive, durable goods | Restricts substitution. |
Consumer confusion around disposal | -2.1% | Retail and foodservice markets | Weakens end-of-life outcomes. |
Opportunities Impact Analysis
Opportunities are strong in biodegradable packaging, compostable bags, foodservice ware, agricultural films, flexible packaging, rigid packaging, and bio-based PET, PLA, PHA, PBAT, PBS, and starch blends. These areas benefit from regulation, consumer preference, and corporate packaging redesign.
Higher-value opportunities are also emerging in bio-based durable plastics, bioplastic films, medical packaging, personal care packaging, e-commerce packaging, and food-contact certified materials. Companies that improve performance, cost, certification, and waste management compatibility can capture stronger long-term demand.
Impact Factor | Estimated CAGR Impact | Regional Relevance | Market Impact |
|---|---|---|---|
Compostable packaging expansion | +7.8% | Europe, North America, Asia Pacific | Builds high-growth demand. |
PLA and PHA material development | +6.6% | Europe, U.S., China, Japan | Supports premium applications. |
Bio-based PET and durable plastics | +5.7% | Beverage, textile, consumer goods sectors | Expands non-compostable bioplastics. |
Agricultural mulch film adoption | +4.8% | Europe, China, Japan, India | Adds farming-related demand. |
Food-contact certified bioplastics | +4.1% | Packaged food and foodservice markets | Improves commercial adoption. |
Challenges Impact Analysis
The main challenge is scaling production while maintaining quality, cost competitiveness, and sustainability claims. Bioplastics need reliable feedstock, stable polymer performance, and strong manufacturing capacity to compete with mature petrochemical plastics.
Another challenge is matching end-of-life systems with product design. Compostable plastics need proper composting infrastructure, while recyclable bio-based plastics need sorting and recycling compatibility to avoid contamination in existing waste streams.
Impact Factor | Estimated CAGR Impact | Regional Relevance | Market Impact |
|---|---|---|---|
Scaling production capacity | -3.8% | Global biopolymer producers | Limits near-term supply. |
Maintaining cost competitiveness | -3.2% | Packaging converters and brands | Affects adoption speed. |
Aligning products with waste systems | -2.8% | Europe, North America, Asia Pacific | Determines disposal success. |
Meeting food-contact and safety standards | -2.3% | Food packaging applications | Adds certification needs. |
Avoiding recycling stream contamination | -1.9% | Municipal waste systems | Protects circularity goals. |
Segment Covered in the Report
By Type
Biodegradable
Non-Biodegradable
By Application
Rigid Packaging
Flexible Packaging
Textiles
Automotive and Transportation
Others
By Region
North America
Europe
Asia Pacific
Latin America
Middle East and Africa
Market Trend Analysis
The market trend is moving toward compostable packaging, biodegradable films, PLA-based products, PHA materials, bio-based PET, flexible packaging, and foodservice applications. Packaging remains the strongest trend area because consumer brands are under pressure to reduce fossil-based plastic use.
Europe remains the leading value region because of strong policy support and high adoption of sustainable packaging. Asia Pacific is also expanding through bioplastic production capacity, food packaging demand, and rising investment in bio-based materials.
Impact Factor | Estimated CAGR Impact | Regional Relevance | Market Impact |
|---|---|---|---|
Compostable packaging trend strengthens | +7.5% | Europe, North America, Japan | Leads near-term adoption. |
PLA-based product demand rises | +6.2% | Europe, China, U.S., Southeast Asia | Supports scalable applications. |
PHA materials gain attention | +5.3% | Europe, U.S., Japan | Adds premium biodegradable value. |
Bio-based PET use expands | +4.6% | Beverage and consumer goods sectors | Builds durable bioplastic demand. |
Flexible bioplastic films grow | +3.9% | Food packaging and retail bags | Adds volume opportunity. |
Investor Type Impact Matrix
Investors should focus on bioplastic companies with strong polymer technology, certified product portfolios, feedstock security, packaging partnerships, and end-of-life alignment. Cost reduction, compostability proof, processing performance, and regulatory compliance are key success factors.
Strategic investors can also target PLA producers, PHA developers, compostable packaging manufacturers, bio-based PET platforms, agricultural film suppliers, and biopolymer compounders. Companies that combine sustainability with reliable performance and scalable supply are better positioned for long-term growth.
Investor Type | Estimated CAGR Impact | Regional Relevance | Market Impact |
|---|---|---|---|
Bioplastic Resin Producers | +6.8% | Global | Expands renewable polymer supply. |
Compostable Packaging Manufacturers | +5.6% | Europe, North America, Asia Pacific | Supports high-demand applications. |
PLA and PHA Technology Developers | +4.8% | Europe, U.S., China, Japan | Builds next-generation materials. |
Biopolymer Compounders | +4.0% | Packaging and consumer goods sectors | Improves application performance. |
Strategic Sustainable Material Investors | +3.4% | Global circular economy markets | Funds scale and commercialization. |
Recent Developments
In April 2026, DuPont completed the Aramids divestiture to Arclin after a USD 1.8 billion agreement, sharpening portfolio focus while Arclin added Kevlar and Nomex high-performance materials for aerospace, protection and electrical uses.
In April 2026, LG Chem highlighted PCR ABS recycling from discarded home appliances, while its engineering materials portfolio continued covering PC for automotive, electronics and mechanical components and ABS for appliances and IT devices.
In April 2026, Mitsubishi Engineering-Plastics announced CHINAPLAS participation with Mitsubishi Gas Chemical Group, presenting Iupilon and NOVAREX polycarbonate resins alongside POM, nylon, modified PPE and PBT/PET resin families.
Competitive Landscape
The market is characterized by intense competition among established players and emerging companies. Strategic partnerships, mergers and acquisitions, and product innovation are key strategies employed by market participants.
Key Market Players
NatureWorks LLC
TotalEnergies Corbion
Novamont S.p.A.
BASF SE
Biome Bioplastics
Braskem
Mitsubishi Chemical Group Corporation
Toray Industries, Inc.
Danimer Scientific
Futerro
Plantic Technologies
FKuR Kunststoff GmbH
Kaneka Corporation
Other Key Players
Research Methodology
This market study is prepared using a combination of primary and secondary research. Primary research includes discussions with manufacturers, suppliers, distributors, consultants, industry experts, and end users. Secondary research covers company reports, government databases, trade associations, technical publications, regulatory sources, and trusted industry documents. The collected information is used to assess market demand, pricing trends, technology adoption, competitive activity, and regional performance.
AI language models are not used as primary data sources, and publicly available AI-generated content is not treated as market evidence. Computational tools may be used to support data processing, translation, data classification, and pattern identification. However, every published assessment is supported by verified sources, human review, and primary market discussions.
Market estimates are developed through top-down and bottom-up approaches and validated using data triangulation. Revenue, production, shipment, pricing, and application-level data are compared across multiple sources. Forecasts consider economic conditions, regulatory changes, investment activity, innovation, supply chain developments, and industry risks. All findings are reviewed through source verification and internal quality checks before publication.
Part I
Source Management & Input Data Standards
Who provides data, how sources are qualified, and what types of evidence are admissible.
Part II
Research Scope & Market Coverage
How we define the markets we assess and the parameters that govern each product.
Part III
Data Collection, Verification & Submission
The mechanics of gathering, cross-checking, and hierarchically ranking evidence.
Part IV
Assessment Determination & Quality Controls
How raw data becomes a published assessment — normalisation, expert judgement, and outlier exclusion.
Part V
Publication, Corrections & Revision
Our publication schedule, corrections policy, and methodology review cycle.
Part VI
Independence, Ethics & Complaints
Conflict-of-interest policies, editorial independence, and how clients raise concerns.
Google · Preferred Sources
Don't miss the latest market research insights and industry updates on Google.
Add Globe Market Research as a preferred source in the Google app to see our reports, analysis, and market stories in your news suggestions.
Meet the Team
This report was prepared by our expert analysts with deep industry knowledge and research experience.
Pratiksha K. is a Senior Research Analyst with more than five years of experience in market research, industry analysis, competitive intelligence, and business strategy. She has contributed to detailed market reports, customized research studies, company profiling, market sizing, trend analysis, and strategic consulting projects for clients across different regions. Her industry expertise covers Chemical and Material, Consumer Goods, Food & Beverages and Energy & Power. She closely evaluates changing customer requirements, technology developments, regulatory conditions, supply chain structures, investment activity, and competitive strategies to provide clear and practical market insights.
Sayali brings more than 7 years of experience to Globe Market Research, supporting the accuracy, clarity, and relevance of research content across multiple industries. She reviews market data, segment analysis, competitive insights, and industry trends to ensure each report meets strong quality standards and provides practical value to business decision-makers. Her expertise spans healthcare, information technology, consumer goods, and diverse cross-industry domains. With a strong focus on data reliability, structured analysis, and clear presentation, Sayali helps ensure that each research output delivers well-reviewed insights for clients, investors, consultants, and industry stakeholders.
Frequently Asked Questions
Related Reports
More in Chemical and Material
Sulfuric Acid Market to Hit USD 61.5 Billion by 2035
Sulfuric Acid Market Size, Share, Analysis By Raw Material (Elemental Sulfur, Base Metal Smelters, Pyrite Ore, Others), By Application (Fertilizers, Chemical Manufacturing, Metal Processing, Petroleum Refining, Textile, Automotive, Pulp and Paper, Others), By Distribution Channel (Direct Sales, Distributors), By Regional Insights, Business plan and Project Report, Investment Opportunities, Profitability, Industry Trends, Leading Companies and Growth Forecasts by 2026-2035
Powder Metallurgy Market to Hit USD 17.0 Billion by 2035
Powder Metallurgy Market Size, Share, Analysis By Material (Ferrous Metals, Non-Ferrous Metals, Others), By Process (Additive Manufacturing, Powder Metal Hot Isostatic Pressing, Conventional Powder Metallurgy), By Application (Automotive, Aerospace and Defense, Healthcare, Electrical and Electronics, Industrial Machinery, Others) , By Regional Insights, Business plan and Project Report, Investment Opportunities, Profitability, Industry Trends, Leading Companies and Growth Forecasts by 2026-2035
Bromine Market to Hit USD 1.5 Billion by 2035
Bromine Market Size, Share, Analysis By Derivative (Organobromine, Clear Brine Fluids, Hydrogen Bromide, Others), By Application (Flame Retardants, Oil and Gas Drilling, Biocides, PTA Synthesis, Plasma Etching, Pharmaceuticals, Energy Storage, Others), By End-Use Industry (Chemicals, Oil and Gas, Pharmaceuticals, Electrical and Electronics, Automotive, Agriculture, Others), By Regional Insights, Business plan and Project Report, Investment Opportunities, Profitability, Industry Trends, Leading Companies and Growth Forecasts by 2026-2035
Hydrogen Cyanide Market to Hit USD 5.95 Billion by 2035
Hydrogen Cyanide Market Size, Share, Analysis By Product Form (Hydrogen Cyanide Liquid, Hydrogen Cyanide Gas), By Application (Adiponitrile, Acetone Cyanohydrin, Sodium Cyanide and Potassium Cyanide, Methionine, Cyanuric Chloride, Others), By End-Use Industry (Chemicals, Mining and Metallurgy, Pharmaceuticals, Agriculture, Textiles, Others), By Regional Insights, Business plan and Project Report, Investment Opportunities, Profitability, Industry Trends, Leading Companies and Growth Forecasts by 2026-2035