

Revenue, 2025
$ 575.1 Bn
Forecast, 2035
$ 919.1 Bn
CAGR, 2025-2035
4.8%
Report Coverage
Global
Market Size and Forecast
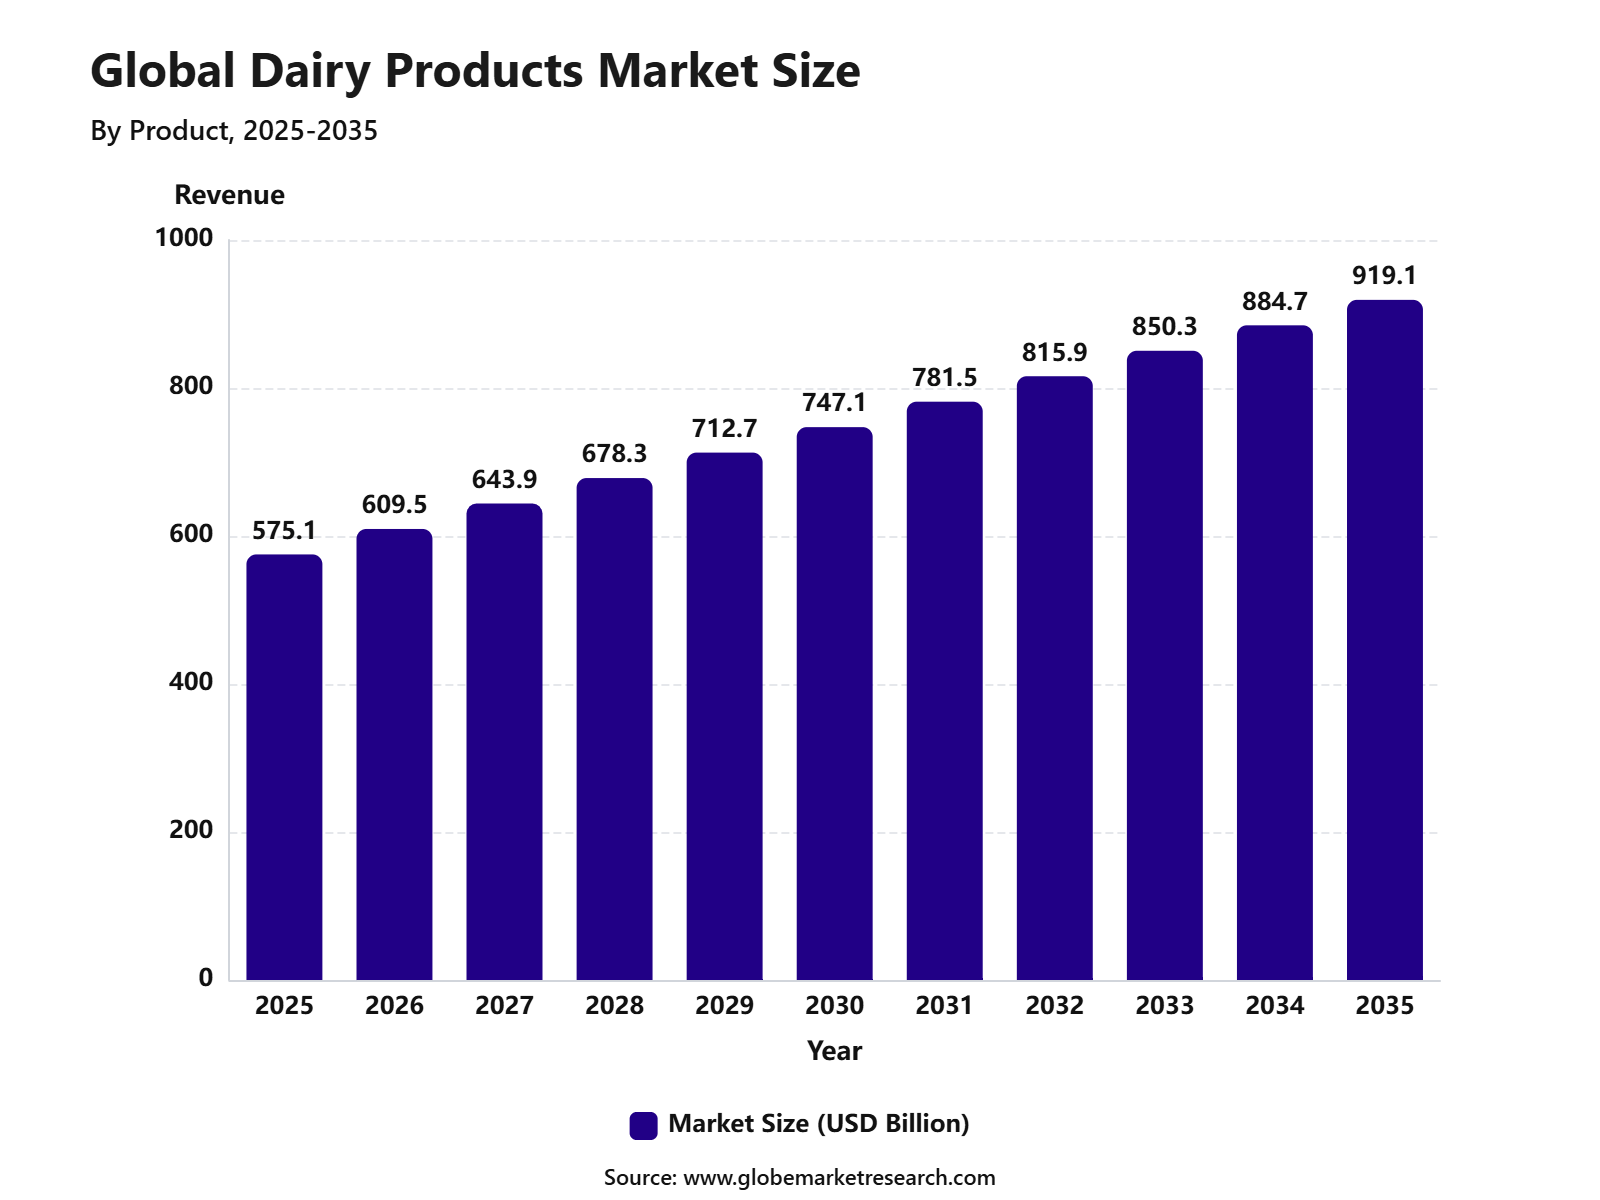
The Global Dairy Products Market was valued at USD 575.1 billion in 2025 and is projected to reach USD 919.1 billion by 2035, growing at a CAGR of 4.8% from 2025 to 2035. The growth of the market can be attributed to rising consumption of milk, cheese, yogurt, butter, cream, and value-added dairy products across household and foodservice channels. Demand is also being supported by population growth, higher protein intake, urbanization, and increasing use of dairy ingredients in bakery, confectionery, beverages, and processed foods.
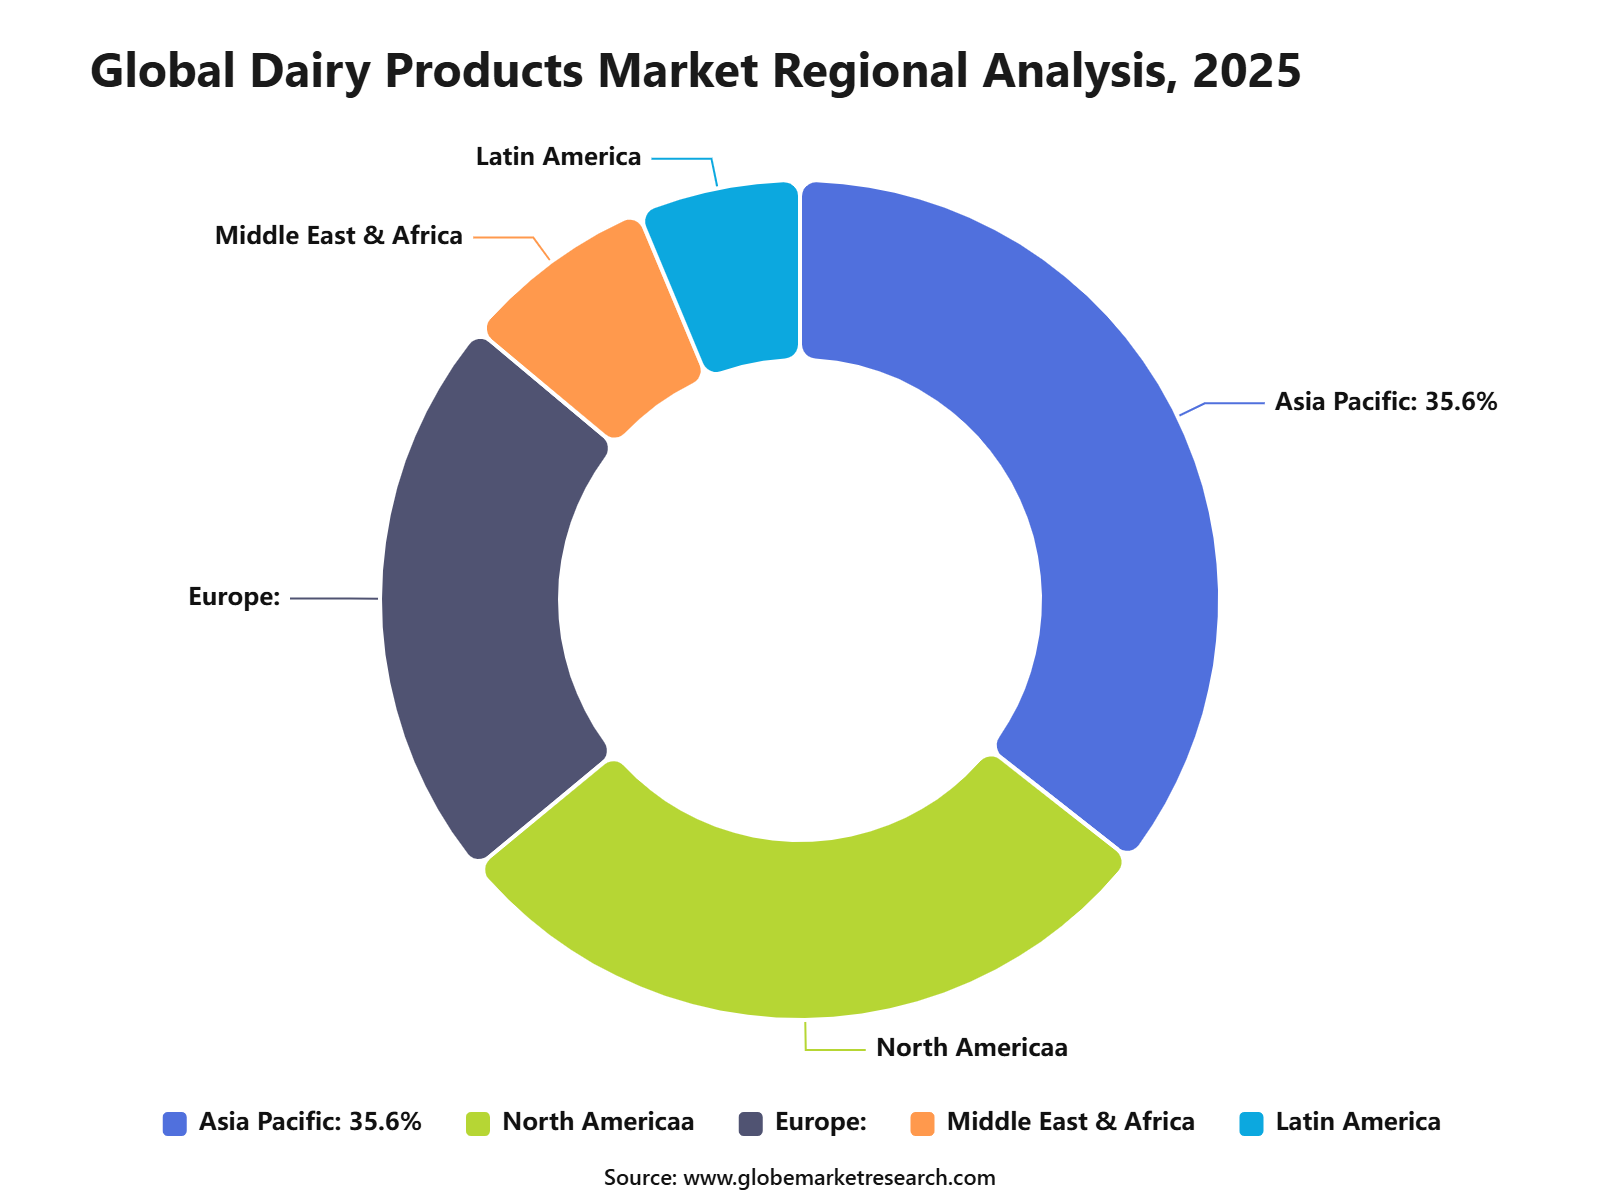
Asia Pacific held the largest regional share of 35.6% in 2025, valued at approximately USD 204.7 billion. The region’s dominance can be linked to its large consumer base, strong milk production, rising disposable income, and growing demand for packaged dairy products across India, China, Japan, South Korea, and Southeast Asian countries. Market expansion is further supported by cold chain development, organized retail growth, and increasing preference for fortified, flavored, and convenient dairy products.
 iThe graph shows projected market growth until 2035 based on CAGR analysis. Actual outcomes may vary depending on changing demand, competition, and economic factors.To gain greater insights - request a sample report PDF
Key Market Insights
Milk led the product segment with 62.5% share, supported by its daily household consumption, wide use in food preparation, and strong demand across both retail and foodservice channels.
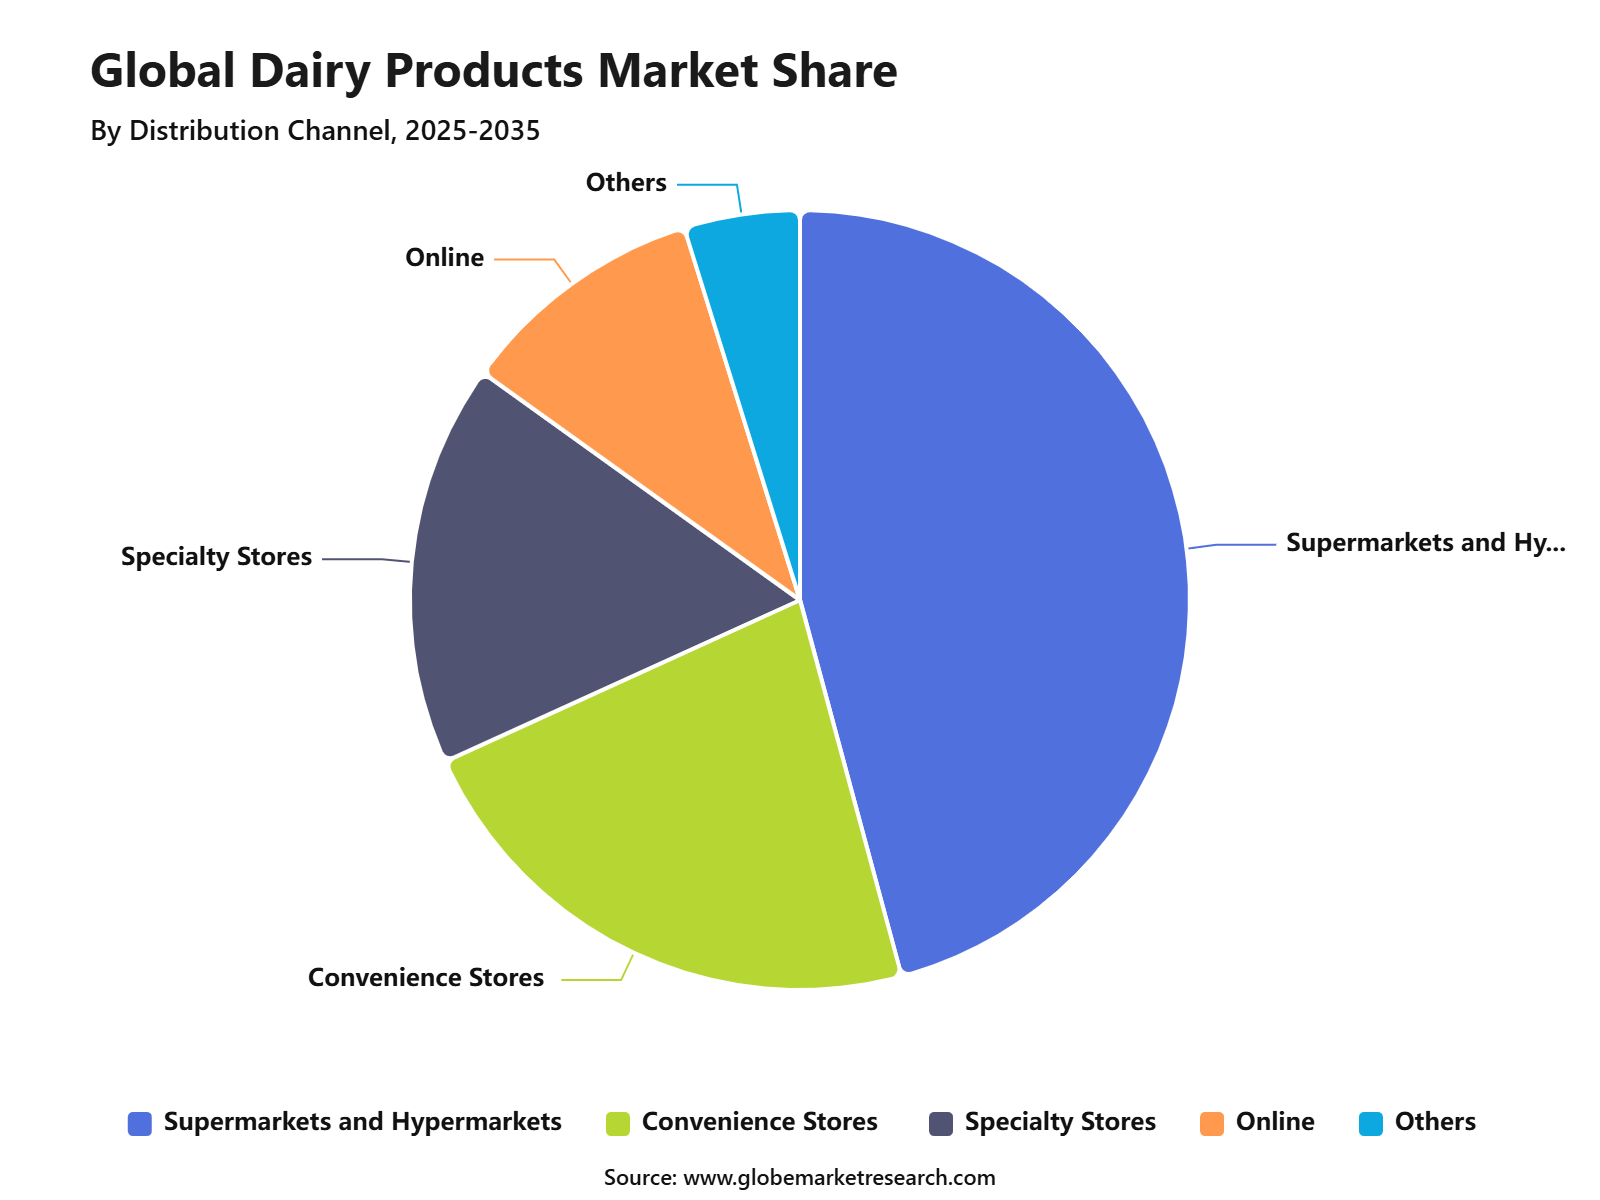
Supermarkets and hypermarkets accounted for 45.8% share by distribution channel, driven by broad product availability, organized cold-chain storage, competitive pricing, and high consumer footfall.
Asia Pacific held 35.6% share of the dairy products market, supported by large population, rising dairy consumption, expanding urban retail networks, and growing demand for packaged milk and value-added dairy products.
Go-to-Market and Sales Economics
The Dairy Products Market needs a product-led and channel-led go-to-market strategy because demand is spread across fluid milk, cheese, butter, yogurt, cream, ice cream, milk powder, whey protein, lactose, and infant nutrition ingredients. Suppliers should position products around nutrition, protein content, taste, convenience, freshness, clean-label claims, cold-chain reliability, and value-added formats. USDA ERS raised its U.S. milk production forecast to 236.4 billion pounds in 2026 and 237.0 billion pounds in 2027, supported by higher expected dairy cow inventories and higher milk per cow yields.
Sales economics are strongest when dairy companies balance commodity products with value-added products such as cheese, high-protein yogurt, whey protein, lactose, butterfat, and specialty ingredients. The U.S. all-milk price forecast for 2026 was revised to USD 20.70 per cwt, which shows that stronger milk supply can pressure farm-level prices while improving input availability for processors. Dairy processors with strong brands, export access, efficient plants, and product diversification are better positioned than companies dependent only on basic fluid milk.
Regulatory & Compliance Risks
Regulatory compliance is high because dairy products are perishable foods that require strict sanitation, pasteurization, cold-chain control, labeling, testing, and traceability. In the U.S., the Grade “A” Pasteurized Milk Ordinance helps ensure that Grade “A” milk and dairy products are among the safest in the country and globally. Dairy processors must maintain strong hygiene, plant controls, product testing, and documentation to support retail, foodservice, and institutional supply.
Food safety scrutiny has increased because of H5N1 in dairy cattle. FDA reported that it sampled 464 pasteurized dairy products, including milk, cheese, butter, and ice cream, and all were negative for viable H5N1. FDA also stated that pasteurization is effective at inactivating H5N1 and that the commercial pasteurized milk supply is safe, while raw milk cheese requires additional caution and testing.
Revenue Potential Analysis:
Revenue Landscape Across
The revenue landscape is spread across milk, cheese, butter, yogurt, cream, ice cream, milk powders, whey protein, lactose, casein, infant nutrition, foodservice ingredients, bakery ingredients, confectionery, sports nutrition, and export channels. Cheese and butterfat remain important value drivers because they support both retail and foodservice demand. U.S. dairy export value rose 15% to USD 9.63 billion in 2025, while export volume increased 4% in milk-solids-equivalent terms to 2.32 million metric tons.
Cheese and high-protein ingredients are especially important for revenue diversification. USDEC reported that U.S. cheese exports rose 20% to 613,045 metric tons in 2025, while butterfat exports reached 122,085 metric tons and high-protein whey exports rose 6% to 77,811 metric tons. This shows that export revenue is being supported by cheese, butterfat, and protein-led dairy ingredients rather than only commodity milk powder.
Financial Impact
The financial impact can be positive for processors that convert raw milk into higher-value products such as cheese, butter, whey protein, yogurt, cream, and dairy ingredients. USDA NASS reported that U.S. butter production reached 232 million pounds in March 2026, up 1.2% from March 2025, while nonfat dry milk production reached 175 million pounds, up 9.9%. These production gains can support ingredient availability, export supply, and processing plant utilization.
Financial risk remains linked to milk price cycles, feed costs, labor, cold-chain expenses, energy costs, animal disease, tariff exposure, and changing consumer demand. Dairy companies with strong export channels, diversified product lines, health-focused brands, and efficient processing capacity are better positioned to protect margins. The strongest financial resilience is expected from companies that balance commodity dairy with branded products, high-protein ingredients, foodservice demand, and international sales.
Product Analysis
Milk led the Dairy Products Market with 62.5% share, supported by its daily consumption across households, foodservice, schools, bakeries, beverages, and processed food applications. It remains the most widely used dairy product because it is consumed directly and also serves as a base ingredient for yogurt, cheese, butter, cream, desserts, infant nutrition, and nutritional drinks.
The growth of this segment can be attributed to strong demand for fresh milk, packaged milk, flavored milk, fortified milk, and value-added milk products. Consumer preference is being supported by the nutritional role of milk, including its use as a source of protein, calcium, vitamins, and energy in everyday diets.
Milk is expected to remain the leading product category as dairy consumption continues to grow in emerging economies and remains stable in mature markets. Demand is likely to be supported by rising urbanization, cold-chain expansion, organized retail growth, and increasing use of milk in processed dairy and food manufacturing.
Distribution Channel Analysis
Supermarkets and hypermarkets accounted for 45.8% share of the Dairy Products Market, supported by strong consumer preference for organized retail, product variety, quality assurance, and convenient shopping. These stores offer milk, yogurt, cheese, butter, cream, ice cream, dairy desserts, and value-added dairy products across multiple brands and price points.
The growth of this channel can be linked to better cold-chain infrastructure, visible product labeling, in-store promotions, and the availability of fresh and packaged dairy products under one roof. Consumers often prefer supermarkets and hypermarkets because they provide trusted storage conditions, easy comparison, and regular access to daily-use dairy items.
Supermarkets and hypermarkets are expected to remain a major sales channel as urban consumers continue to shift toward modern retail formats. Demand will also be supported by private-label dairy products, larger pack sizes, premium dairy ranges, health-focused products, and ready-to-consume dairy formats.
 iThe graph shows projected market growth until 2035 based on CAGR analysis. Actual outcomes may vary depending on changing demand, competition, and economic factors.To gain greater insights - request a sample report PDF
Regional Analysis
Asia Pacific led the Dairy Products Market with 35.6% share, supported by a large population base, rising income levels, growing urban demand, and strong dairy consumption across India, China, Pakistan, Japan, South Korea, and Southeast Asia. The region has a large consumer base for fresh milk, yogurt, butter, milk powder, cheese, and traditional dairy products.
The growth of Asia Pacific is being supported by higher milk production, wider cold-chain distribution, modern retail expansion, and increasing demand for packaged and branded dairy products. India remains a major dairy producer, while other regional markets are seeing rising demand for convenient, protein-rich, and value-added dairy products.
Asia Pacific is expected to remain a key growth region as consumers shift toward packaged milk, flavored dairy drinks, yogurt, cheese, and functional dairy products. Opportunities are likely to remain strong in fortified milk, premium dairy, lactose-free products, online grocery sales, and dairy products designed for health-conscious consumers.
 iThe graph shows projected market growth until 2035 based on CAGR analysis. Actual outcomes may vary depending on changing demand, competition, and economic factors.To gain greater insights - request a sample report PDF
Regional Impact Analysis
Impact Factor | Estimated CAGR Impact | Regional Relevance | Market Impact |
|---|---|---|---|
Asia Pacific market leadership | +1.5% | Asia Pacific, 35.6% share in 2025 | Leads consumption volume. |
Europe premium dairy strength | +0.9% | Germany, France, UK, Italy | Supports value-added products. |
North America cheese and yogurt demand | +0.8% | U.S. and Canada | Drives processed dairy growth. |
Latin America dairy consumption growth | +0.6% | Brazil, Mexico, Argentina, Chile | Builds steady demand. |
Middle East and Africa nutrition demand | +0.5% | GCC, South Africa, Egypt, Nigeria | Supports future expansion. |
Market Trend Analysis
Impact Factor | Estimated CAGR Impact | Regional Relevance | Market Impact |
|---|---|---|---|
Milk remains core product category | +1.2% | Asia Pacific, Europe, North America | Leads volume demand. |
Growth in probiotic and fortified dairy | +1.0% | Developed and urban markets | Supports health positioning. |
Expansion of cheese-based products | +0.8% | North America, Europe, Asia Pacific | Improves value growth. |
Premium and organic dairy adoption | +0.7% | Europe, North America | Builds higher margins. |
Online dairy delivery growth | +0.6% | Urban Asia Pacific, U.S., Europe | Improves consumer access. |
Investor Type Impact Matrix
Investor Type | Estimated CAGR Impact | Regional Relevance | Market Impact |
|---|---|---|---|
Dairy Product Manufacturers | +1.1% | Global | Expands processing capacity. |
Food and Beverage Companies | +0.9% | Asia Pacific, Europe, North America | Builds value-added products. |
Cold-Chain Logistics Investors | +0.8% | Emerging and urban markets | Supports fresh delivery. |
Private Equity Firms | +0.6% | Global | Enables business scaling. |
Retail and E-commerce Investors | +0.6% | Global | Strengthens sales channels. |
Segment Covered in the Report
By Product
Milk
Cheese
Yogurt
Butter
Cream
Others
By Distribution Channel
Supermarkets and Hypermarkets
Convenience Stores
Specialty Stores
Online
Others
By Region
Asia Pacific
North America
Europe
Middle East & Africa
Latin America
Drivers Impact Analysis
Impact Factor | Estimated CAGR Impact | Regional Relevance | Market Impact |
|---|---|---|---|
Rising demand for milk and dairy nutrition | +1.3% | Asia Pacific, Europe, North America | Drives daily consumption. |
Growth in cheese and yogurt consumption | +1.0% | North America, Europe, Asia Pacific | Supports value-added demand. |
Increasing urbanization and modern retail access | +0.9% | Asia Pacific, Latin America, Middle East | Improves product availability. |
Rising demand for protein-rich foods | +0.8% | Global | Supports dairy-based diets. |
Expansion of cold-chain distribution | +0.7% | Emerging markets | Improves product freshness. |
Restraints Impact Analysis
Impact Factor | Estimated CAGR Impact | Regional Relevance | Market Impact |
|---|---|---|---|
Lactose intolerance concerns | -0.7% | Asia Pacific, Africa, Latin America | Limits regular consumption. |
Volatility in milk procurement prices | -0.6% | Global dairy producers | Pressures margins. |
Competition from plant-based alternatives | -0.5% | North America, Europe, urban Asia | Slows some categories. |
Short shelf life of fresh dairy products | -0.5% | Emerging markets | Raises distribution risk. |
Environmental pressure on dairy farming | -0.4% | Europe, North America | Increases compliance burden. |
Opportunities Impact Analysis
Impact Factor | Estimated CAGR Impact | Regional Relevance | Market Impact |
|---|---|---|---|
Growth in functional dairy products | +1.1% | North America, Europe, Asia Pacific | Supports premium demand. |
Expansion of lactose-free dairy | +0.9% | U.S., Europe, Japan, urban Asia | Opens new consumer base. |
Rising demand for flavored milk and yogurt | +0.8% | Asia Pacific, Middle East, Latin America | Expands youth consumption. |
Growth in organic dairy products | +0.7% | Europe, North America, Australia | Builds premium value. |
Dairy product innovation in snacks and desserts | +0.6% | Global | Supports category expansion. |
Challenges Impact Analysis
Impact Factor | Estimated CAGR Impact | Regional Relevance | Market Impact |
|---|---|---|---|
Maintaining cold-chain reliability | -0.6% | Emerging and rural markets | Affects product quality. |
Managing raw milk quality | -0.5% | Global dairy supply chains | Requires strict testing. |
Price pressure in mass retail | -0.5% | Global | Reduces margin strength. |
Feed cost and farm input volatility | -0.4% | Dairy farming regions | Impacts production cost. |
Regulatory compliance for food safety | -0.4% | U.S., Europe, Asia Pacific | Raises operating burden. |
Recent Developments
March 2026, The Coca-Cola Company announced a USD 650 million expansion of its fairlife facility in Coopersville, Michigan. The project includes two additional production lines, around 245,000 square feet of expansion space, and about 150 new jobs. Commercial production from the new lines is targeted for 2028, while fairlife is also set to open a new production facility in Webster, New York in 2026.
February 2026, Arla announced a EUR 300 million, or about USD 354 million, investment through 2030 to expand cheese production at its Götene facility in Sweden. The investment will roughly double the site’s milk processing capacity to 1 million metric tons per year and increase Sweden’s cheese self-sufficiency by about 10 percentage points to 47%. This supports the shift toward localized cheese production and food security-led dairy processing.
Report Scope
Report Highlights | Details |
|---|---|
Market Revenue (2025) | USD 575.1 Billion |
Forecast Revenue (2035) | USD 919.1 Billion |
CAGR (2025-2035) | 4.8% |
Base Year for Estimation | 2025 |
Historic Data | 2020-2024 |
Forecast Period | 2025-2035 |
Report Coverage | AI market impact analysis, market surveys, trade analysis, Industry & competitive intelligence, Revenue projections, company positioning, competitive analysis, growth drivers, and emerging market trends, Strategic Consultation & Advisory Services |
Segments Covered | By Product (Milk, Cheese, Yogurt, Butter, Cream, Others), By Distribution Channel (Supermarkets and Hypermarkets, Convenience Stores, Specialty Stores, Online, Others) |
Regional Analysis | North America - US, Canada; Europe - Germany, France, The UK, Spain, Italy, Russia, Netherlands, Rest of Europe; Asia Pacific - China, Japan, South Korea, India, New Zealand, Singapore, Thailand, Vietnam, Rest of Latin America; Latin America - Brazil, Mexico, Rest of Latin America; Middle East & Africa - South Africa, Saudi Arabia, UAE, Rest of MEA |
Key companies profiled | Nestlé S.A., Danone S.A., Lactalis Group, Fonterra Co-operative Group, Arla Foods, Dairy Farmers of America, FrieslandCampina, Saputo Inc., Amul, Yili Group, Mengniu Dairy |
Customization Scope | Tailored insights for specific regions, countries, and market segments can be provided. Additional report customization is available upon request. |
Competitive Landscape
The market is characterized by intense competition among established players and emerging companies. Strategic partnerships, mergers and acquisitions, and product innovation are key strategies employed by market participants.
Key Market Players
Nestlé S.A.
Danone S.A.
Lactalis Group
Fonterra Co-operative Group
Arla Foods
Dairy Farmers of America
FrieslandCampina
Saputo Inc.
Amul
Yili Group
Mengniu Dairy
Meet the Team
This report was prepared by our expert analysts with deep industry knowledge and research experience.
Pratiksha is market research analyst with strong experience in industry research, market forecasting, and competitive analysis. She specializes in identifying market trends, evaluating growth opportunities, and preparing data-driven insights across global industries. Her work supports businesses in understanding market dynamics, customer demand, regional opportunities, and strategic investment areas.
Sayali brings more than 5 years of experience to Globe Market Research, supporting the accuracy, clarity, and relevance of research content across multiple industries. She reviews market data, segment analysis, competitive insights, and industry trends to ensure each report meets strong quality standards and provides practical value to business decision-makers. Her expertise spans healthcare, information technology, consumer goods, and diverse cross-industry domains. With a strong focus on data reliability, structured analysis, and clear presentation, Sayali helps ensure that each research output delivers well-reviewed insights for clients, investors, consultants, and industry stakeholders.
Frequently Asked Questions
Related Reports
More in Food and Beverages
Snack Food Market Size to hit USD 1,157.5 Bn by 2035
Global Snack Food Market Size, Share Analysis By Product Type (Chips and Crisps, Nuts and Seeds, Biscuits and Cookies, Popcorn, Meat Snacks, Others), By Category (Conventional Snacks, Healthy Snacks), By Distribution Channel (Supermarkets and Hypermarkets, Convenience Stores, Online, Specialty Stores, Others), By Regional Insights, Business plan and Project Report, Investment Opportunities, Profitability, Industry Trends, Leading Companies and Growth Forecasts by 2025-2035
Canned Food Market Size to Exceed USD 233.8 Billion by 2035
Global Canned Food Market Size, Share Analysis By Product Type (Canned Seafood, Canned Meat, Canned Fruits and Vegetables, Canned Ready Meals, Others), By Type (Conventional, Organic), By Distribution Channel (Supermarkets and Hypermarkets, Convenience Stores, Online, Others), By Regional Insights, Business plan and Project Report, Investment Opportunities, Profitability, Industry Trends, Leading Companies and Growth Forecasts by 2025-2035
Frozen Food Market Size to Exceed USD 596.6 Billion by 2035
Global Frozen Food Market Size, Share Analysis By Product (Frozen Desserts, Frozen Meals, Meat/Poultry/Seafood, Fruits and Vegetables, Snacks, Baked Goods), By Freezing Technology (Blast Freezing, Belt Freezing, Individual Quick Freezing, Others), By Distribution Channel (Foodservice, Retail), By Regional Insights, Business plan and Project Report, Investment Opportunities, Profitability, Industry Trends, Leading Companies and Growth Forecasts by 2025-2035
Ready-to-Eat Food Market to Exceed USD 846.5 Billion by 2035
Global Ready-to-Eat Food Market Size, Share Analysis By Product Type (Meat/Poultry, Vegetarian, Cereal-Based, Others), By Packaging (Frozen/Chilled, Canned, Retort, Others), By Distribution Channel (Hypermarkets, Convenience Stores, Online, Others), By End User (Residential, Foodservice, Institutional), By Regional Insights, Business plan and Project Report, Investment Opportunities, Profitability, Industry Trends, Leading Companies and Growth Forecasts by 2025-2035