

Revenue, 2025
$136.9 Bn
Forecast, 2035
$233.8 Bn
CAGR, 2025-2035
5.5%
Report Coverage
Global
Market Size and Forecast
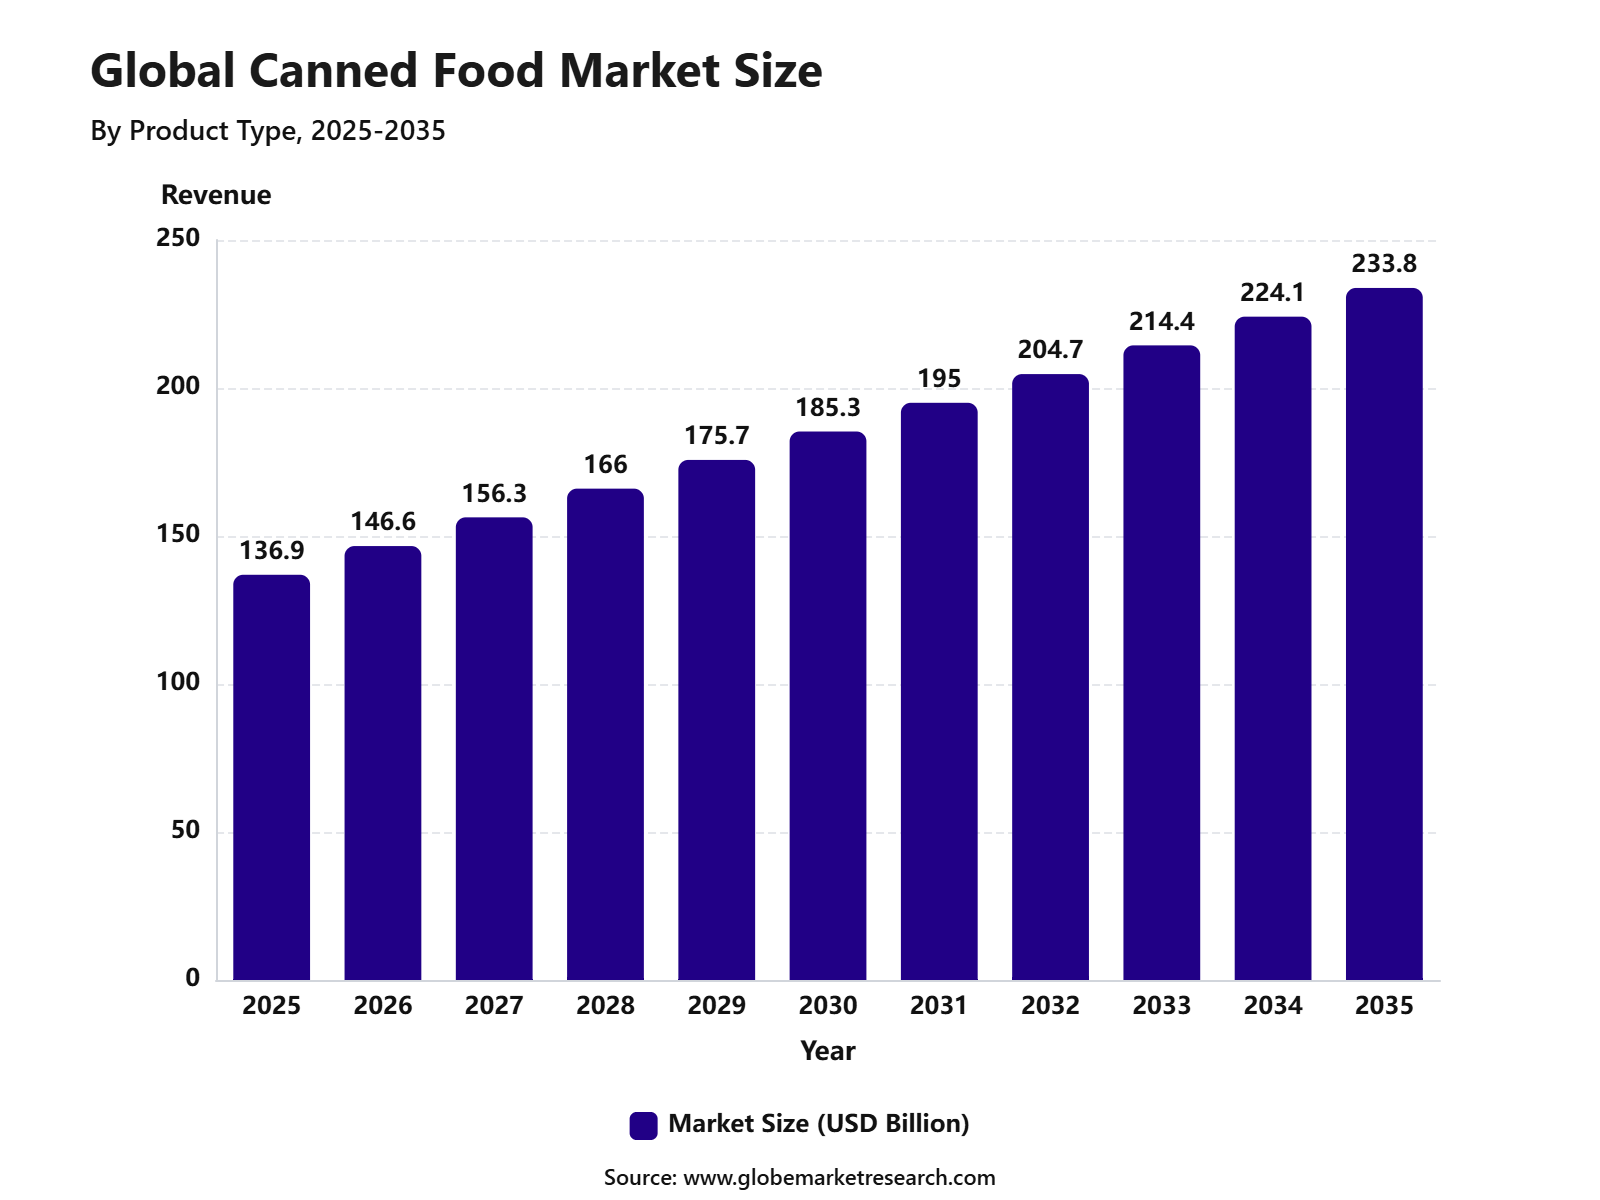
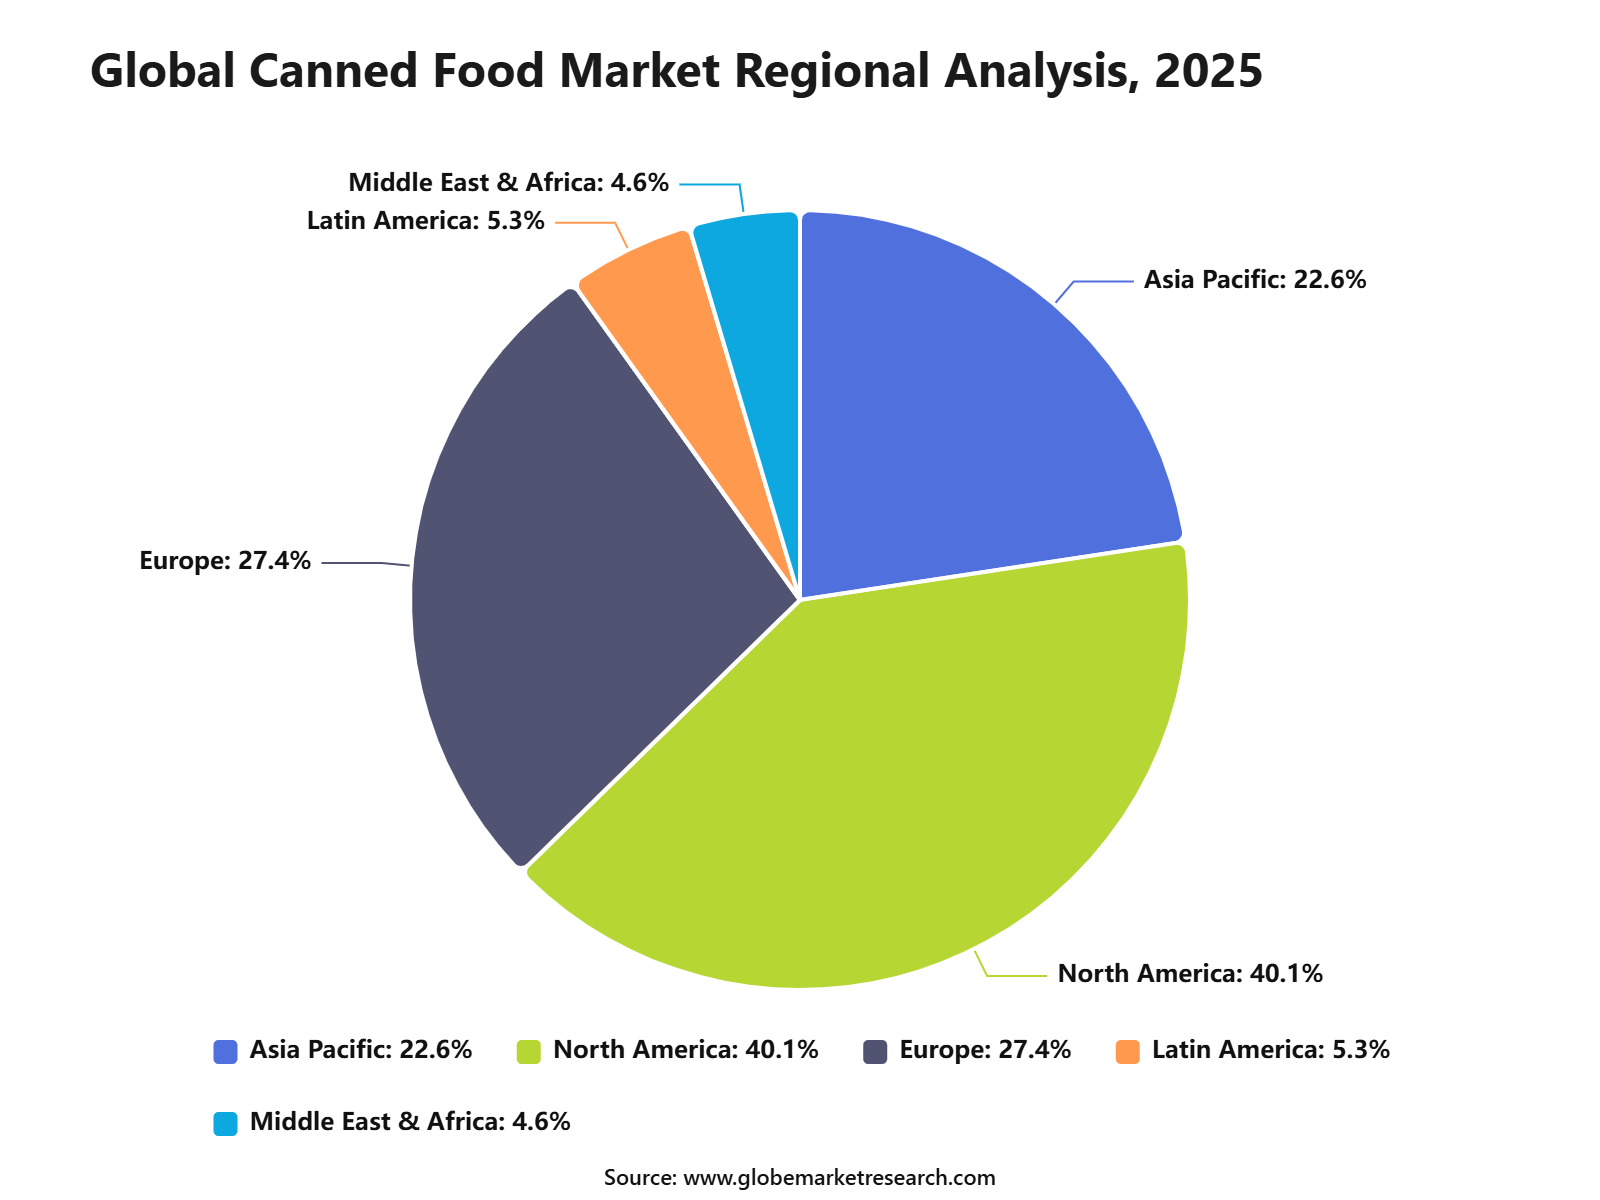
The Global Canned Food Market reached USD 136.9 billion in 2025 and is expected to grow to USD 233.8 billion by 2035, registering a CAGR of 5.5% from 2025 to 2035. North America held the largest regional share of 40.1% in 2025, supported by strong demand for canned vegetables, fruits, seafood, meat, soups, beans, ready meals, and shelf-stable food products.
The Canned Food Market includes food items preserved in sealed containers to extend shelf life, maintain safety, and reduce food spoilage. These products are widely consumed across households, foodservice outlets, supermarkets, convenience stores, emergency food supply channels, and institutional kitchens. Demand is supported by busy lifestyles, affordable pricing, easy storage, and year-round availability of seasonal food products.
 iThe graph shows projected market growth until 2035 based on CAGR analysis. Actual outcomes may vary depending on changing demand, competition, and economic factors.To gain greater insights - request a sample report PDF
The market growth can be attributed to rising demand for convenient and long-lasting food options, expansion of modern retail channels, and increasing use of canned ingredients in quick meal preparation. North America continues to lead the market due to high consumer acceptance of packaged food, strong distribution networks, and established food processing infrastructure. Improvements in canning technology, recyclable packaging, and low-sodium and organic product launches are expected to further support market expansion.
Key Market Insights
Canned seafood led the product type segment with 35.5% share, supported by strong demand for shelf-stable protein, convenient meal preparation, and longer product storage life.
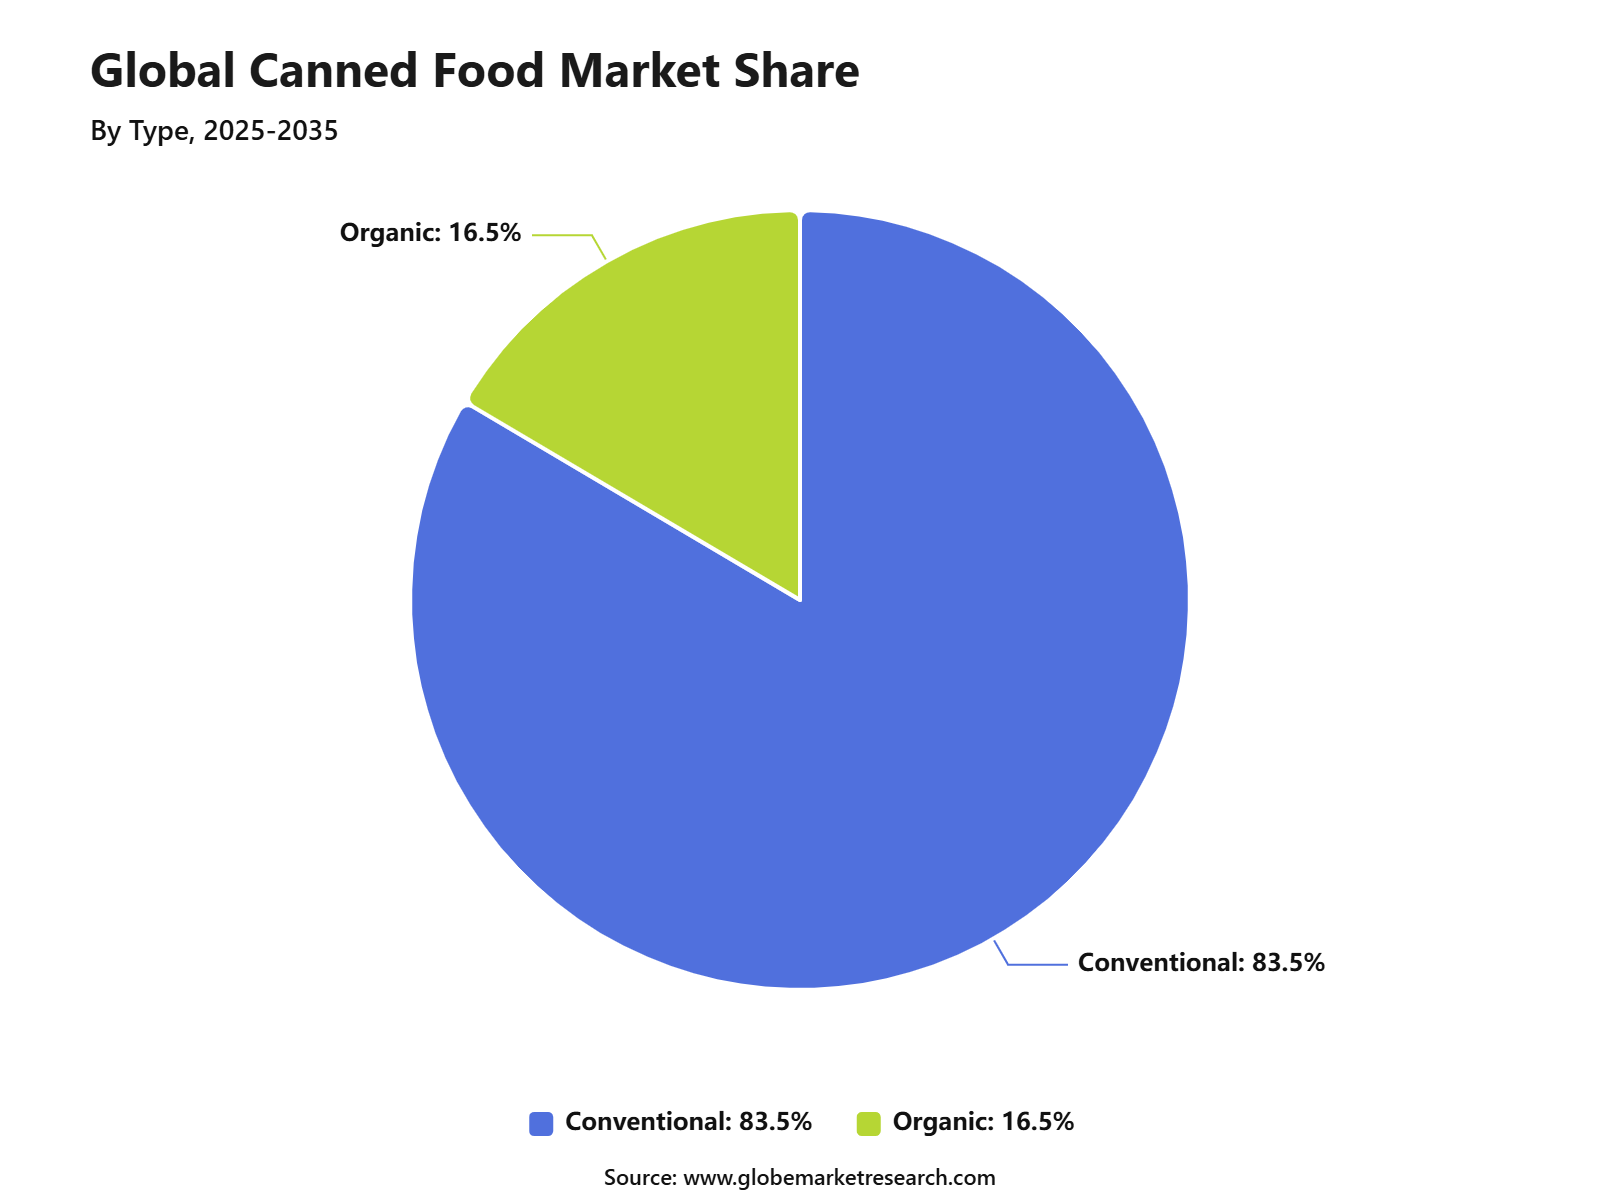
Conventional canned food accounted for 83.5% share by type, driven by broad availability, affordable pricing, and strong consumer acceptance across everyday food categories.
Supermarkets held 49.6% share by distribution channel, supported by wide product variety, organized shelf placement, promotional pricing, and high consumer footfall.
North America led the canned food market with 40.1% share, supported by high consumption of packaged food, mature retail networks, strong demand for convenient meals, and well-established food processing infrastructure.
Go-To-Market-Strategy
The Canned Food Market should be positioned through a shelf-stable, value-led, and emergency-ready go-to-market strategy in 2026, as consumers continue to manage grocery budgets while looking for convenient meal solutions. Food-at-home prices increased 2.7% year over year in May 2026, while food-away-from-home prices increased 3.5%, making canned soups, vegetables, fruits, beans, seafood, meat, sauces, and ready meals attractive for affordable home eating.
Strong distribution should be built across supermarkets, hypermarkets, discount stores, convenience stores, online grocery, foodservice suppliers, and institutional channels. Product strategy should focus on pantry reliability, nutrition, portion control, long shelf life, and easy meal preparation. Canned vegetables, fruits, beans, tuna, salmon, soups, pasta sauces, and meat products can be marketed for weekly cooking, emergency storage, student housing, low-waste kitchens, and quick family meals.
Risk Factors & Market Barriers
The major risk in the Canned Food Market is packaging cost pressure, especially for tinplate steel and aluminum cans. In 2026, U.S. metal tariffs continued to raise packaging costs for domestic can manufacturers, creating pressure across canned vegetables, soups, beans, seafood, fruits, and ready meals. If packaging costs rise faster than retail pricing, producers may face lower margins, smaller promotional budgets, and higher shelf prices for consumers.
Food safety, labeling accuracy, and can integrity are also critical barriers. USDA guidance states that shelf-stable canned foods must be stored correctly, while cans with bulging, leakage, rust, or serious dents should not be used due to potential safety risks. Recalls, allergen errors, damaged cans, contamination concerns, and poor storage conditions can reduce consumer trust and create financial losses across production, warehousing, distribution, and retail.
Revenue Potential Analysis
Revenue Landscape Across
Revenue opportunities across the Canned Food Market are spread across vegetables, fruits, beans, tomatoes, soups, seafood, meat, pasta meals, sauces, and ready-to-eat canned meals. Canned beans, tomatoes, tuna, salmon, pumpkin, beets, and fruit are gaining relevance because they combine nutrition, convenience, and affordability. Public health-focused consumer content in 2026 continues to recommend several canned products, such as beans, tomatoes, pumpkin, beets, fruit, and salmon, as practical choices when lower-sodium and no-added-sugar options are selected.
Across channels, retail shelves remain the core revenue base because canned foods are easy to store, display, transport, and promote. Foodservice, schools, hospitals, military supply, disaster relief, and institutional kitchens also create stable demand due to long shelf life and bulk usage. The strongest revenue opportunities are expected in private-label canned food, value packs, ethnic meal solutions, low-sodium products, canned seafood, plant-based protein foods, and ready-to-heat canned meals.
Financial Impact
The financial impact of the Canned Food Market in 2026 will depend on raw material costs, can prices, freight, labor, energy, and retailer pricing power. FAO reported that the Food Price Index averaged 130.8 points in May 2026, while cereal and sugar prices increased during the month, creating cost pressure for canned soups, sauces, fruit products, pasta meals, and sweetened canned items. FRED data also showed the U.S. Producer Price Index for canned vegetables and juices at 264.562 in April 2026, indicating that processed canned food input and production costs remain elevated.
Profitability can be improved through efficient can sourcing, automation, larger production runs, private-label manufacturing, and better inventory planning. Canned foods can support stable cash flow because they have longer shelf life than chilled and fresh foods, which helps reduce spoilage and improve stock rotation. The strongest financial returns are expected for companies that combine affordable pricing, trusted safety standards, recyclable packaging, clean-label formulations, and strong placement in high-frequency grocery channels.
Product Type Analysis
Canned seafood led the Canned Food Market with 35.5% share, supported by strong demand for tuna, salmon, sardines, mackerel, crab, shrimp, and other shelf-stable seafood products. These products are widely used because they provide convenience, longer storage life, easy meal preparation, and access to seafood without the need for cold-chain storage before opening.
The growth of this segment can be attributed to rising demand for protein-rich and ready-to-eat food options. Canned seafood is used in sandwiches, salads, pasta, rice dishes, snacks, and household emergency food storage, which supports steady demand across residential and foodservice users.
Canned seafood is expected to remain a key product type as consumers continue to seek affordable, convenient, and nutrient-dense packaged foods. Demand will also be supported by improved packaging formats, easy-open cans, premium seafood products, private-label offerings, and wider supermarket availability.
Type Analysis
Conventional canned food accounted for 83.5% share, making it the leading type segment. The segment is supported by broad availability, competitive pricing, established supply chains, and strong consumer familiarity with traditional canned vegetables, fruits, seafood, meat, soups, beans, sauces, and ready meals.
The growth of conventional canned food can be linked to its practical value in daily household cooking and long-term pantry storage. Consumers continue to buy conventional canned products because they are affordable, easy to store, and available across a wide range of food categories.
Conventional canned food is expected to maintain its leading position due to strong demand from price-sensitive consumers and mass retail channels. However, brands are also improving product appeal through lower-sodium variants, clean-label claims, better ingredients, recyclable packaging, and premium canned product lines.
 iThe graph shows projected market growth until 2035 based on CAGR analysis. Actual outcomes may vary depending on changing demand, competition, and economic factors.To gain greater insights - request a sample report PDF
Distribution Channel Analysis
Supermarkets held 49.6% share of the Canned Food Market, supported by strong consumer preference for organized retail, wide product variety, visible pricing, and easy comparison between brands. Supermarkets offer canned seafood, canned vegetables, canned fruits, soups, sauces, beans, meat products, and ready-to-eat meals under one roof.
The growth of this channel can be attributed to high grocery footfall, strong shelf visibility, private-label expansion, and promotional pricing. Consumers often prefer supermarkets because canned foods are commonly purchased with regular groceries and can be easily stocked for future use.
Supermarkets are expected to remain the leading channel as consumers continue to rely on packaged pantry products for convenience and affordability. Demand will also be supported by larger pack sizes, multi-buy offers, private-label canned foods, premium shelf-stable products, and improved in-store merchandising.
Regional Analysis
North America led the Canned Food Market with 40.1% share, supported by high consumption of packaged foods, mature supermarket networks, strong demand for shelf-stable meals, and high household use of canned seafood, vegetables, soups, beans, fruits, and sauces. The region has a well-developed food retail system and strong consumer familiarity with canned food formats.
The growth of North America is being supported by busy lifestyles, pantry stocking behavior, demand for affordable meal solutions, and continued preference for convenient food products. Canned foods remain important because they reduce preparation time, offer long storage life, and support household food planning.
North America is expected to remain a leading regional market due to its strong grocery infrastructure and high packaged food penetration. Opportunities are likely to remain strong in canned seafood, low-sodium canned products, organic and premium canned foods, recyclable packaging, and private-label supermarket offerings.
 iThe graph shows projected market growth until 2035 based on CAGR analysis. Actual outcomes may vary depending on changing demand, competition, and economic factors.To gain greater insights - request a sample report PDF
Regional Impact Analysis
Impact Factor | Estimated CAGR Impact | Regional Relevance | Market Impact |
|---|---|---|---|
North America market leadership | +1.7% | North America, 40.1% share in 2025 | Leads canned food demand. |
Europe steady packaged food adoption | +1.0% | Germany, UK, France, Italy | Supports quality products. |
Asia Pacific urban retail expansion | +1.1% | China, Japan, India, Southeast Asia | Drives future volume. |
Latin America affordable food demand | +0.6% | Brazil, Mexico, Chile, Colombia | Builds gradual growth. |
Middle East and Africa shelf-stable demand | +0.5% | GCC, South Africa, Egypt | Supports pantry purchases. |
Market Trend Analysis
Impact Factor | Estimated CAGR Impact | Regional Relevance | Market Impact |
|---|---|---|---|
Canned seafood category growth | +1.3% | North America, Europe, Japan | Leads product demand. |
Conventional canned food strength | +1.1% | Global | Supports mass consumption. |
Supermarket channel dominance | +1.0% | North America, Europe, Asia Pacific | Drives retail volume. |
Low-sodium and healthier canned options | +0.8% | U.S., Canada, Europe | Improves consumer appeal. |
Sustainable and recyclable packaging | +0.7% | Europe, North America | Builds brand trust. |
Investor Type Impact Matrix
Investor Type | Estimated CAGR Impact | Regional Relevance | Market Impact |
|---|---|---|---|
Canned Food Manufacturers | +1.3% | Global | Expands production capacity. |
Seafood Processing Companies | +1.1% | North America, Europe, Asia Pacific | Drives category growth. |
Retail and Grocery Chains | +0.9% | Global | Strengthens shelf availability. |
Packaging Material Investors | +0.8% | North America, Europe, Asia Pacific | Supports can innovation. |
Private Equity Firms | +0.7% | North America, Europe, Asia Pacific | Enables brand scaling. |
Segment Covered in the Report
By Product Type
Canned Seafood
Canned Meat
Canned Fruits and Vegetables
Canned Ready Meals
Others
By Type
Conventional
Organic
By Distribution Channel
Supermarkets and Hypermarkets
Convenience Stores
Online
Others
By Region
Asia Pacific
North America
Europe
Middle East & Africa
Latin America
Drivers Impact Analysis
Impact Factor | Estimated CAGR Impact | Regional Relevance | Market Impact |
|---|---|---|---|
Rising demand for shelf-stable food | +1.4% | North America, Europe, Asia Pacific | Drives regular consumption. |
Growth in canned seafood consumption | +1.2% | North America, Europe, Japan | Supports category demand. |
Increasing need for convenient meal solutions | +1.0% | Global urban markets | Expands household usage. |
Strong supermarket and retail availability | +0.9% | North America, Europe, Asia Pacific | Improves product access. |
Longer shelf life and reduced food waste | +0.8% | Global | Supports bulk buying. |
Restraints Impact Analysis
Impact Factor | Estimated CAGR Impact | Regional Relevance | Market Impact |
|---|---|---|---|
Health concerns over sodium content | -0.8% | North America, Europe, urban Asia | Limits frequent use. |
Consumer preference for fresh food | -0.7% | Global | Restricts repeat purchases. |
Metal packaging cost volatility | -0.6% | Global manufacturers | Pressures margins. |
Concerns over preservatives and additives | -0.5% | Developed markets | Affects product trust. |
Competition from frozen and chilled foods | -0.5% | North America, Europe, Asia Pacific | Limits category growth. |
Opportunities Impact Analysis
Impact Factor | Estimated CAGR Impact | Regional Relevance | Market Impact |
|---|---|---|---|
Growth in canned seafood products | +1.3% | North America, Europe, Asia Pacific | Builds high-value demand. |
Expansion of organic canned foods | +1.1% | U.S., Canada, Europe | Supports premium sales. |
Rising demand for ready-to-eat canned meals | +0.9% | Global urban markets | Improves convenience appeal. |
Growth in recyclable metal packaging | +0.8% | North America, Europe | Supports sustainability goals. |
Online grocery expansion | +0.7% | Developed and urban markets | Improves digital sales. |
Challenges Impact Analysis
Impact Factor | Estimated CAGR Impact | Regional Relevance | Market Impact |
|---|---|---|---|
Maintaining nutrition and taste quality | -0.7% | Global | Affects consumer loyalty. |
Managing packaging material costs | -0.6% | Global producers | Reduces margin strength. |
Food safety and sterilization compliance | -0.5% | North America, Europe, Asia Pacific | Raises operating burden. |
Product perception as less fresh | -0.5% | Developed markets | Slows premium adoption. |
Supply chain pressure for seafood and vegetables | -0.4% | Global | Impacts product availability. |
Recent Developments
March 2026: Conagra Brands, Inc. reported that its Grocery & Snacks segment reached USD 1.2 billion in quarterly net sales, while organic net sales increased 1.8%. The company noted pricing pressure and inflation impact in its canned products portfolio, showing that canned food pricing and input costs remained important operational factors in 2026.
March 2026: Del Monte Foods, Inc. saw a major ownership and portfolio shift after Fresh Del Monte completed the acquisition of select Del Monte Foods assets for about USD 285 million. The deal included Del Monte and S&W packaged vegetable brands, Contadina packaged tomato brands, four U.S. facilities, two Mexico manufacturing facilities, and one Venezuela operation, strengthening packaged and shelf-stable food operations.
Report Scope
Report Highlights | Details |
|---|---|
Market Revenue (2025) | USD 136.9 Billion |
Forecast Revenue (2035) | USD 233.8 Billion |
CAGR (2025-2035) | 5.5% |
Base Year for Estimation | 2025 |
Historic Data | 2020-2024 |
Forecast Period | 2025-2035 |
Report Coverage | AI market impact analysis, market surveys, trade analysis, Industry & competitive intelligence, Revenue projections, company positioning, competitive analysis, growth drivers, and emerging market trends, Strategic Consultation & Advisory Services |
Segments Covered | By Product Type (Canned Seafood, Canned Meat, Canned Fruits and Vegetables, Canned Ready Meals, Others), By Type (Conventional, Organic), By Distribution Channel (Supermarkets and Hypermarkets, Convenience Stores, Online, Others) |
Regional Analysis | North America - US, Canada; Europe - Germany, France, The UK, Spain, Italy, Russia, Netherlands, Rest of Europe; Asia Pacific - China, Japan, South Korea, India, New Zealand, Singapore, Thailand, Vietnam, Rest of Latin America; Latin America - Brazil, Mexico, Rest of Latin America; Middle East & Africa - South Africa, Saudi Arabia, UAE, Rest of MEA |
Key companies profiled | Conagra Brands, Inc., Del Monte Foods, Inc., The Kraft Heinz Company, Campbell Soup Company, General Mills, Inc., Nestlé S.A., Bolton Group, Thai Union Group, Bonduelle Group, and JBS S.A. |
Customization Scope | Tailored insights for specific regions, countries, and market segments can be provided. Additional report customization is available upon request. |
Competitive Landscape
The market is characterized by intense competition among established players and emerging companies. Strategic partnerships, mergers and acquisitions, and product innovation are key strategies employed by market participants.
Key Market Players
Conagra Brands, Inc.
Del Monte Foods, Inc.
The Kraft Heinz Company
Campbell Soup Company
General Mills, Inc.
Nestlé S.A.
Bolton Group
Thai Union Group
Bonduelle Group
JBS S.A
Other Key Players
Meet the Team
This report was prepared by our expert analysts with deep industry knowledge and research experience.
Pratiksha is market research analyst with strong experience in industry research, market forecasting, and competitive analysis. She specializes in identifying market trends, evaluating growth opportunities, and preparing data-driven insights across global industries. Her work supports businesses in understanding market dynamics, customer demand, regional opportunities, and strategic investment areas.
Sayali brings more than 5 years of experience to Globe Market Research, supporting the accuracy, clarity, and relevance of research content across multiple industries. She reviews market data, segment analysis, competitive insights, and industry trends to ensure each report meets strong quality standards and provides practical value to business decision-makers. Her expertise spans healthcare, information technology, consumer goods, and diverse cross-industry domains. With a strong focus on data reliability, structured analysis, and clear presentation, Sayali helps ensure that each research output delivers well-reviewed insights for clients, investors, consultants, and industry stakeholders.
Frequently Asked Questions
Related Reports
More in Food and Beverages
Snack Food Market Size to hit USD 1,157.5 Bn by 2035
Global Snack Food Market Size, Share Analysis By Product Type (Chips and Crisps, Nuts and Seeds, Biscuits and Cookies, Popcorn, Meat Snacks, Others), By Category (Conventional Snacks, Healthy Snacks), By Distribution Channel (Supermarkets and Hypermarkets, Convenience Stores, Online, Specialty Stores, Others), By Regional Insights, Business plan and Project Report, Investment Opportunities, Profitability, Industry Trends, Leading Companies and Growth Forecasts by 2025-2035
Frozen Food Market Size to Exceed USD 596.6 Billion by 2035
Global Frozen Food Market Size, Share Analysis By Product (Frozen Desserts, Frozen Meals, Meat/Poultry/Seafood, Fruits and Vegetables, Snacks, Baked Goods), By Freezing Technology (Blast Freezing, Belt Freezing, Individual Quick Freezing, Others), By Distribution Channel (Foodservice, Retail), By Regional Insights, Business plan and Project Report, Investment Opportunities, Profitability, Industry Trends, Leading Companies and Growth Forecasts by 2025-2035
Ready-to-Eat Food Market to Exceed USD 846.5 Billion by 2035
Global Ready-to-Eat Food Market Size, Share Analysis By Product Type (Meat/Poultry, Vegetarian, Cereal-Based, Others), By Packaging (Frozen/Chilled, Canned, Retort, Others), By Distribution Channel (Hypermarkets, Convenience Stores, Online, Others), By End User (Residential, Foodservice, Institutional), By Regional Insights, Business plan and Project Report, Investment Opportunities, Profitability, Industry Trends, Leading Companies and Growth Forecasts by 2025-2035
Cereals and Grains Market to Exceed USD 1,928.1 Billion by 2035
Global Cereals and Grains Market Size, Share Analysis By Product Type (Wheat, Rice, Maize, Barley, Oats, Sorghum, Others), By Application (Food and Beverage, Animal Feed, Biofuel, Industrial Use, Others), By Form (Whole Grain, Flour, Processed Grain, Others), By Distribution Channel (Direct Sales, Wholesalers and Distributors, Retail, Online), By Regional Insights, Business plan and Project Report, Investment Opportunities, Profitability, Industry Trends, Leading Companies and Growth Forecasts by 2025-2035