

Revenue, 2025
$ 9.3 billion
Forecast, 2035
$ 93.5 billion
CAGR, 2025-2035
25.9%
Report Coverage
Global
Market Size and Forecast
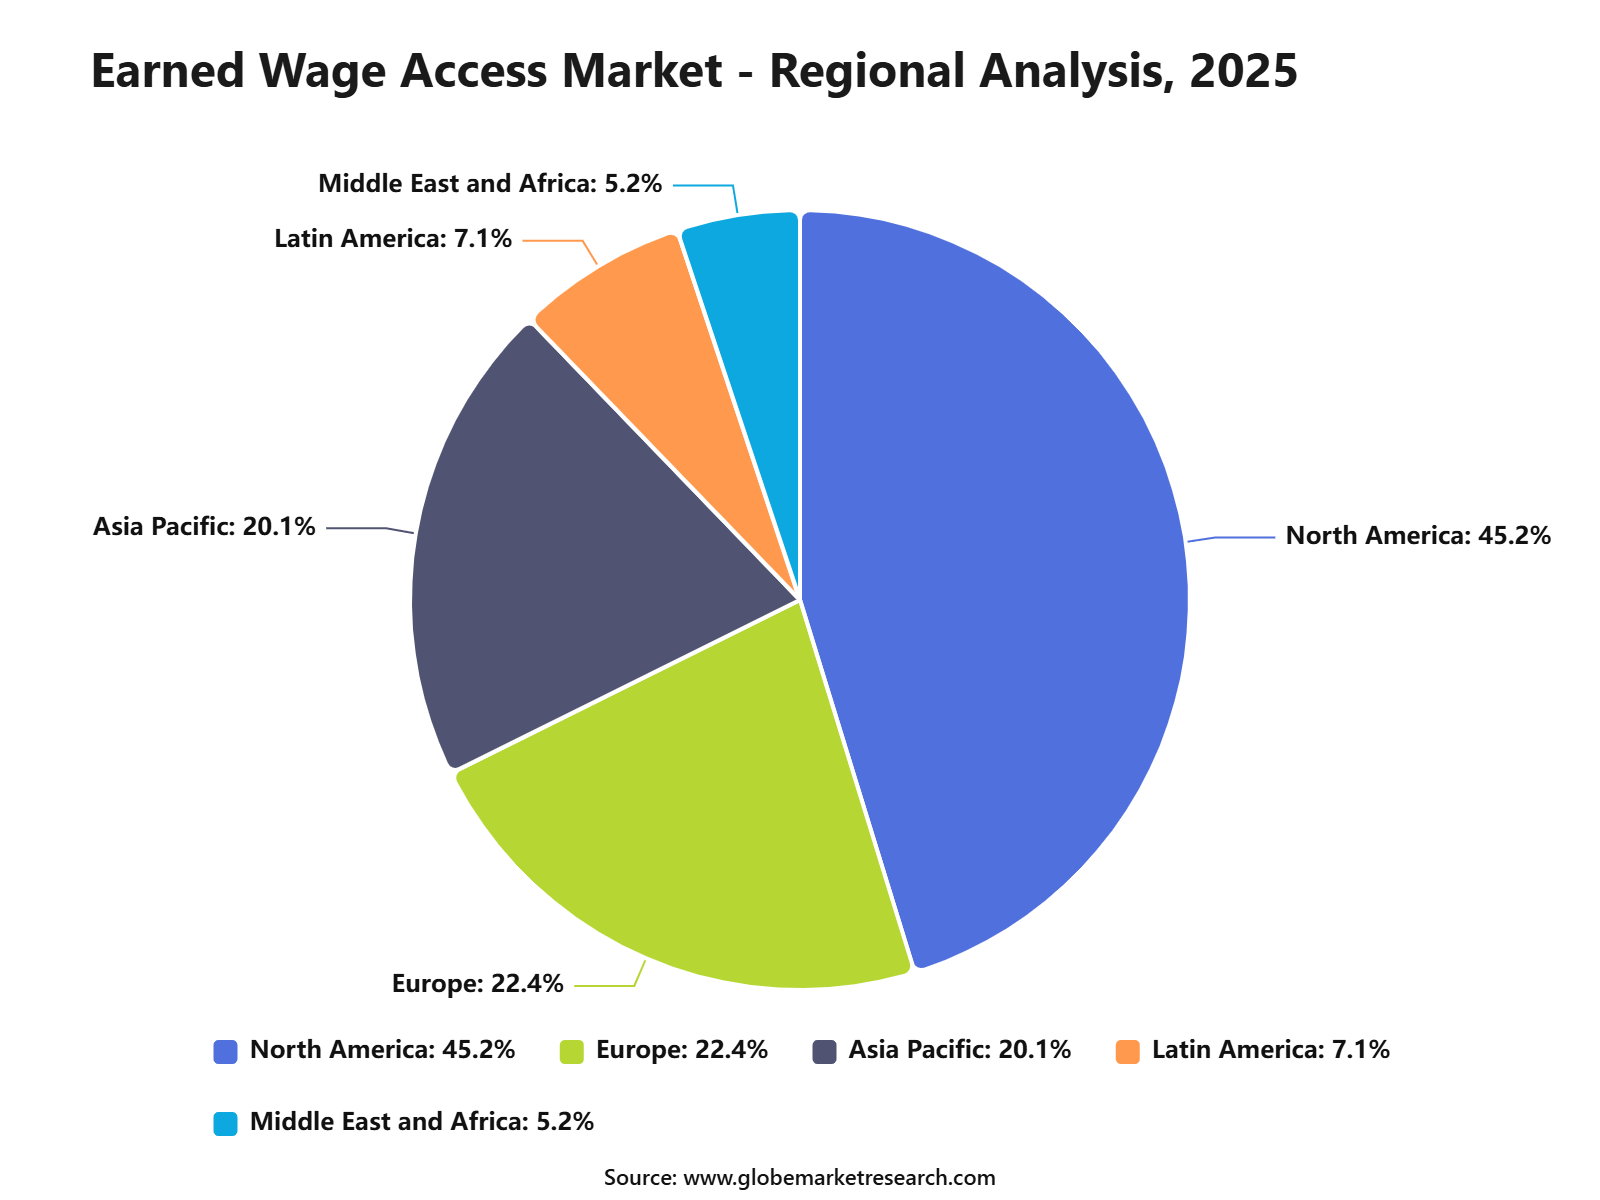
The Global Earned Wage Access Market was worth USD 9.3 billion in 2025 and is expected to reach USD 93.5 billion by 2035, growing at a CAGR of 25.9% from 2025 to 2035. North America held the largest regional share of 45.2% in 2025, supported by strong fintech adoption, rising employer focus on financial wellness, high use of digital payroll systems, and growing demand for flexible wage access among hourly and salaried workers.
The Earned Wage Access Market includes platforms and services that allow employees to access a portion of their earned wages before the scheduled payday. These solutions are commonly offered through employers, payroll providers, fintech companies, and workforce management platforms. The market is closely linked with payroll technology, employee benefits, digital payments, financial wellness programs, and real-time wage disbursement systems.
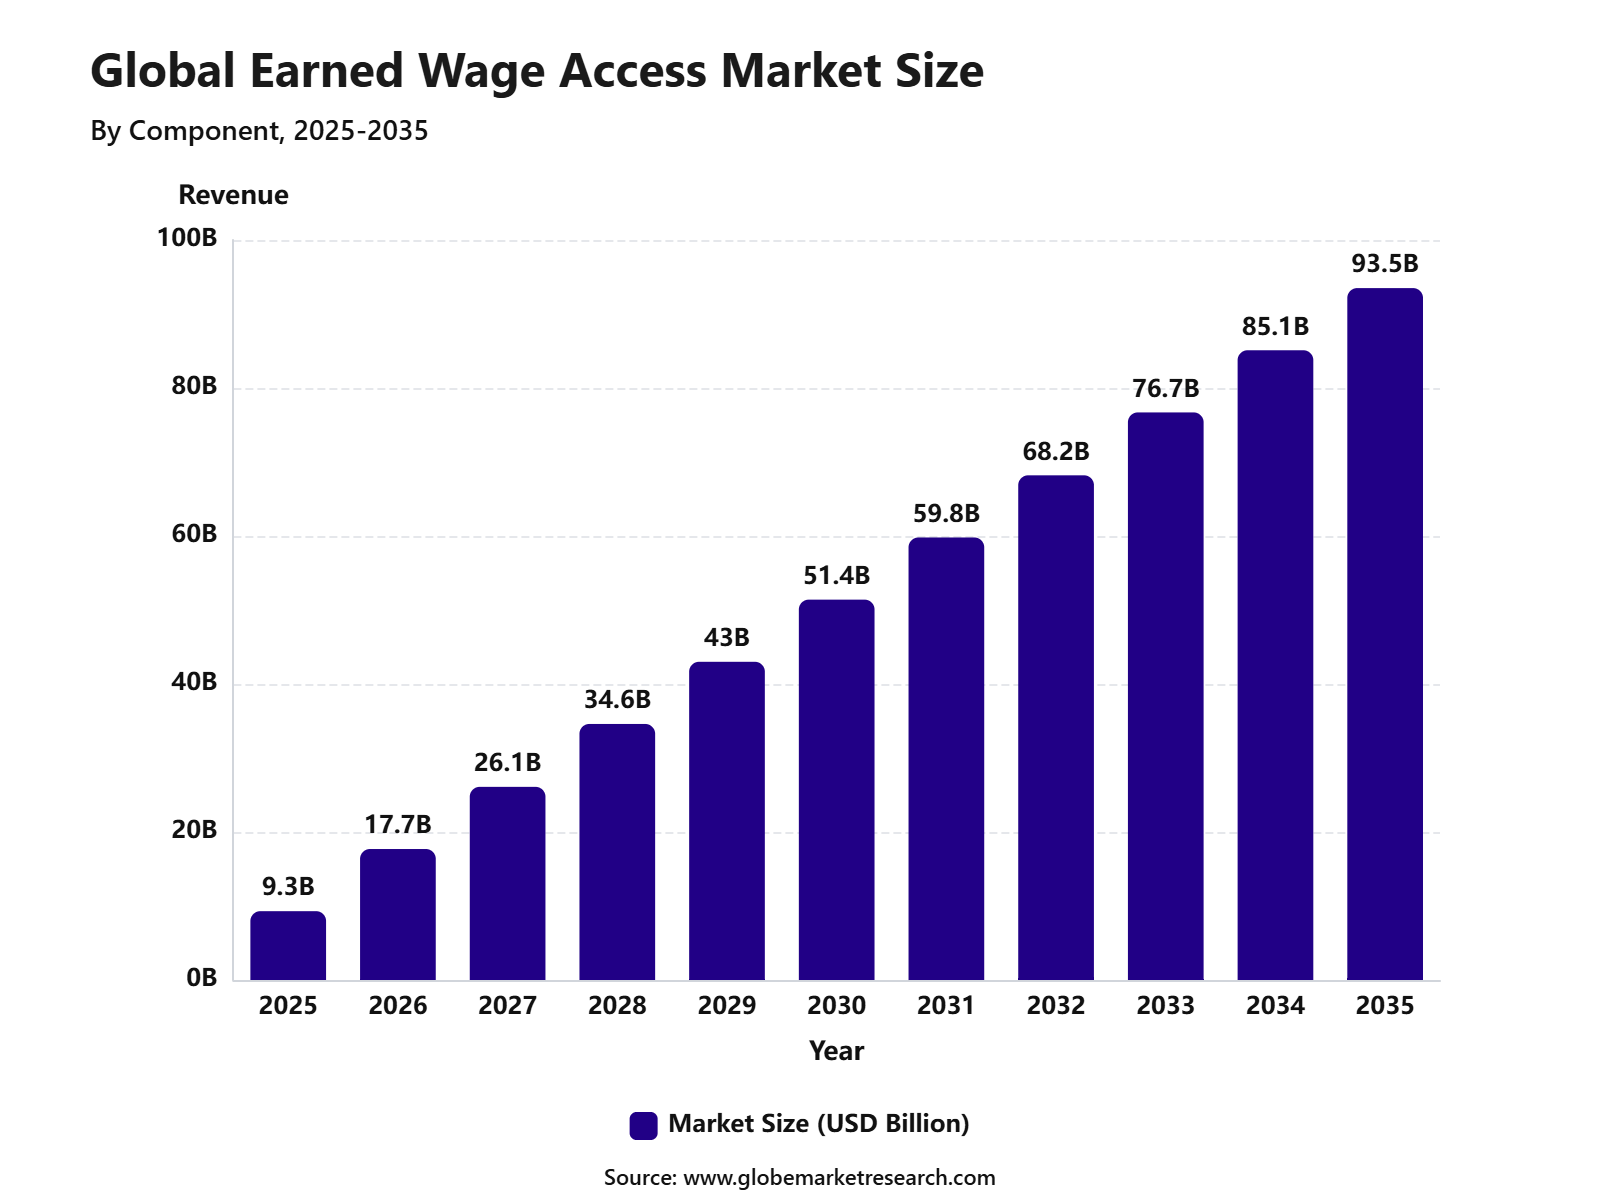 iThe graph shows projected market growth until 2035 based on CAGR analysis. Actual outcomes may vary depending on changing demand, competition, and economic factors.To gain greater insights - request a sample report PDF
The market outlook remains strong as employers increasingly use earned wage access to improve employee retention, reduce financial stress, and support workforce satisfaction. Growth can be attributed to rising living costs, increasing demand for faster payment options, and wider adoption of app-based payroll solutions. The expansion of employer-integrated EWA platforms, instant payment infrastructure, and compliant wage access models is expected to support long-term market growth.
Report Highlights | Details |
|---|---|
Market Revenue (2025) | USD 9.3 billion |
Forecast Revenue (2035) | USD 93.5 billion |
CAGR (2025-2035) | 25.9% |
Base Year for Estimation | 2025 |
Historic Data | 2020-2024 |
Forecast Period | 2025-2035 |
Key Market Insights
Solutions led the component segment with 63.4% share, supported by strong demand for wage access platforms, payroll integration tools, employee financial wellness features, and real-time payment management.
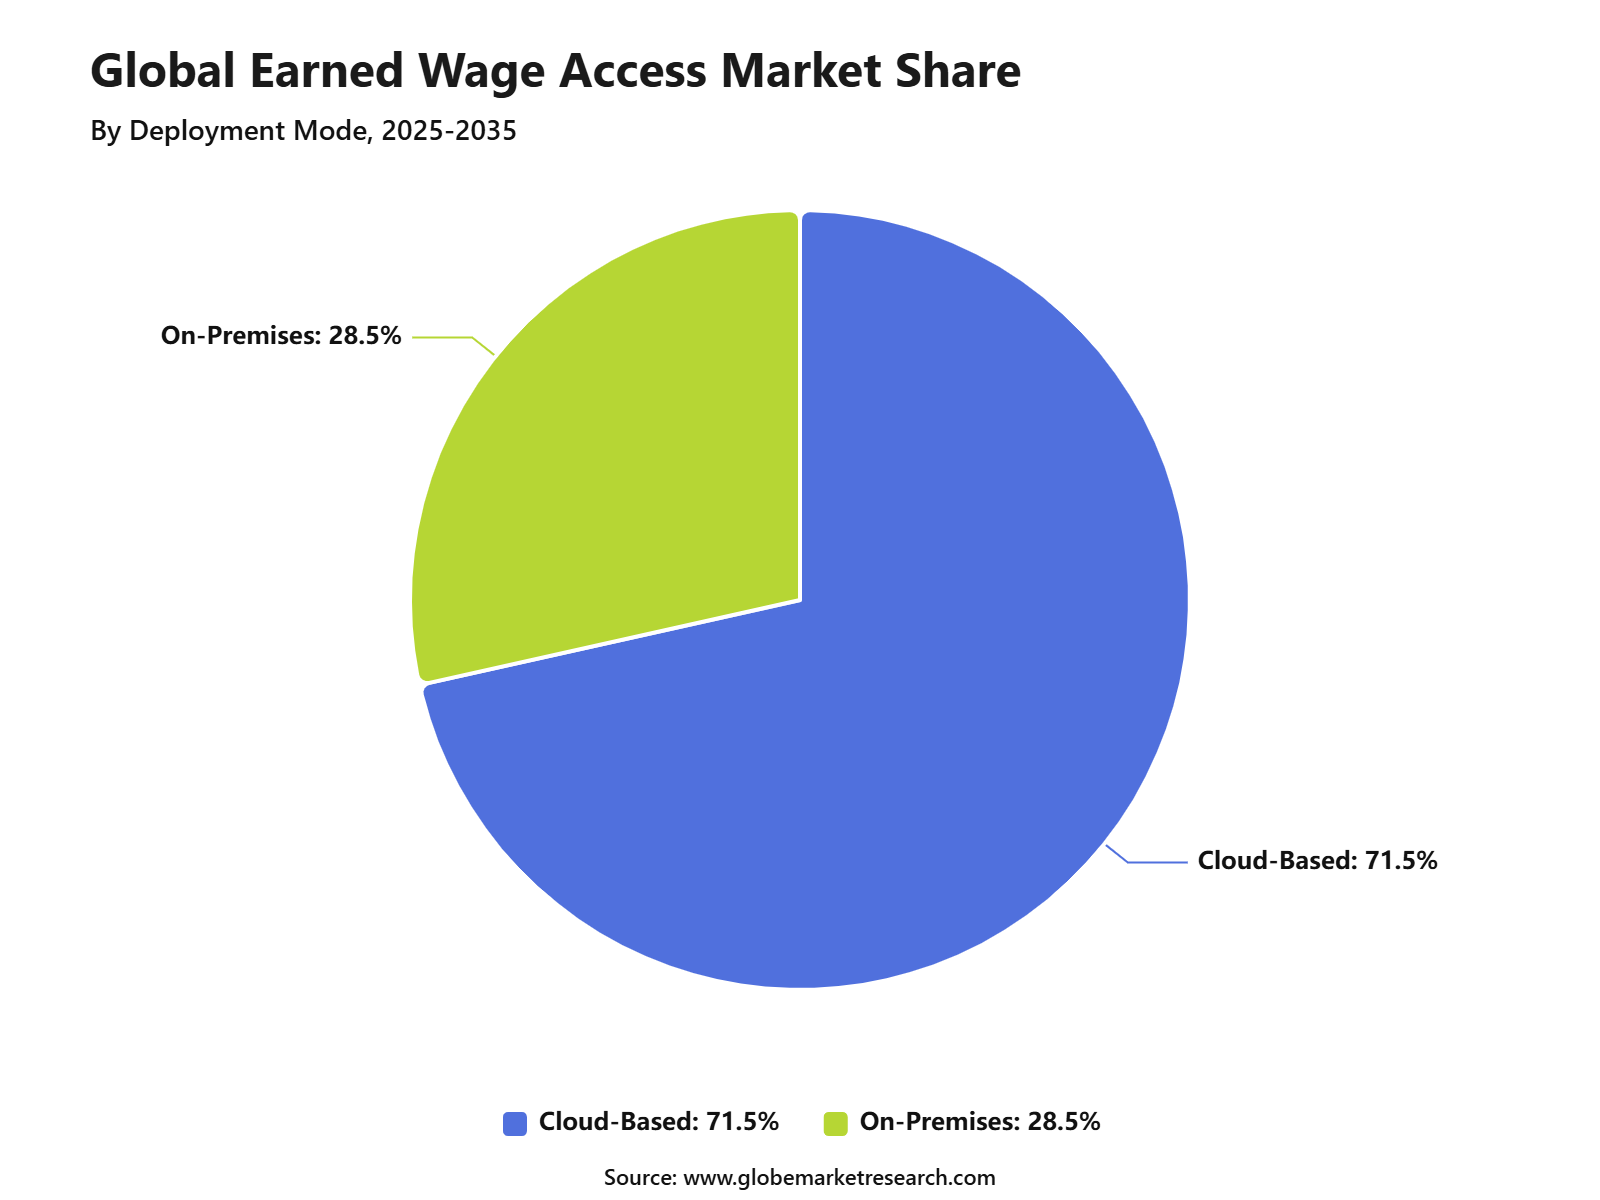
Cloud-based deployment accounted for 71.5% share, driven by easier scalability, faster implementation, lower infrastructure cost, and smooth integration with HR and payroll systems.
Employer-integrated EWA held 69.3% share by access type, supported by direct payroll connectivity, stronger compliance control, and wider adoption among organized employers.
Employee transaction fee pricing captured 43.8% share, driven by its simple usage-based model and suitability for employees seeking flexible access to earned wages.
Large enterprises represented 59.3% share by end user, supported by large workforce size, stronger HR technology budgets, and rising focus on employee retention and financial wellness.
North America led the earned wage access market with 45.2% share, supported by advanced payroll infrastructure, strong fintech adoption, and growing employer focus on flexible pay benefits.
How AI Impacts the Earned Wage Access Market?
AI is improving the Earned Wage Access Market by making wage access faster, safer, and more connected with payroll data. EWA allows workers to access already earned wages before scheduled payday, and AI helps providers calculate eligible amounts using time, attendance, payroll, identity, and transaction data. This is important because the CFPB noted that many U.S. private businesses still use biweekly, semimonthly, or monthly pay periods, creating a cash-flow gap between hours worked and wages received.
AI is also improving demand forecasting and employee-level personalization. PwC’s 2026 Employee Financial Wellness Survey found that 59% of workers are currently stressed about their finances, 53% have less than USD 5,000 in emergency savings, and 30% have less than USD 1,000 . These figures show why AI-led EWA tools are being positioned as part of financial wellness, not only as early pay access. AI can recommend responsible withdrawal amounts, savings prompts, bill-timing alerts, and budgeting support based on employee cash-flow patterns.
AI is strengthening employer adoption by reducing manual payroll work. In 2026, ADP reported that 94% of organizations in its India payroll research use payroll data for workforce decisions, 96% are planning or adopting AI -enabled payroll capabilities, and 1 in 2 companies are prioritizing payroll transparency and governance. This supports the use of AI in EWA because accurate payroll data, real-time wage calculation, and strong governance are needed before earned wage access can be offered at scale.
EWA Adoption and Usage Statistics
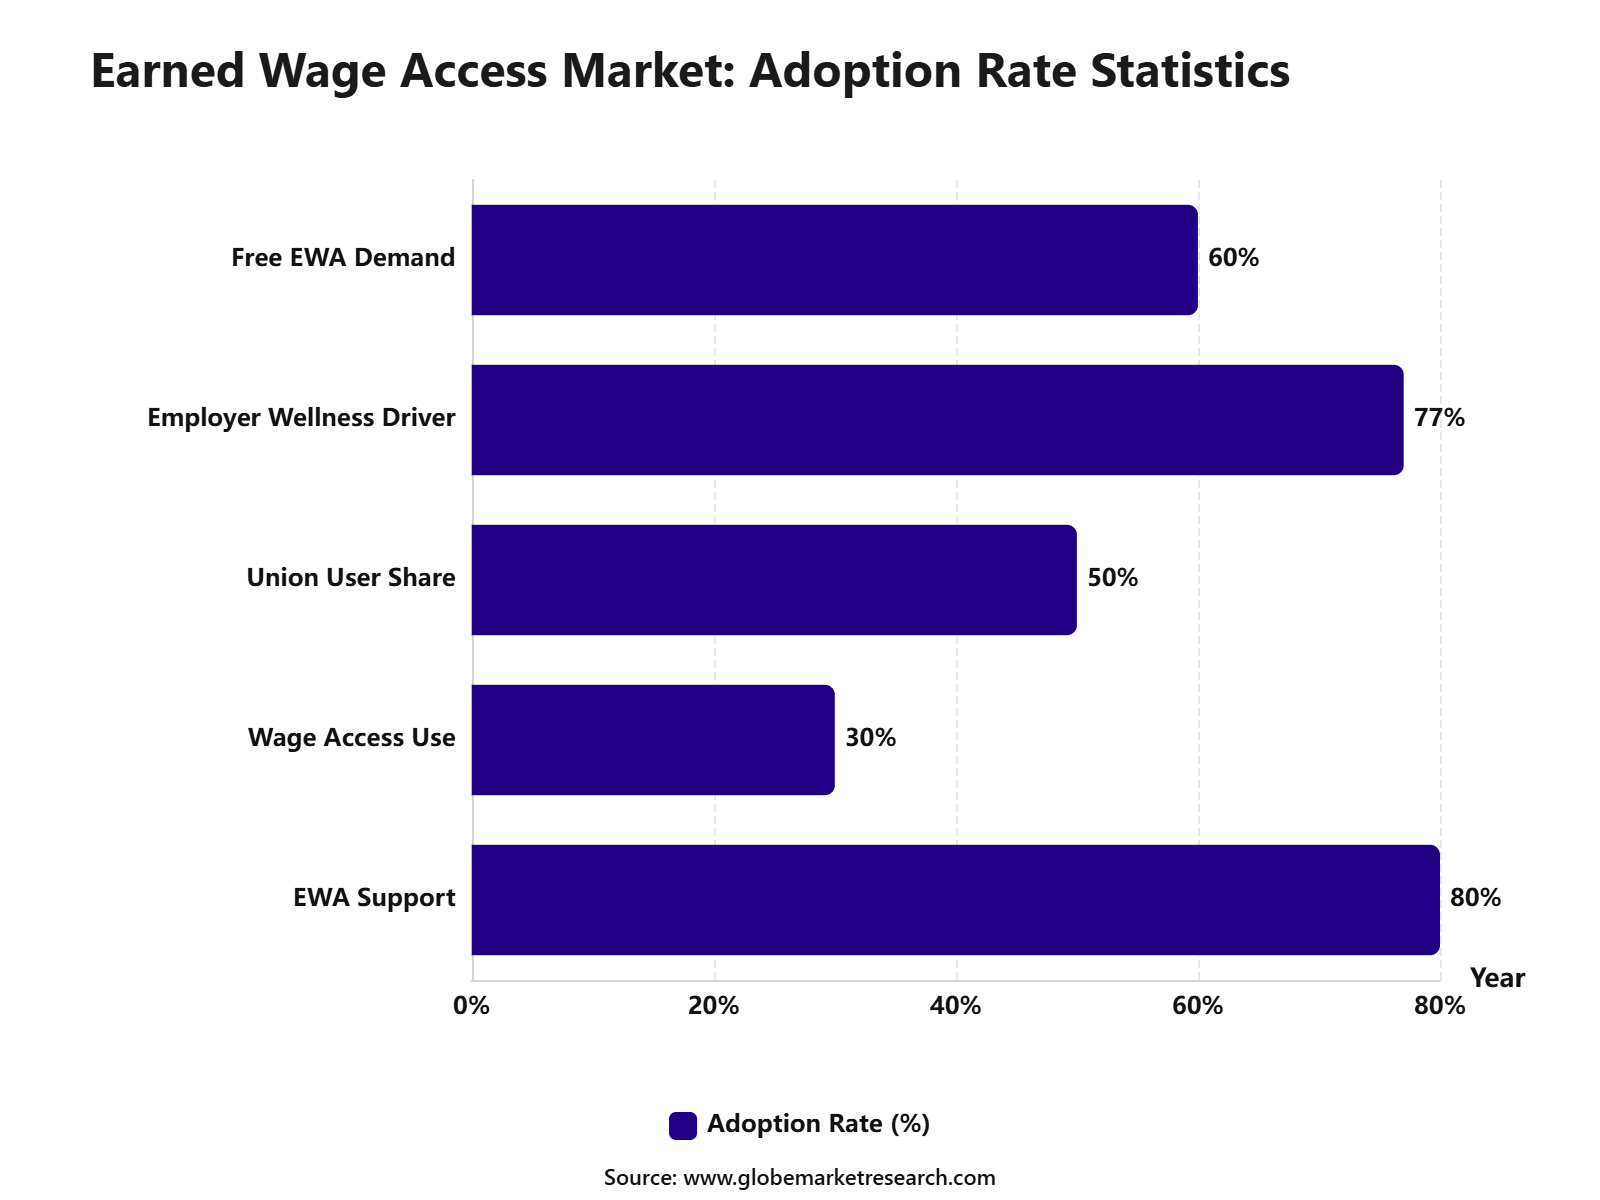
Based on data from fintech council, the Earned Wage Access Market is gaining strong acceptance as workers and employers look for more flexible wage payment options. Around 80% of surveyed voters supported access to earned wages before payday, while 30% had already used early wage access for urgent needs such as rent, groceries, and medical expenses.
The demand was even stronger among union members, where usage reached 50% . Employer adoption is also being supported by financial wellness goals, as 77% of employers offered EWA to improve employee financial stability. These trends show that EWA is becoming an important payroll-linked benefit, especially for workers facing short-term cash flow pressure between pay cycles.
 iThe graph shows projected market growth until 2035 based on CAGR analysis. Actual outcomes may vary depending on changing demand, competition, and economic factors.To gain greater insights - request a sample report PDF
 iThe graph shows projected market growth until 2035 based on CAGR analysis. Actual outcomes may vary depending on changing demand, competition, and economic factors.To gain greater insights - request a sample report PDF
Top Funding and Investment
Investment in the earned wage access market is being driven by employer-integrated payroll platforms, embedded finance, on-demand pay apps, credit facilities, and financial wellness tools. Funding is not only being used for software expansion, but also for liquidity support, because providers need capital to fund early wage transfers before normal payroll settlement.
DailyPay: DailyPay announced a USD 200.1 million upsizing of its secured credit facility in February 2026, increasing total committed capacity to USD 960.1 million. The company also stated that it had surpassed USD 1.1 billion in debt financing backed by on-demand pay receivables, including a USD 200 million asset-backed securitization completed in June 2025.
Tapcheck: Tapcheck raised USD 225.1 million in combined equity and debt financing to expand its on-demand pay platform. The funding included a USD 25.1 million Series A extension led by PeakSpan Capital and a USD 200.2 million credit facility from Victory Park Capital. Tapcheck also reported integration with nearly 300 payroll and timekeeping systems, which strengthens its position in employer-based earned wage access.
Clair: Clair raised USD 175 million to launch a free on-demand pay solution backed by FDIC-insured banking partner Pathward. The structure included up to USD 150 million in participation capacity for wage advances and an additional USD 25 million equity round led by Thrive Capital. Clair also raised USD 23.2 million in Series B funding in 2025 to scale embedded EWA through payroll and workforce management platforms.
Rain: Rain raised USD 75 million in Series B equity funding in 2025, led by Prosus, with participation from Nextalia Ventures, Spark Growth Ventures, QED, Invus Opportunities, and other investors. The company said the funding will support go-to-market expansion, new employee financial wellness products, and broader employer solutions. Rain has onboarded more than 2.5 million employees and distributed over USD 2.1 billion in earned wages since launch.
By Component
Solutions led the component segment with 63.4% share, supported by rising demand for end-to-end earned wage access platforms that connect employees, employers, payroll systems, and payment rails. These solutions are preferred because they help workers access already-earned wages before payday while allowing employers to manage the benefit through structured payroll workflows.
The growth of this segment can be attributed to the increasing need for workplace financial wellness tools. Employers are using EWA solutions to support employees facing short-term cash flow gaps, especially in hourly, shift-based, and frontline roles.
Solutions are also preferred because they reduce manual wage advance requests and improve payroll visibility. Their value is linked to smoother integration, better compliance controls, secure access, and improved employee experience.
By Deployment Mode
Cloud-based deployment led the segment with 71.5% share, supported by easier integration with payroll, HR, time-tracking, banking, and employee self-service systems. Cloud delivery allows EWA providers and employers to manage wage access across multiple locations, shift-based teams, and distributed workforces without heavy on-premise infrastructure.
The cloud model is also supported by wider enterprise cloud adoption. Flexera’s 2026 State of the Cloud Report found that generative AI became the third most widely used public cloud service, with usage rising to 58% from 50% . This reflects growing enterprise comfort with cloud-based platforms that manage data-heavy and real-time workflows.
Cloud-based EWA platforms are also preferred because payroll and employee benefit systems need secure updates, user authentication, transaction records, and real-time access controls. Flexera also reported that wasted cloud spend reached 29% in 2026, which shows why cloud-based EWA providers must balance scalability with strong cost governance and security controls.
 iThe graph shows projected market growth until 2035 based on CAGR analysis. Actual outcomes may vary depending on changing demand, competition, and economic factors.To gain greater insights - request a sample report PDF
By Access Type
Employer-integrated EWA led the access type segment with 69.3% share, supported by its direct connection with payroll records and employer-approved wage data. This model is more trusted because access is based on wages already earned, while repayment is generally handled through the payroll process rather than direct debit after payday.
The CFPB’s 2025 advisory opinion explained that employer-partnered EWA providers contract with employers and generally use payroll processes to deduct accessed amounts at the next payroll event. It also noted that direct-to-consumer models usually operate outside the employer relationship and may debit the worker’s regular transaction account.
Employer-integrated EWA is also gaining regulatory support as state-level rules mature. In June 2026, Capstone reported that 12 U.S. states had adopted EWA regulatory frameworks, while 21 more had proposed measures. The same source noted that payroll service providers with established employer relationships are well positioned under emerging state frameworks.
By Pricing Model
Employee transaction fee led the pricing model segment with 43.8% share, supported by the common use of small fees for instant or expedited wage access. This model is often preferred because standard transfers may be free or low-cost, while employees who need faster access can choose paid delivery.
The CFPB’s 2025 advisory opinion stated that many EWA providers offer regular ACH or transfer to a provider card for free, while ACH delivery typically takes one to three days. It also noted that expedited delivery fees usually range from USD 2.50 to USD 5.99 , depending on provider practice and delivery option.
Pricing practices remain under close review because fees, tips, and expedited delivery charges can affect consumer protection risk. The CFPB stated that bona fide voluntary tips are generally not finance charges, but tips may qualify as finance charges when they are effectively imposed. This makes transparent fee design important for employee-paid EWA models.
By End User
Large enterprises led the end-user segment with 59.3% share, supported by their large payroll bases, shift-based workforces, stronger HR technology budgets, and need for scalable employee benefits. These organizations are better positioned to integrate EWA into payroll, workforce management, employee engagement, and retention programs.
The segment is driven by demand from companies with shift-based, hourly, and multi-location employees. EWA can help large employers improve worker satisfaction, reduce financial stress, and strengthen retention in roles where pay timing can affect daily household needs.
Large enterprises also benefit from better reporting and governance through employer-linked EWA platforms. These systems support payroll control, policy compliance, employee communication, and benefit performance tracking at scale.
By Region
North America led the regional segment with 45.2% share, supported by active regulatory development, high payroll digitization, strong employer benefit adoption, and growing worker demand for flexible wage access. The U.S. remains the main regional driver because EWA regulation, payroll integration, and employee financial wellness programs are advancing together.
The region’s leadership is reinforced by U.S. regulatory activity. Capstone reported in 2026 that 12 states had already adopted EWA frameworks, and 21 more had proposed measures. This shows that North America is moving toward clearer operating rules for providers, employers, and employees.
Worker financial pressure also supports regional demand. The Federal Reserve’s 2026 report, based on its 2025 household survey of nearly 13,000 adults, found that 59% had at least one major unexpected expense in the prior 12 months, while only 63% could cover a USD 400 emergency expense using cash or its equivalent. This liquidity gap supports the need for responsible EWA access in North America.
 iThe graph shows projected market growth until 2035 based on CAGR analysis. Actual outcomes may vary depending on changing demand, competition, and economic factors.To gain greater insights - request a sample report PDF
Go-to-Market and Sales Economics
The go-to-market approach for the Earned Wage Access Market should focus on payroll-linked financial wellness, not short-term lending. EWA platforms are gaining attention because many workers still wait for fixed pay cycles even after wages have already been earned. The CFPB noted that nearly three-quarters of U.S. private businesses use biweekly, semimonthly or monthly pay periods, which creates a clear gap between work completed and cash received.
Sales economics are being shaped by employers’ need to reduce financial stress among workers. PwC’s 2026 Employee Financial Wellness Survey found that 59% of employees are currently stressed about their finances, while 49% said their compensation is not keeping up with costs. This supports demand for EWA as part of broader employee benefits, especially for hourly, frontline, retail, hospitality, healthcare and logistics workers.
The market is also supported by a large addressable payroll base. U.S. nonfarm payroll employment increased by 172,000 in May 2026, while average hourly earnings rose 3.4% year over year. This creates a large recurring transaction environment for EWA providers, payroll platforms and employer-sponsored benefit programs.
Revenue Potential Analysis
Revenue Landscape Across
Revenue potential is spread across employer-sponsored EWA, direct-to-consumer wage access apps, payroll-integrated platforms, HCM marketplace partnerships, instant transfer fees, subscriptions, voluntary tips, debit-card programs and financial wellness add-ons. EarnIn’s model shows how revenue can extend beyond basic wage access, with expedited transfers priced between USD 3.99 and USD 5.99, early paycheck access at USD 2.99 and Live Pay available at USD 2.99 per month with autopay.
Payroll integration is becoming an important revenue route because employers want EWA without major changes to core payroll systems. EarnIn Payroll was launched in October 2025 to combine payroll, EWA, Live Pay and financial tools in one system. The company stated that the platform is aimed at employers, payroll service providers, frontline workers and hourly employees, which indicates that EWA is moving from a standalone benefit into payroll infrastructure.
Worker demand also supports the revenue landscape. A 2025 survey of 2,000 employed Americans found that 52% were paid biweekly, while 62% said daily or work-based pay would improve financial wellness and reduce stress. Awareness was still low, with only 15% having heard of EWA, which shows a large education-led adoption opportunity for providers and employers.
Financial Impact
The financial impact for employers is linked to productivity, retention and benefit value. PwC reported that 85% of Gen Z respondents said financial stress affects their mental health, and 71% reported reduced productivity. This makes EWA commercially relevant for sectors with high staff turnover, shift-based work and attendance sensitivity.
For employees, EWA can reduce dependence on high-cost short-term funding when designed with transparent pricing and non-recourse structures. PwC found that 44% of workers use credit cards for necessities they cannot otherwise afford, while 39% have used payday loans or advances. This creates a strong use case for wage access tools that help workers manage bills between paydays without creating a traditional debt cycle.
The regulatory environment is becoming a major financial factor. On December, 2025, the CFPB issued an advisory opinion stating that covered EWA products are not treated as credit under Regulation Z, while also withdrawing a proposed interpretive rule. This gives compliant providers more clarity, but companies still need strong controls around fees, disclosures, payroll deductions, data privacy and state-level rules.
Segment Covered in the Report
By Component
Solutions
Services
By Deployment Mode
Cloud-Based
On-Premises
By Access Type
Employer-Integrated EWA
Direct-to-Consumer EWA
By Pricing Model
Employer-Paid
Employee Transaction Fee
Subscription-Based
Hybrid
By End User
Large Enterprises
Small and Medium Enterprises
Gig Workers
Others
By Region
North America
Europe
Asia Pacific
Latin America
Middle East and Africa
Drivers Impact Analysis
The Earned Wage Access Market is driven by rising demand for flexible salary access, growing employee financial stress, and wider employer adoption of financial wellness benefits. Workers are increasingly looking for faster access to earned income instead of depending on payday loans, credit cards, or informal borrowing.
North America leads adoption because of strong fintech infrastructure, employer-integrated payroll systems, and rising use of digital workforce benefits. Large enterprises, gig platforms, and hourly workforce sectors are becoming key adoption channels for EWA solutions.
Impact Factor | Estimated CAGR Impact | Regional Relevance | Market Impact |
|---|---|---|---|
Rising employee demand for flexible pay | +6.7% | North America, Europe, Asia Pacific | Drives platform adoption. |
Growth in financial wellness programs | +5.6% | U.S., Canada, UK, Australia | Supports employer uptake. |
Expansion of hourly and gig workforce | +4.8% | North America, Asia Pacific | Builds user base. |
Increasing payroll digitization | +4.2% | Developed and urban markets | Improves system access. |
Demand for alternatives to payday loans | +3.7% | U.S., UK, Canada | Strengthens consumer need. |
Restraints Impact Analysis
The market faces restraints from regulatory scrutiny, fee transparency concerns, and questions around whether EWA should be treated like credit in some markets. Providers must clearly communicate pricing, repayment flow, and employer responsibilities to avoid compliance risks.
Another restraint is uneven employer readiness. Small businesses may lack payroll integration capability, HR technology budgets, or awareness of EWA benefits, which can slow adoption outside large enterprise environments.
Impact Factor | Estimated CAGR Impact | Regional Relevance | Market Impact |
|---|---|---|---|
Regulatory uncertainty around wage access | -3.4% | U.S., Europe, Australia | Slows product rollout. |
Fee transparency concerns | -2.9% | North America, Europe | Affects user trust. |
Payroll integration complexity | -2.4% | Small and mid-sized employers | Delays adoption. |
Limited awareness among employers | -2.0% | Emerging markets | Restricts market reach. |
Risk of overuse by employees | -1.7% | Global | Raises financial concerns. |
Opportunities Impact Analysis
Major opportunities are emerging from employer-integrated EWA platforms, cloud-based payroll systems, mobile-first financial wellness tools, and partnerships with HR technology providers. These models make wage access easier to scale across large workforces.
The market also benefits from rising demand among healthcare, retail, logistics, hospitality, and gig economy workers. Providers that combine EWA with budgeting, savings, bill payment, and financial education can create stronger long-term user engagement.
Impact Factor | Estimated CAGR Impact | Regional Relevance | Market Impact |
|---|---|---|---|
Employer-integrated EWA expansion | +6.4% | North America, Europe, Asia Pacific | Builds scalable adoption. |
Cloud payroll partnerships | +5.2% | U.S., Canada, UK, India | Improves platform reach. |
Growth in gig worker wage access | +4.6% | North America, Asia Pacific | Expands user demand. |
Financial wellness app integration | +4.0% | Developed markets | Increases engagement. |
Expansion into emerging economies | +3.5% | Asia Pacific, Latin America | Creates future growth. |
Challenges Impact Analysis
The main challenge is building sustainable business models that help employees without creating frequent dependency on early wage access. Providers need to balance convenience, affordability, and responsible usage controls.
Another challenge is managing trust among employers, regulators, and workers. Since wage access is closely connected to payroll and personal financial data, security, privacy, and transparent terms are essential for long-term adoption.
Impact Factor | Estimated CAGR Impact | Regional Relevance | Market Impact |
|---|---|---|---|
Ensuring responsible usage | -3.1% | Global | Protects employee welfare. |
Managing payroll data security | -2.7% | North America, Europe | Builds platform trust. |
Maintaining employer confidence | -2.3% | Large enterprises and SMBs | Supports renewals. |
Balancing fees and affordability | -2.0% | U.S., UK, emerging markets | Impacts user retention. |
Handling multi-state compliance | -1.8% | United States | Raises operating complexity. |
Recent Developments
In April 2026, ZayZoon went live inside Auris, a national HR and payroll platform used by more than 50,000 small and mid-sized businesses in the U.S. The integration allows Auris customers to access on-demand pay, employee recognition, and financial perks without separate logins or added implementation.
In March 2025, Fiserv completed the acquisition of Payfare, an earned wage access and digital banking platform for gig and new-economy workers. Payfare stated that it had powered more than USD 20 billion in instant access to earnings for millions of gig workers
Research Methodology
Methodology Area | Coverage Details |
|---|---|
Primary Research | Interviews with manufacturers, suppliers, distributors, consultants, procurement teams, and industry experts. |
Secondary Research | Company filings, annual reports, regulatory databases, government publications, trade associations, and verified industry sources. |
Data Validation | Cross-verification through source triangulation, historical trend review, demand-side checks, and supply-side assessment. |
Market Estimation | Bottom-up and top-down analysis based on product demand, regional consumption, company presence, and application-level usage. |
Forecasting Approach | Forecasts based on regulatory shifts, infrastructure investment, technology adoption, pricing trends, industrial expansion, and end-use demand. |
Quality Review | Analyst review, peer validation, outlier checks, internal consistency review, and final publication approval. |
AI Policy | AI is not used as a primary data source. All published insights are reviewed against human-verified evidence. |
Competitive Landscape
The market is characterized by intense competition among established players and emerging companies. Strategic partnerships, mergers and acquisitions, and product innovation are key strategies employed by market participants.
Key Market Players
DailyPay
Payactiv
Branch
Rain
Earnin
Wagestream
Tapcheck
ZayZoon
Chime Workplace
Instant Financial
Ceridian Dayforce Wallet
Even
Other Key Players
Meet the Team
This report was prepared by our expert analysts with deep industry knowledge and research experience.
Pratiksha is market research analyst with strong experience in industry research, market forecasting, and competitive analysis. She specializes in identifying market trends, evaluating growth opportunities, and preparing data-driven insights across global industries. Her work supports businesses in understanding market dynamics, customer demand, regional opportunities, and strategic investment areas.
Sayali brings more than 5 years of experience to Globe Market Research, supporting the accuracy, clarity, and relevance of research content across multiple industries. She reviews market data, segment analysis, competitive insights, and industry trends to ensure each report meets strong quality standards and provides practical value to business decision-makers. Her expertise spans healthcare, information technology, consumer goods, and diverse cross-industry domains. With a strong focus on data reliability, structured analysis, and clear presentation, Sayali helps ensure that each research output delivers well-reviewed insights for clients, investors, consultants, and industry stakeholders.
Frequently Asked Questions
Related Reports
More in Information and Technology
5G RAN Market Size to hit USD 108.5 billion by 2035
Global 5G RAN Market Size, Go-to-Market and Sales Strategy Analysis By Component (Hardware, Software, Services), By Architecture Type (Traditional RAN, Open RAN), By Deployment (Public Networks, Private Networks), By End Use (Telecom Operators, Enterprise and Industrial Users), By Regional Insights, Business plan and Project Report, Investment Opportunities, Profitability, Industry Trends, Leading Companies and Growth Forecasts By 2025-2035
Online Dating Market Size to hit USD 29.5 Bn by 2035
Global Online Dating Market Size, Go-to-Market Strategy Analysis By Type (Paying Online Dating, Non-Paying Online Dating), By Revenue Model (Subscription, Advertising-Supported, Other Model), By Platform (Web Portals, Applications), By Age Group (Adult, Baby Boomer, Generation X, Generation Z, Millennials), By Regional Insights, Business plan and Project Report, Investment Opportunities, Profitability, Industry Trends, Leading Companies and Growth Forecasts By 2025-2035
AI In Interior Design Market Size to hit USD 37.7 billion by 2035
Global AI In Interior Design Market Size, Go-to-Market Strategy Analysis By Component (Solution, Service), By Deployment (Cloud, On-Premises), By User Type (Homeowners, Real Estate Developers, Interior Designers, Architects, Corporate Clients), By Design Style (Traditional, Modern, Contemporary, Minimalist, Eclectic), By Technology Integration (3D Visualization Tools, Virtual Reality Solutions, Augmented Reality Applications, CAD Software, Machine Learning Algorithms), By Application (Residential Design, Commercial Design, Hospitality Design, Retail Spaces, Office Spaces), By Pricing Strategy (Subscription-Based, Freemium Model, Pay-Per-Use, One-Time License, Enterprise Licensing, Project-Based Pricing), By Regional Insights, Business plan and Project Report, Investment Opportunities, Profitability, Industry Trends, Leading Companies and Growth Forecasts By 2025-2035
Facility Management Market Size to hit USD 4.3 Trillion by 2035
Global Facility Management Market Size, Go-to-Market Strategy Analysis By Service Type (Hard Services, Soft Services), By Offering (In-House, Outsourced), By End User (Commercial, Industrial, Government and Public Sector, Residential, Institutional, Others), By Service Provider (Single Service Providers, Integrated Facility Management Providers, Bundled Service Providers), By Contract Type (Annual Contracts, Flexible Contracts, Performance-Based Contracts), By Regional Insights, Business plan and Project Report, Investment Opportunities, Profitability, Industry Trends, Leading Companies and Growth Forecasts By 2025-2035