
Revenue, 2025
$36.9 Billion
Forecast, 2035
$108.5 Billion
CAGR, 2025-2035
11.4%
Report Coverage
Global
Market Size and Forecast
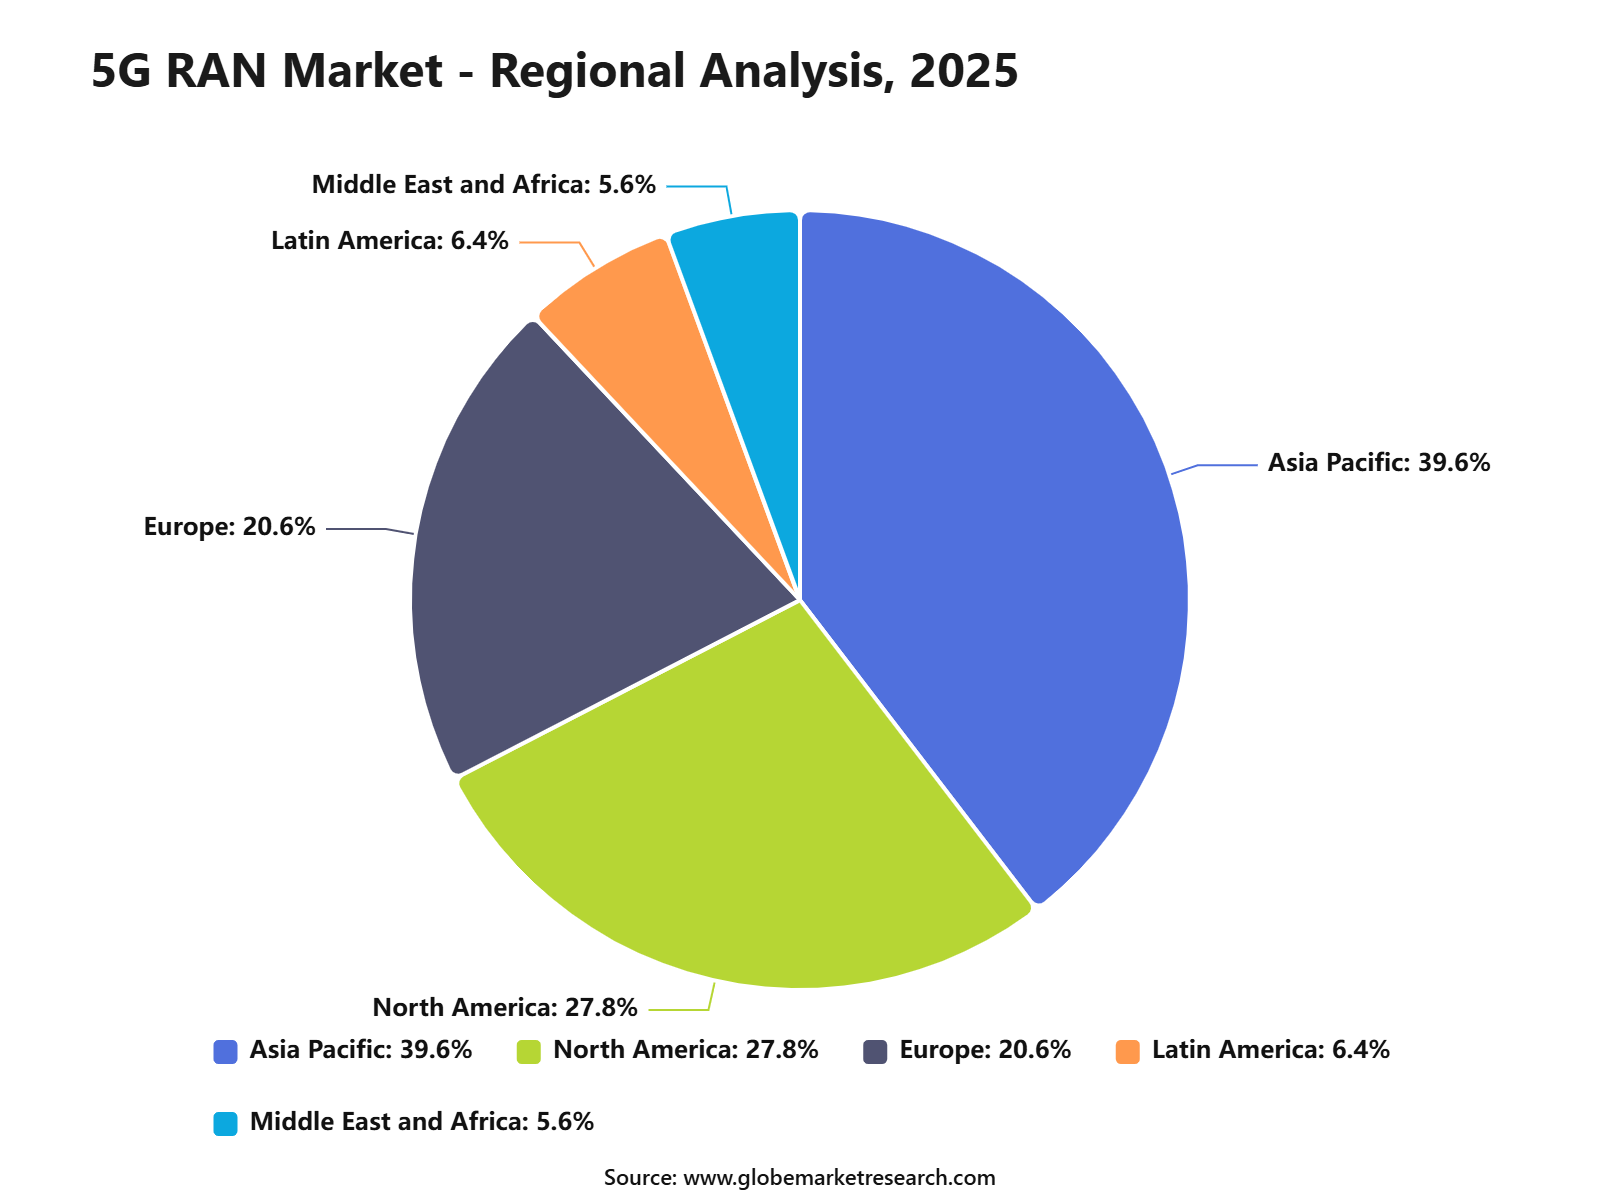
The Global 5G RAN Market was worth USD 36.9 billion in 2025 and is expected to reach USD 44.1 billion in 2026. The market is further expected to reach USD 108.5 billion by 2035, growing at a CAGR of 11.4% from 2025 to 2035. Asia Pacific held the largest regional share of 39.6% in 2025, supported by rapid 5G infrastructure rollout, strong telecom investments, large mobile subscriber bases, and rising demand for high-speed connectivity across China, India, Japan, South Korea, and Southeast Asia.
The 5G RAN Market includes radio access network infrastructure that connects user devices to 5G core networks through radios, antennas, baseband units, small cells, macro cells, distributed units, centralized units, and Open RAN systems. These solutions are widely used by telecom operators, enterprises, industrial facilities, smart cities, and private network providers. The market is closely linked with mobile broadband expansion, low-latency communication, spectrum deployment, edge computing, and network virtualization.
Key Parameter | Report Details |
|---|---|
Market Revenue, 2025 | USD 36.9 Billion |
Projected Revenue, 2035 | USD 108.5 Billion |
CAGR (2025-2035) | 11.4% |
Largest Region | Asia Pacific |
Leading Segment | Public Networks (82.0%) |
Market Concentration | High |
Base Year | 2025 |
Forecast Period | 2025-2035 |
The market outlook remains strong as telecom operators continue to expand 5G coverage and modernize legacy network infrastructure. Growth can be attributed to rising mobile data traffic, increasing enterprise adoption of private 5G networks, and wider deployment of cloud-native and virtualized RAN architectures. The expansion of fixed wireless access, smart manufacturing, connected vehicles, IoT applications, and AI-based network optimization is expected to support long-term market growth.
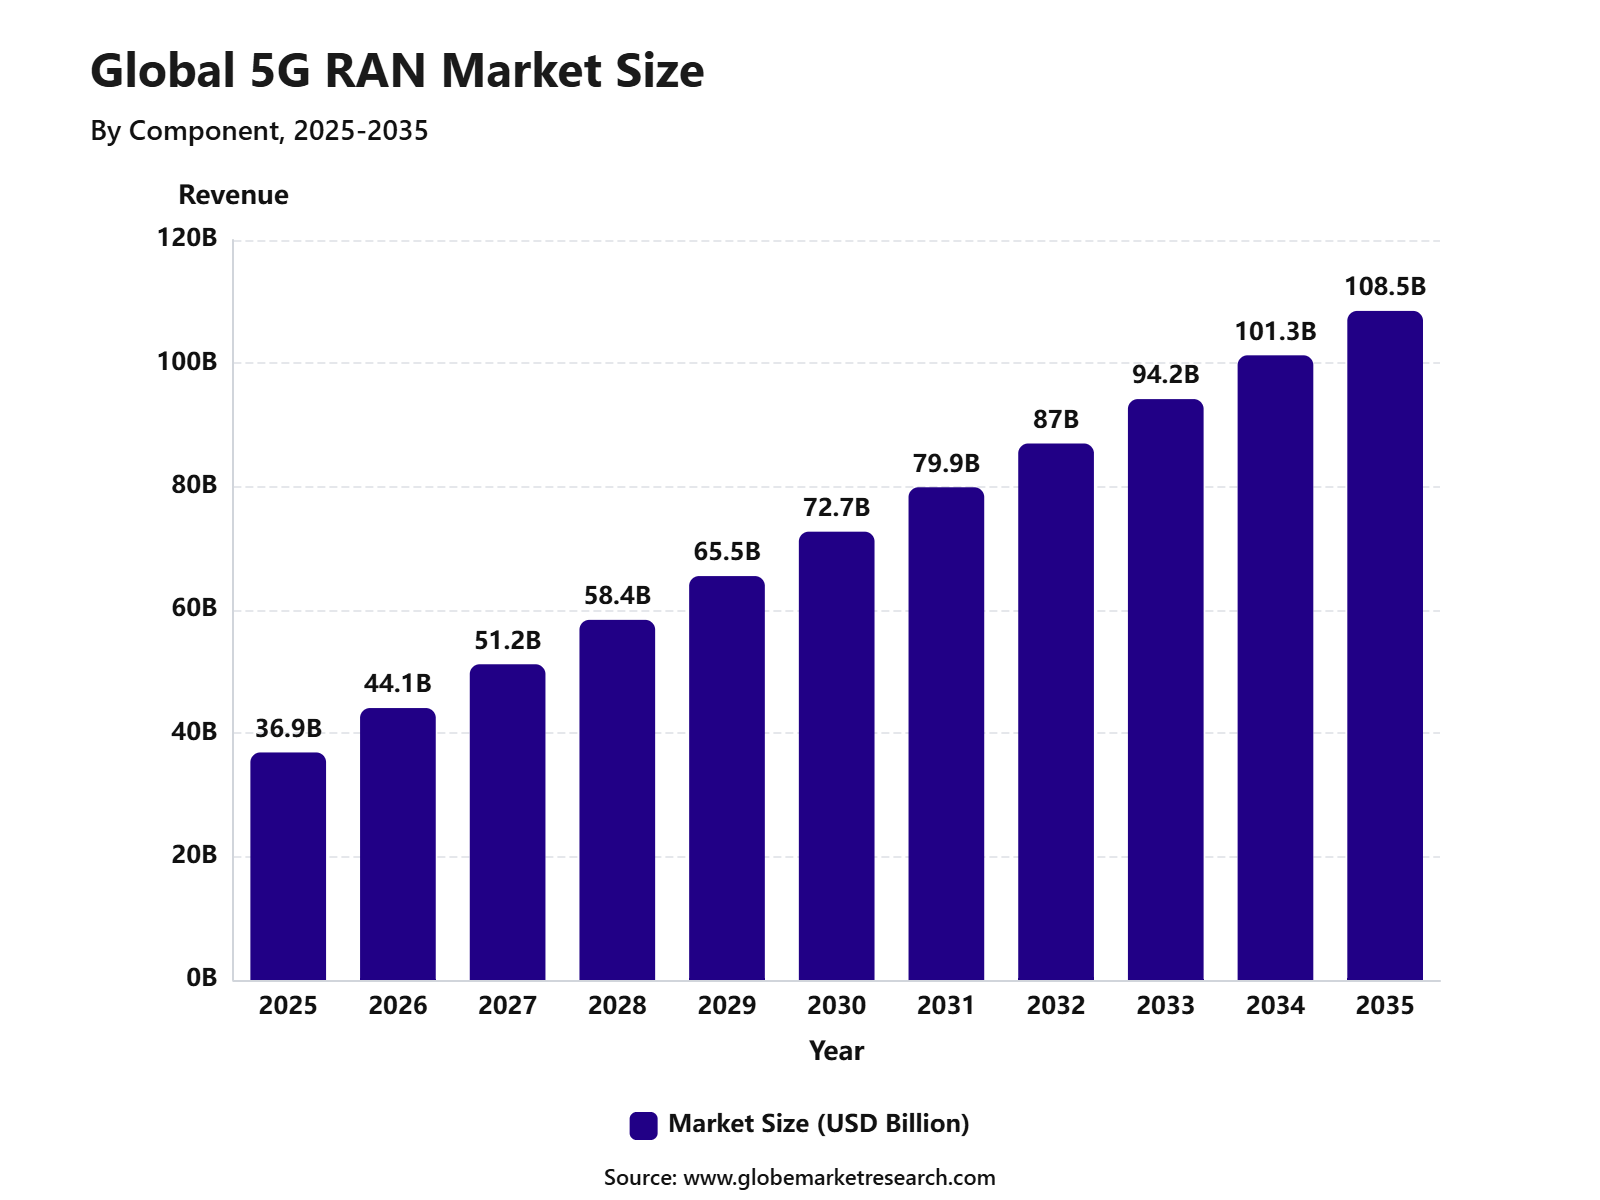 iThe graph shows projected market growth until 2035 based on CAGR analysis. Actual outcomes may vary depending on changing demand, competition, and economic factors.To gain greater insights - request a sample report PDF
Key Market Insights
Hardware led the component segment with 59.3% share, supported by strong demand for radios, antennas, baseband units, small cells, and other network equipment used in 5G infrastructure rollout.
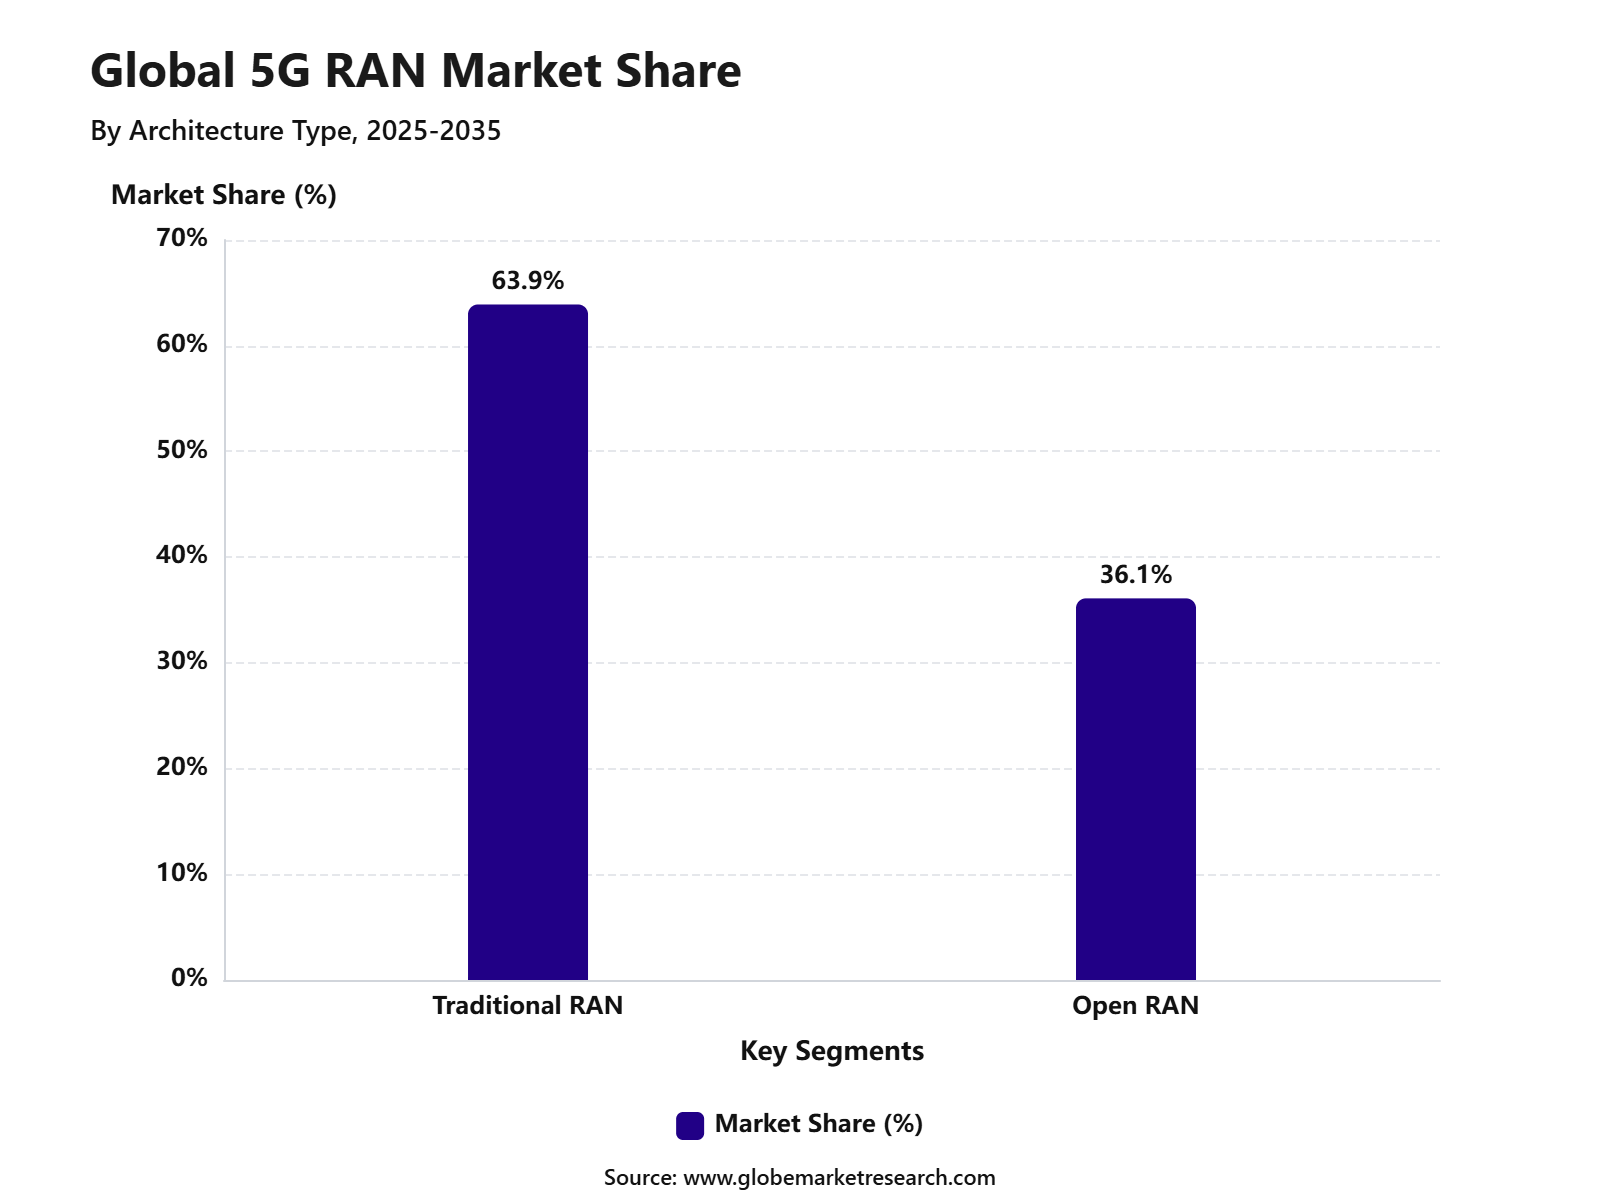
Traditional RAN accounted for 63.9% share by architecture type, driven by its established deployment model, existing operator familiarity, and wide use across large-scale mobile network upgrades.
Public networks held 82.0% share by deployment, supported by nationwide 5G expansion, rising mobile data traffic, and telecom operator investment in broader network coverage.
Telecom operators represented 74.6% share by end use, driven by their central role in spectrum deployment, network modernization, capacity expansion, and 5G service delivery.
Asia Pacific led the 5G RAN market with 39.6% share, supported by large-scale 5G deployments, strong telecom infrastructure investment, high mobile subscriber base, and rapid network expansion across China, India, Japan, and South Korea.
Top Funding and Investment
Investment in the 5G RAN market is being led by nationwide 5G Standalone rollouts, Open RAN commercialization, AI-RAN, massive MIMO radios, cloud-native RAN software, private 5G, and domestic telecom equipment manufacturing. Funding is shifting from basic coverage expansion toward programmable, energy-efficient, multi-vendor, and AI-ready radio access networks.
VodafoneThree is investing GBP 11 billion to build one of the UK’s most advanced mobile networks. The plan targets 99% 5G Standalone population coverage by 2030 and 99.96% by 2034. The company also signed major eight-year vendor agreements with Ericsson and Nokia to supply RAN, core, and related network equipment. Ericsson’s partnership alone is valued at SEK 12.5 billion, or almost GBP 1 billion. This is a major investment signal for 5G SA, RAN modernization, and network consolidation.
AT&T announced a large-scale Open RAN collaboration with Ericsson, with spending expected to approach USD 14 billion over five years. AT&T stated that the plan is designed to support commercial-scale open and interoperable RAN deployment in the United States. The company also said its Open RAN plan targets 70% of wireless network traffic on open-capable platforms by late 2026. This deal remains one of the largest Open RAN investment commitments globally.
NVIDIA announced a USD 1 billion equity investment in Nokia in October 2025 as part of a strategic AI-RAN partnership. The collaboration will add NVIDIA-powered commercial-grade AI-RAN products to Nokia’s RAN portfolio, supporting 5G-Advanced and future 6G networks. Nokia said the proceeds will be used to accelerate trusted connectivity plans and AI-era network development. This investment shows how RAN is moving closer to AI computing, edge processing, and software-defined network architecture.
The U.S. Public Wireless Supply Chain Innovation Fund is a USD 1.5 billion program aimed at advancing Open RAN, wireless innovation, competition, and supply-chain resilience. In January 2025, NTIA awarded USD 117 million for open radio unit innovation and commercialization. In 2026, NTIA also began seeking industry feedback on a new direction focused on AI-RAN. This public funding is important because it supports domestic Open RAN hardware, software, interoperability, and future AI-native radio networks.
By Component Insights
Hardware led the component segment with 59.3% share, supported by the critical role of radio units, antennas, baseband equipment, power systems, and site-level infrastructure in network rollout. These physical assets remain essential because radio access networks depend on reliable field equipment to deliver coverage, capacity, and low-latency connectivity.
The growth of this segment can be attributed to continued network densification and coverage expansion. Telecom operators require strong hardware foundations before advanced software, automation, and cloud-native functions can deliver their full value across commercial networks.
Hardware also remains important because network performance is closely linked to signal strength, spectrum use, antenna quality, and site reliability. As mobile traffic increases, operators continue to invest in durable and efficient RAN equipment to support stronger outdoor, indoor, and high-traffic area coverage.
By Architecture Type Insights
Traditional RAN led the architecture type segment with 63.9% share, supported by its established deployment model, proven network reliability, and strong operator familiarity. Traditional RAN remains widely used because it offers a mature architecture with clear vendor accountability and tested performance across large public mobile networks.
The segment is preferred in many rollouts because telecom operators often prioritize network stability, service continuity, and predictable integration. Traditional RAN supports smooth deployment where operators need dependable radio performance, structured maintenance, and compatibility with existing network infrastructure.
Although open and cloud-native RAN models are gaining attention, traditional RAN continues to hold a strong position due to operational confidence and lower transition complexity. Operators usually adopt newer RAN models gradually while keeping proven systems active for core network coverage and capacity needs.
 iThe graph shows projected market growth until 2035 based on CAGR analysis. Actual outcomes may vary depending on changing demand, competition, and economic factors.To gain greater insights - request a sample report PDF
By Deployment Insights
Public networks led the deployment segment with 82.0% share, driven by wide commercial rollout by mobile network operators. Public 5G RAN deployments are essential for consumer mobile broadband, fixed wireless access, enterprise connectivity, smart city use cases, and nationwide coverage expansion.
This segment is supported by the large role of licensed spectrum and national telecom infrastructure. Public networks require broad RAN deployment across urban, suburban, transport, industrial, and rural locations, making them the main deployment route for large-scale 5G services.
Public networks also benefit from rising demand for faster mobile internet, stronger video performance, low-latency applications, and better network reliability. As operators improve coverage and capacity, public RAN infrastructure remains the backbone of mainstream 5G connectivity.
By End Use Insights
Telecom operators led the end-use segment with 74.6% share, supported by their central role in building, owning, and operating 5G RAN infrastructure. Operators manage spectrum assets, network planning, site deployment, maintenance, customer service, and long-term technology upgrades.
The segment is driven by the need to improve network quality and support new digital services. Telecom operators use 5G RAN to expand mobile broadband, strengthen enterprise connectivity, support private network partnerships, and enable advanced service models across industries.
Telecom operators also remain the main buyers because RAN investment is closely tied to coverage obligations, service competition, and data traffic growth. Their spending decisions shape the pace of hardware upgrades, architecture transition, and deployment of advanced network features.
By Region Insights
Asia Pacific led the regional segment with 39.6% share, supported by large mobile subscriber bases, rapid 5G rollout, strong telecom infrastructure investment, and high demand for mobile data. The region has several large markets where operators are expanding coverage and improving network capacity.
The regional lead is supported by dense urban populations and strong demand for mobile-first digital services. High smartphone usage, video consumption, gaming, digital payments, and enterprise connectivity needs continue to push telecom operators toward wider RAN deployment.
Asia Pacific also benefits from active network modernization across developed and emerging economies. Operators in the region are improving radio coverage, upgrading capacity, and preparing networks for future service needs, which keeps the region at the center of 5G RAN adoption.
 iThe graph shows projected market growth until 2035 based on CAGR analysis. Actual outcomes may vary depending on changing demand, competition, and economic factors.To gain greater insights - request a sample report PDF
Segment Covered in the Report
By Component
Hardware
Software
Services
By Architecture Type
Traditional RAN
Open RAN
By Deployment
Public Networks
Private Networks
By End Use
Telecom Operators
Enterprise and Industrial Users
By Region
North America
Europe
Asia Pacific
Latin America
Middle East and Africa
Drivers Impact Analysis
The 5G RAN Market is driven by rising mobile data traffic, wider 5G standalone rollout, network densification, private 5G demand, and telecom operator investment in faster and lower-latency connectivity. RAN remains one of the most important parts of 5G infrastructure because it connects user devices with the core network.
Demand is also supported by the need for better network coverage, higher capacity, and improved service quality in urban, industrial, enterprise, and public network environments. Telecom operators are upgrading radios, baseband units, antennas, and software systems to support more efficient 5G services.
Impact Factor | Estimated CAGR Impact | Regional Relevance | Market Impact |
|---|---|---|---|
Rising 5G network rollout | +3.0% | Asia Pacific, North America, Europe | Drives core infrastructure demand. |
Growth in mobile data traffic | +2.6% | Global telecom markets | Supports capacity expansion. |
Network densification in cities | +2.2% | Urban markets | Improves coverage and speed. |
Private 5G adoption | +1.8% | Industrial and enterprise hubs | Adds new deployment demand. |
Shift toward 5G standalone networks | +1.5% | Advanced telecom markets | Supports next-stage upgrades. |
Restraints Impact Analysis
The market faces restraints from high deployment cost, spectrum-related expenses, and complex network integration. 5G RAN requires dense infrastructure, advanced radios, fiber backhaul, tower upgrades, energy systems, and skilled engineering support. Telecom operators also face pressure on return on investment. While 5G improves network performance, monetization from consumer services can be slower, so operators may delay large-scale RAN expansion in markets with weak pricing power.
Impact Factor | Estimated CAGR Impact | Regional Relevance | Market Impact |
|---|---|---|---|
High network deployment cost | -1.6% | Global telecom operators | Slows rollout speed. |
Spectrum investment pressure | -1.3% | Licensed telecom markets | Affects capital budgets. |
Complex integration with legacy networks | -1.1% | 4G-to-5G transition markets | Raises upgrade burden. |
Slow consumer monetization | -0.9% | Mature mobile markets | Delays investment recovery. |
Energy consumption concerns | -0.8% | Dense 5G networks | Increases operating cost. |
Opportunities Impact Analysis
Opportunities are strong in Open RAN, virtualized RAN, cloud RAN, small cells, massive MIMO, private 5G, and enterprise network solutions. These areas can improve network flexibility, reduce vendor lock-in, and support more software-driven telecom infrastructure. Industrial use cases also create new value. Manufacturing, ports, mining, logistics, healthcare, smart cities, and utilities are adopting 5G networks for automation, remote monitoring, robotics, video analytics, and mission-critical communication.
Impact Factor | Estimated CAGR Impact | Regional Relevance | Market Impact |
|---|---|---|---|
Open RAN deployment growth | +2.8% | North America, Europe, Japan, India | Supports vendor diversity. |
Virtualized and cloud RAN adoption | +2.4% | Advanced telecom markets | Improves network flexibility. |
Private 5G network expansion | +2.1% | Industrial and enterprise sectors | Adds new revenue streams. |
Small cell deployment | +1.8% | Urban and indoor coverage markets | Improves network density. |
Massive MIMO upgrades | +1.6% | High-traffic mobile markets | Enhances capacity. |
Challenges Impact Analysis
The main challenge is managing technical complexity across radio units, distributed units, centralized units, transport networks, and core integration. 5G RAN upgrades require careful planning because poor integration can reduce network performance and raise operating costs. Another challenge is ensuring interoperability across multi-vendor environments. Open and virtualized systems create flexibility, but they also require testing, certification, software maturity, and strong system integration capability.
Impact Factor | Estimated CAGR Impact | Regional Relevance | Market Impact |
|---|---|---|---|
Multi-vendor interoperability issues | -1.5% | Open RAN markets | Slows adoption. |
Complex network planning | -1.2% | Dense urban networks | Raises deployment risk. |
Backhaul and fiber limitations | -1.0% | Emerging and rural markets | Restricts performance. |
Skilled workforce shortage | -0.9% | Global telecom sector | Affects rollout quality. |
Cybersecurity and network reliability risks | -0.8% | Critical telecom infrastructure | Increases compliance needs. |
Go-to-Market and Sales Economics
The 5G RAN market should be positioned around network densification, 5G Standalone upgrades, fixed wireless access, private 5G, enterprise low-latency networks, and AI-enabled network automation. Commercial demand is being supported by 3.1 billion global 5G subscriptions in Q1 2026, with 162 million new 5G subscriptions added during the quarter. More than 390 service providers have launched commercial 5G services, and over 90 have launched 5G Standalone networks, making RAN modernization a clear priority for operators.
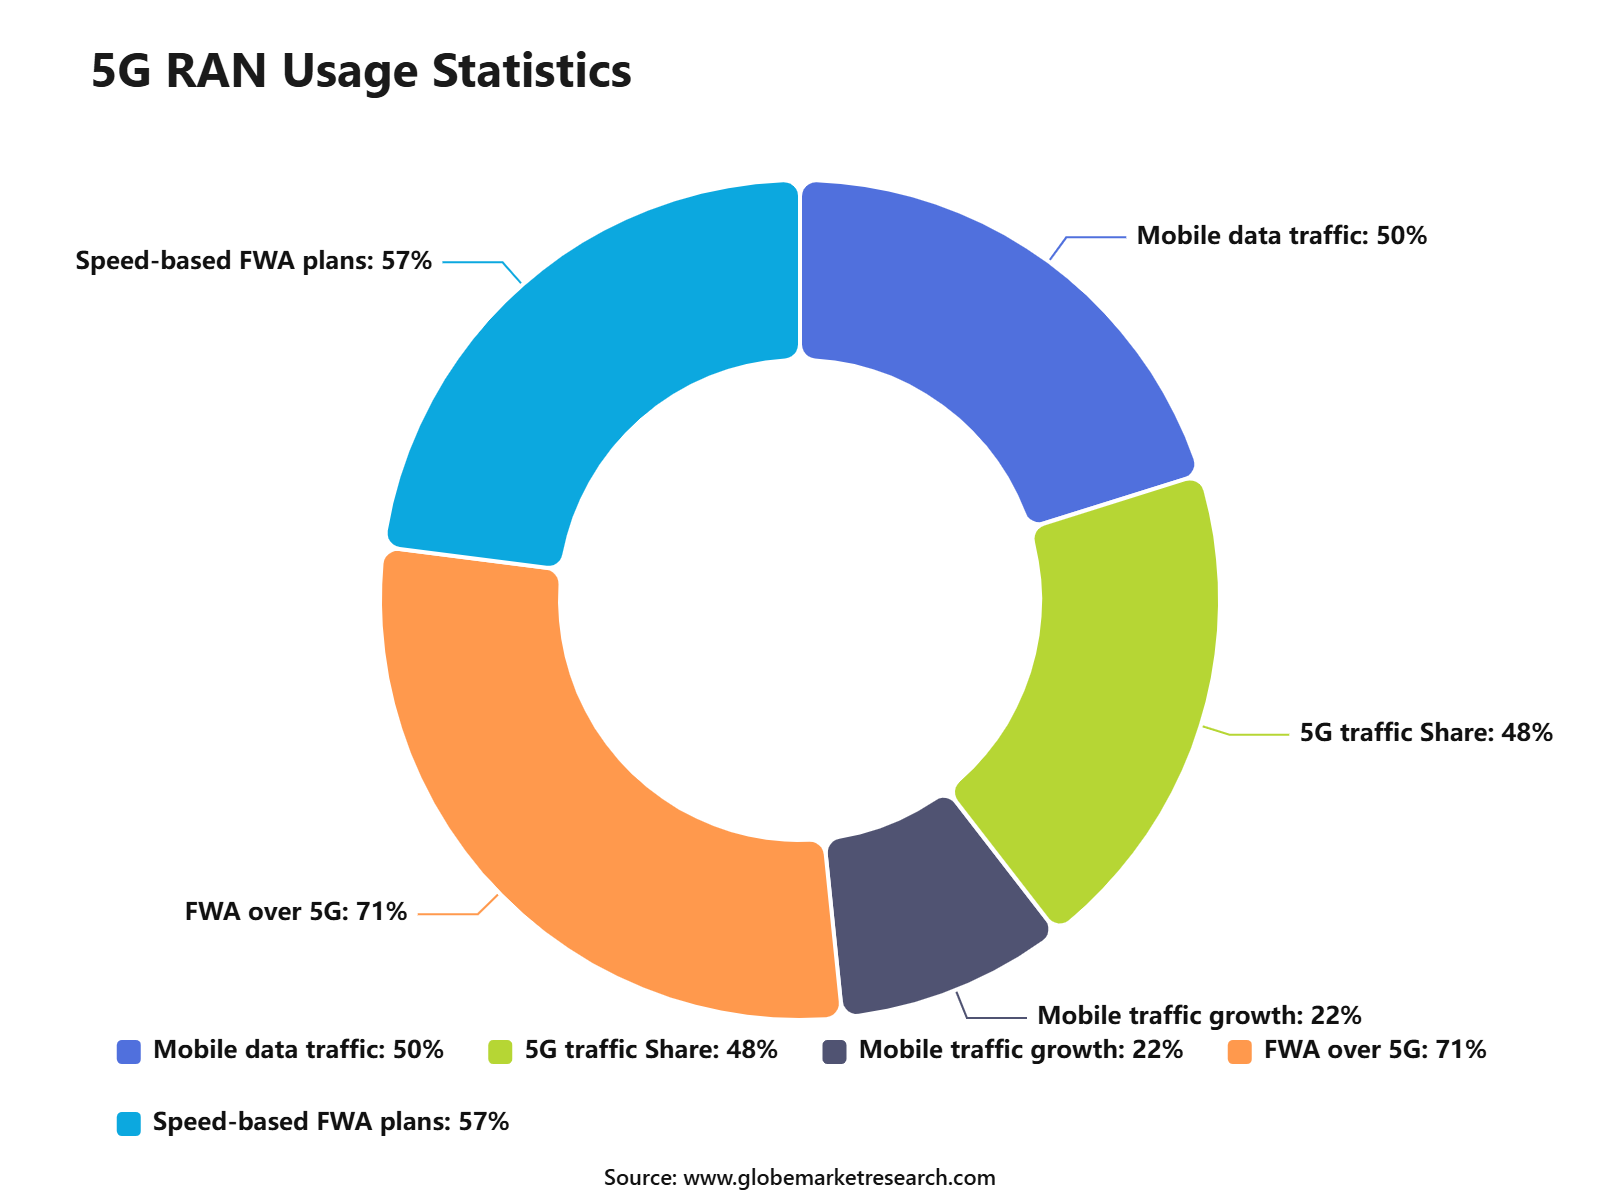
Sales economics are shifting from pure hardware deployment to lifecycle value, including radios, baseband, software upgrades, cloud RAN, Open RAN integration, network slicing, and managed services. This change is important because 5G carried 48% of global mobile data traffic at the end of 2025, and this share is expected to reach 85% by the end of 2031. RAN vendors with energy-efficient radios, AI-based optimization, and upgrade-ready platforms are better placed to win long-term operator contracts.
 iThe graph shows projected market growth until 2035 based on CAGR analysis. Actual outcomes may vary depending on changing demand, competition, and economic factors.To gain greater insights - request a sample report PDF
Revenue Potential Analysis
Revenue Landscape Across
Revenue potential is strongest across macro RAN modernization, small cells, massive MIMO radios, millimeter-wave densification, Open RAN, cloud RAN, and private 5G networks. Fixed wireless access is becoming a major commercial use case because 71% of FWA service providers now offer the service over 5G, up from 57% in June 2025. Speed-based FWA tariff plans are also used by 57% of FWA providers, supporting better monetization of 5G capacity.
India, North America, Northeast Asia, Western Europe, and Gulf countries remain key revenue regions because data traffic, 5G coverage, and standalone network upgrades are moving faster in these markets. India alone reached 430 million 5G subscriptions by the end of 2025, equal to 35% of total mobile subscriptions, while average monthly smartphone data use reached 37 GB. India is expected to cross 1.1 billion 5G subscriptions by 2031, creating strong demand for RAN capacity expansion and network efficiency upgrades.
Financial Impact
The financial impact of 5G RAN is linked to operator capital spending, spectrum availability, energy use, and network traffic growth. Global mobile and FWA network data traffic grew 22% year-on-year in Q1 2026, which raises the need for higher-capacity radios, improved uplink performance, and better cell-site optimization. This supports recurring software, optimization, and service revenue for vendors beyond the initial equipment sale.
Government funding and policy support are also improving the financial base for next-generation RAN. The U.S. Public Wireless Supply Chain Innovation Fund includes USD 1.5 billion to support open, interoperable, virtualized, and multi-vendor wireless networks. In March 2026, NTIA also shifted its next funding direction toward AI-enabled Radio Access Networks, showing that AI-RAN is becoming a priority area for public and private investment.
Risk Factors & Market Barriers
Risk Factors
The main risk is slow monetization. Operators have invested heavily in 5G coverage, but revenue growth from consumer 5G remains uneven unless services such as FWA, network slicing, enterprise private networks, and differentiated quality-of-service plans are commercialized effectively. The number of commercial 5G SA network slicing offerings increased from 65 to 84 in six months, but broad monetization is still in the early stage.
Technology risk is also rising because 5G RAN is becoming more software-defined, cloud-based, and AI-enabled. Operators must manage integration across radios, distributed units, centralized units, transport networks, cloud platforms, and automation layers. This increases the need for interoperability testing, cybersecurity controls, and skilled engineering teams, especially as Open RAN and AI-RAN move from trials into commercial networks.
Market Barriers
High deployment cost remains the largest market barrier. Operators must fund spectrum, towers, radios, power systems, fiber backhaul, software licenses, and site maintenance at the same time. This makes return on investment more difficult in rural areas and low-ARPU markets. In the U.S., the FCC is preparing a 2027 auction of 160 MHz in the Upper C-Band, showing that spectrum availability remains a major factor for future 5G and 6G network expansion.
Supply chain and vendor replacement risk can also slow RAN deployment. In June 2026, a U.S. spectrum auction raised more than USD 3.5 billion, with up to USD 3.3 billion expected to support the replacement of Chinese telecom equipment. Only 42% of funding recipients had completed replacement and disposal, with delays linked to permitting, supply chain issues, labor shortages, and severe weather. These constraints can delay RAN rollouts and increase project costs.
Recent Developments
In 2026, Ericsson launched AI-ready radios, antennas, and AI RAN software to support 5G-Advanced networks. The portfolio targets higher uplink performance, AI device traffic, augmented reality use cases, and improved network automation, making RAN upgrades more software-led and performance-focused.
In 2026, T-Mobile and Ericsson achieved a 5G-Advanced AI-RAN milestone, with Ericsson reporting up to 15% performance gains. This development shows that AI is moving from network analytics into active RAN optimization, where radio performance, energy use, and user experience can be improved in real time.
In 2026, Nokia expanded its AI-RAN partnership with NVIDIA and reported functional tests of Nokia anyRAN software on NVIDIA GPU-accelerated AI-RAN infrastructure. Customer integrations involved T-Mobile, Indosat, and SoftBank, while BT, Elisa, NTT DOCOMO, and Vodafone were also linked to AI-RAN momentum.
In 2026, Samsung and Orange Group expanded their vRAN and Open RAN partnership in Europe. The companies agreed to extend the number of vRAN and Open RAN sites in 2026, moving the technology from pilot activity toward broader field deployment.
Research Methodology
Methodology Area | Coverage Details |
|---|---|
Primary Research | Interviews with manufacturers, suppliers, distributors, consultants, procurement teams, and industry experts. |
Secondary Research | Company filings, annual reports, regulatory databases, government publications, trade associations, and verified industry sources. |
Data Validation | Cross-verification through source triangulation, historical trend review, demand-side checks, and supply-side assessment. |
Market Estimation | Bottom-up and top-down analysis based on product demand, regional consumption, company presence, and application-level usage. |
Forecasting Approach | Forecasts based on regulatory shifts, infrastructure investment, technology adoption, pricing trends, industrial expansion, and end-use demand. |
Quality Review | Analyst review, peer validation, outlier checks, internal consistency review, and final publication approval. |
AI Policy | AI is not used as a primary data source. All published insights are reviewed against human-verified evidence. |
Competitive Landscape
The market is characterized by intense competition among established players and emerging companies. Strategic partnerships, mergers and acquisitions, and product innovation are key strategies employed by market participants.
Key Market Players
Huawei Technologies Co., Ltd.
Telefonaktiebolaget LM Ericsson
Nokia
Qualcomm Technologies, Inc.
Intel Corporation
Samsung
Cisco Systems, Inc.
Verizon
Rakuten Symphony Singapore Pte. Ltd.
ZTE Corporation
VMware, Inc.
Fujitsu
Mavenir
Other Key Players
Meet the Team
This report was prepared by our expert analysts with deep industry knowledge and research experience.
Prashant is a skilled research analyst with five years of practical experience in market intelligence, strategic research, and business consulting. His expertise covers primary research, secondary research, competitive benchmarking, and industry trend analysis across sectors such as semiconductors, automotive, transportation and logistics, machinery, and industrial equipment. Prashant focuses on delivering clear, data-backed insights that help clients understand market shifts, technology adoption, regulatory developments, and emerging growth opportunities.
Sayali brings more than 5 years of experience to Globe Market Research, supporting the accuracy, clarity, and relevance of research content across multiple industries. She reviews market data, segment analysis, competitive insights, and industry trends to ensure each report meets strong quality standards and provides practical value to business decision-makers. Her expertise spans healthcare, information technology, consumer goods, and diverse cross-industry domains. With a strong focus on data reliability, structured analysis, and clear presentation, Sayali helps ensure that each research output delivers well-reviewed insights for clients, investors, consultants, and industry stakeholders.
Frequently Asked Questions
Related Reports
More in Information and Technology
Online Dating Market Size to hit USD 29.5 Bn by 2035
Global Online Dating Market Size, Go-to-Market Strategy Analysis By Type (Paying Online Dating, Non-Paying Online Dating), By Revenue Model (Subscription, Advertising-Supported, Other Model), By Platform (Web Portals, Applications), By Age Group (Adult, Baby Boomer, Generation X, Generation Z, Millennials), By Regional Insights, Business plan and Project Report, Investment Opportunities, Profitability, Industry Trends, Leading Companies and Growth Forecasts By 2025-2035
AI In Interior Design Market Size to hit USD 37.7 billion by 2035
Global AI In Interior Design Market Size, Go-to-Market Strategy Analysis By Component (Solution, Service), By Deployment (Cloud, On-Premises), By User Type (Homeowners, Real Estate Developers, Interior Designers, Architects, Corporate Clients), By Design Style (Traditional, Modern, Contemporary, Minimalist, Eclectic), By Technology Integration (3D Visualization Tools, Virtual Reality Solutions, Augmented Reality Applications, CAD Software, Machine Learning Algorithms), By Application (Residential Design, Commercial Design, Hospitality Design, Retail Spaces, Office Spaces), By Pricing Strategy (Subscription-Based, Freemium Model, Pay-Per-Use, One-Time License, Enterprise Licensing, Project-Based Pricing), By Regional Insights, Business plan and Project Report, Investment Opportunities, Profitability, Industry Trends, Leading Companies and Growth Forecasts By 2025-2035
Facility Management Market Size to hit USD 4.3 Trillion by 2035
Global Facility Management Market Size, Go-to-Market Strategy Analysis By Service Type (Hard Services, Soft Services), By Offering (In-House, Outsourced), By End User (Commercial, Industrial, Government and Public Sector, Residential, Institutional, Others), By Service Provider (Single Service Providers, Integrated Facility Management Providers, Bundled Service Providers), By Contract Type (Annual Contracts, Flexible Contracts, Performance-Based Contracts), By Regional Insights, Business plan and Project Report, Investment Opportunities, Profitability, Industry Trends, Leading Companies and Growth Forecasts By 2025-2035
Earned Wage Access Market Size to Exceed USD 93.5 billion by 2035
Global Earned Wage Access Market Size, Go-to-Market Strategy Analysis By Component (Solutions, Services), By Deployment Mode (Cloud-Based, On-Premises), By Access Type (Employer-Integrated EWA, Direct-to-Consumer EWA), By Pricing Model (Employer-Paid, Employee Transaction Fee, Subscription-Based, Hybrid), By End User (Large Enterprises, Small and Medium Enterprises, Gig Workers, Others), By Regional Insights, Business plan and Project Report, Investment Opportunities, Profitability, Industry Trends, Leading Companies and Growth Forecasts By 2025-2035