

Revenue, 2025
USD 70.5 Bn
Forecast, 2035
USD 297.9 Bn
CAGR, 2025-2035
15.5%
Report Coverage
Global
Market Size and Forecast
The Global Energy Management System Market was worth USD 70.5 billion in 2025 and is expected to reach USD 297.9 billion by 2035, growing at a CAGR of 15.5% from 2025 to 2035. Based on this growth rate, the market is estimated to reach around USD 93.2 billion in 2026. North America held the largest regional share of 38.8% in 2025, valued at around USD 27.3 billion, supported by strong building automation adoption, smart grid investment, industrial energy optimization, and strict energy efficiency standards.
The Energy Management System Market includes software, hardware, sensors, meters, analytics platforms, and control systems used to monitor, measure, optimize, and reduce energy consumption. These systems are widely used across commercial buildings, industrial facilities, data centers, utilities, hospitals, educational institutions, retail spaces, and residential complexes. The market is closely linked with energy efficiency, carbon reduction, power cost control, real-time monitoring, and smart infrastructure development.
The market outlook remains strong as organizations face rising electricity costs, sustainability targets, and pressure to improve operational efficiency. Growth can be attributed to increasing adoption of smart meters, IoT-based energy monitoring, AI-driven analytics, demand response systems, and cloud-based energy platforms. The expansion of North American smart building projects, grid modernization programs, and corporate decarbonization strategies is expected to support long-term market demand.
Key Parameter | Report Details |
|---|---|
Market Revenue, 2025 | USD 70.5 Billion |
Projected Revenue, 2035 | USD 297.9 Billion |
CAGR (2025-2035) | 15.5% |
Largest Region | North America (38.8%, USD 27.3 Bn) |
Fastest Growing Region | Asia Pacific |
Market Concentration | Medium |
Base Year | 2025 |
Forecast Period | 2025-2035 |
Demand is also increasing as businesses move from basic energy tracking to predictive and automated energy management. Modern systems help identify waste, balance peak loads, improve equipment performance, and support ESG reporting. This makes energy management systems important for companies looking to reduce costs, improve compliance, and build more resilient energy operations.
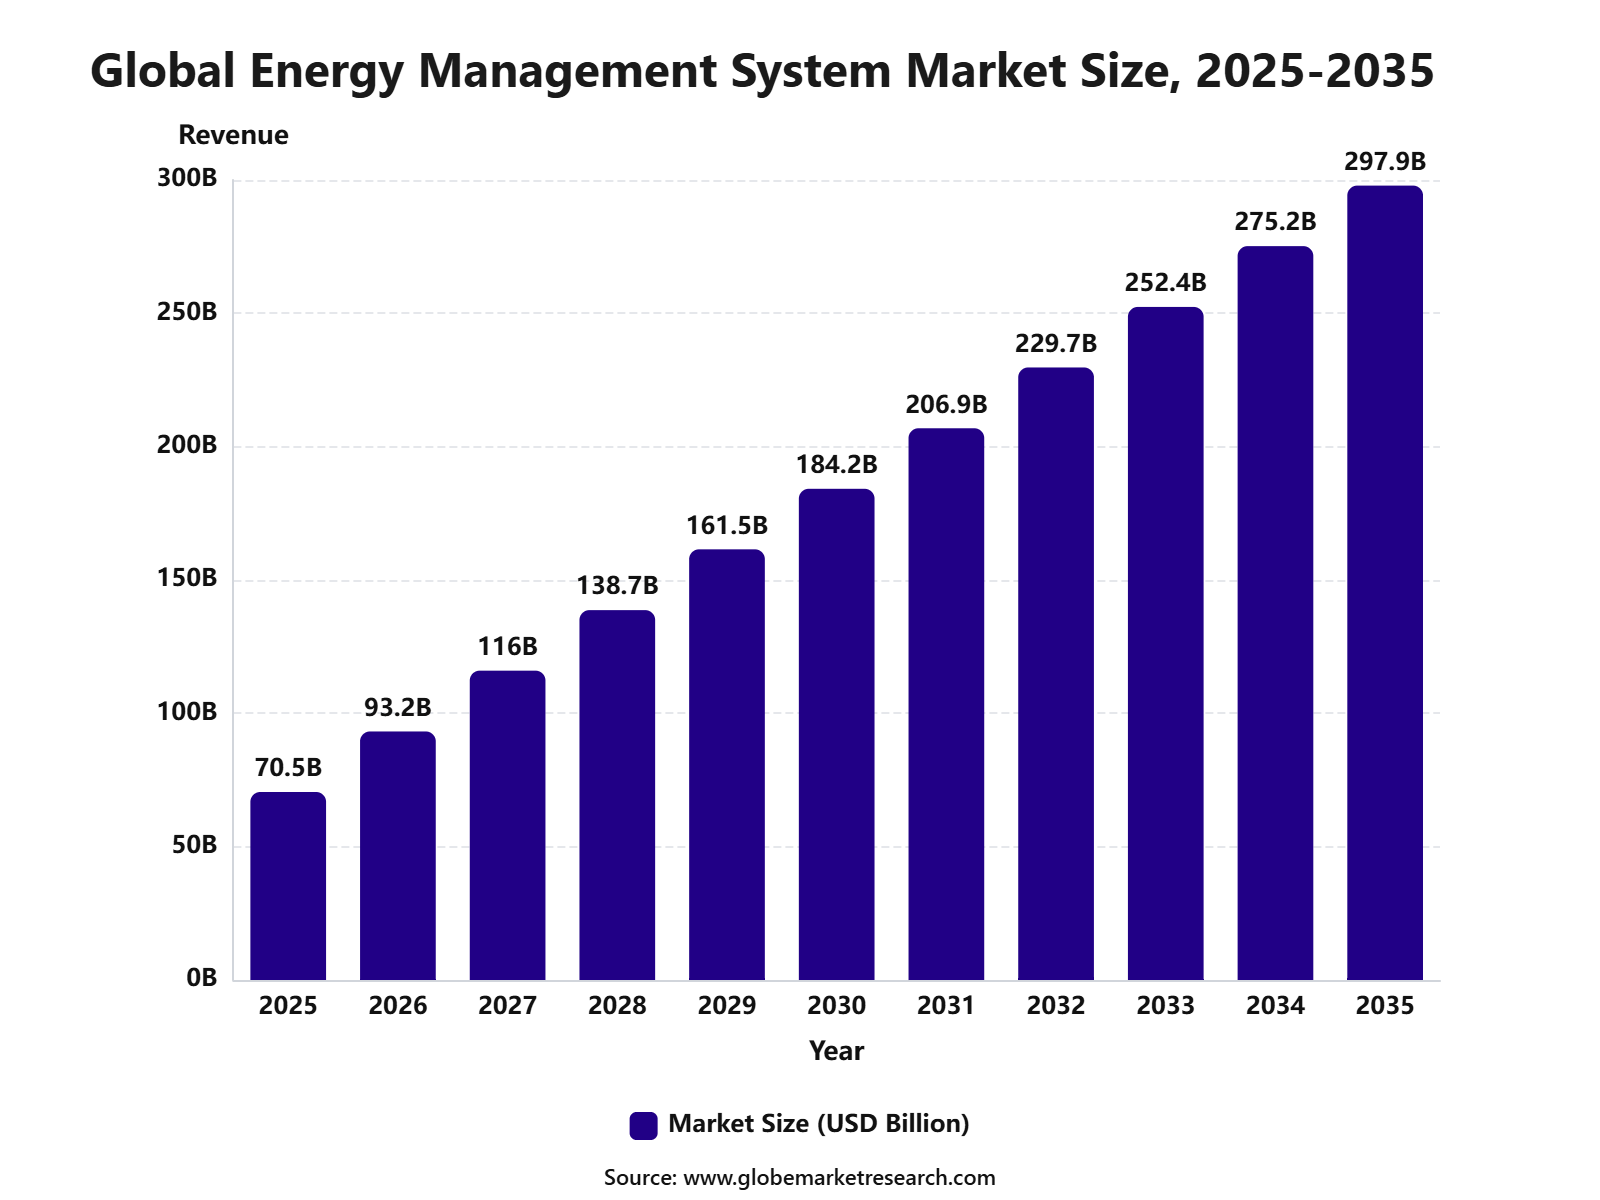 iThe graph shows projected market growth until 2035 based on CAGR analysis. Actual outcomes may vary depending on changing demand, competition, and economic factors.To gain greater insights - request a sample report PDF
Key Market Insights
Industrial energy management systems led the product segment with 71.8% share, supported by strong use in monitoring energy consumption, improving plant efficiency, reducing operating costs, and managing industrial power demand.
Hardware accounted for 64.6% share by component, driven by demand for meters, sensors, controllers, gateways, and monitoring devices used in real-time energy tracking.
On-premises deployment held 82.2% share, supported by stronger data control, system reliability, security needs, and direct integration with facility-level energy infrastructure.
Manufacturing captured 25.6% share by vertical, driven by high electricity consumption, process automation, energy cost pressure, and rising focus on operational efficiency.
North America led the energy management system market with 38.8% share, valued at USD 27.3 billion, supported by advanced industrial infrastructure, strong energy efficiency programs, and growing adoption of smart monitoring systems.
Top Funding and Investment
Top Investments
Schneider Electric announced a planned investment of over USD 700.0 million in its U.S. operations through 2027. The investment supports energy infrastructure, AI-related power demand, automation, manufacturing capacity, grid digitization, and energy efficiency solutions. The company also stated that the plan would create over 1,000 new U.S. jobs, while its U.S. investment would exceed USD 1 billion so far this decade.
Eaton announced a USD 340.0 million investment to increase U.S. production of three-phase transformers at a new Jonesville, South Carolina facility. The investment supports utility, industrial, commercial, building, and data center power needs, which are closely linked with energy monitoring, optimization, and power management systems. The facility is expected to create 700 jobs, with production and hiring planned to begin in 2027.
Siemens announced a €300 million investment in Germany to expand production of high-efficiency power distribution systems for data centers, e-mobility, and industrial automation. The project includes expansion of the Frankfurt switchgear factory and a new supplier facility in Offenbach, with up to 700 jobs expected by 2030. Siemens stated that its Smart Infrastructure business booked €1.9 billion in data center orders in Q2 2026, showing strong demand for smart electrification and energy control technologies.
ABB announced a USD 200 million investment across Europe to expand medium-voltage grid equipment production. The investment includes USD 100 million for a new factory in Dalmine, Italy, and USD 100.0 million to upgrade facilities in Bulgaria, Finland, Germany, Norway, and Poland. The project is expected to raise medium-voltage product manufacturing capacity by 50% to 300%, depending on the product line, and create about 800 jobs.
Sigenergy planned a USD 150 million to USD 200 million manufacturing investment in India for batteries and inverters. The planned unit is expected to require 30 to 50 acres and target 10 GW to 20 GW of capacity. The company highlighted its focus on AI-driven energy management systems that optimize solar, battery, and grid power use in real time.
Top Funding Developments
Verse raised an oversubscribed USD 54.0 million Series B round led by Bessemer Venture Partners, with participation from GV, NVIDIA, Norrsken VC, and others. The company launched Dispatch Intelligence, an energy orchestration offering designed to help data centers manage on-site energy resources alongside existing grid infrastructure and bring capacity online faster.
Equilibrium Energy raised USD 28.0 million in Series B2 funding led by GS Energy, with participation from NRG Energy and other investors. The funding supported the launch and scale-up of EQ Mission Control, an AI-powered energy portfolio management platform used for real-time forecasting, decision support, battery optimization, renewable energy portfolio management, and risk control.
Dexter Energy raised €23 million in Series C funding led by Alantra’s energy transition fund, Klima, with participation from Mirova and existing investors. The company uses AI-powered forecasting and trade optimization software for renewables and batteries, serving more than 80 energy companies. The funding is being used to expand battery trading, wind and solar optimization tools, and European market coverage.
Top Acquisitions
Arcadia entered an agreement to acquire ENGIE Impact, ENGIE’s utility expense and data management, energy procurement, and sustainability advisory business. What it acquired was a large enterprise energy management and advisory platform with a 30-year operating track record. The combined platform is expected to serve over 1,500 enterprise customers, including about 25% of the Fortune 500, manage over 4.5 million meters, and process more than USD 30.0 billion in annual utility payments.
ABB acquired Lumin, a U.S.-based residential energy management systems provider. What it acquired was a home energy management platform that provides behind-the-meter consumption insights, integrates with load centers, battery systems and generators, and dynamically manages loads such as EV chargers, heat pumps, hot tubs, and other home electrical assets.
By Product
Industrial energy management systems accounted for 71.8% share of the Energy Management System Market. This leading position is supported by the rising need to monitor, control, and optimize energy consumption across factories, utilities, processing plants, warehouses, and large industrial facilities.
These systems help companies track real-time energy use, identify wastage, improve equipment efficiency, and reduce operating costs. They are widely used in manufacturing plants, oil and gas facilities, chemical units, power generation sites, and heavy industries where energy costs represent a major part of total operating expenses.
Demand for industrial energy management systems is expected to remain strong as industries focus on energy efficiency, emissions reduction, and operational reliability. The growing use of automation, smart meters, sensors, and connected equipment will further support adoption across industrial environments.
By Component
Hardware accounted for 64.6% share of the Energy Management System Market. This dominance is driven by the high use of meters, sensors, controllers, communication devices, gateways, monitoring equipment, and power management devices in energy management infrastructure.
Hardware forms the foundation of energy management systems because it collects energy consumption data from machines, buildings, production lines, and utility systems. Without reliable hardware, software platforms cannot provide accurate monitoring, alerts, analytics, or energy-saving recommendations.
The segment is expected to maintain a strong position as industries and commercial facilities invest in smart energy infrastructure. Demand will be supported by the need for real-time data collection, equipment-level visibility, grid interaction, and better control over electricity, heating, cooling, and fuel usage.
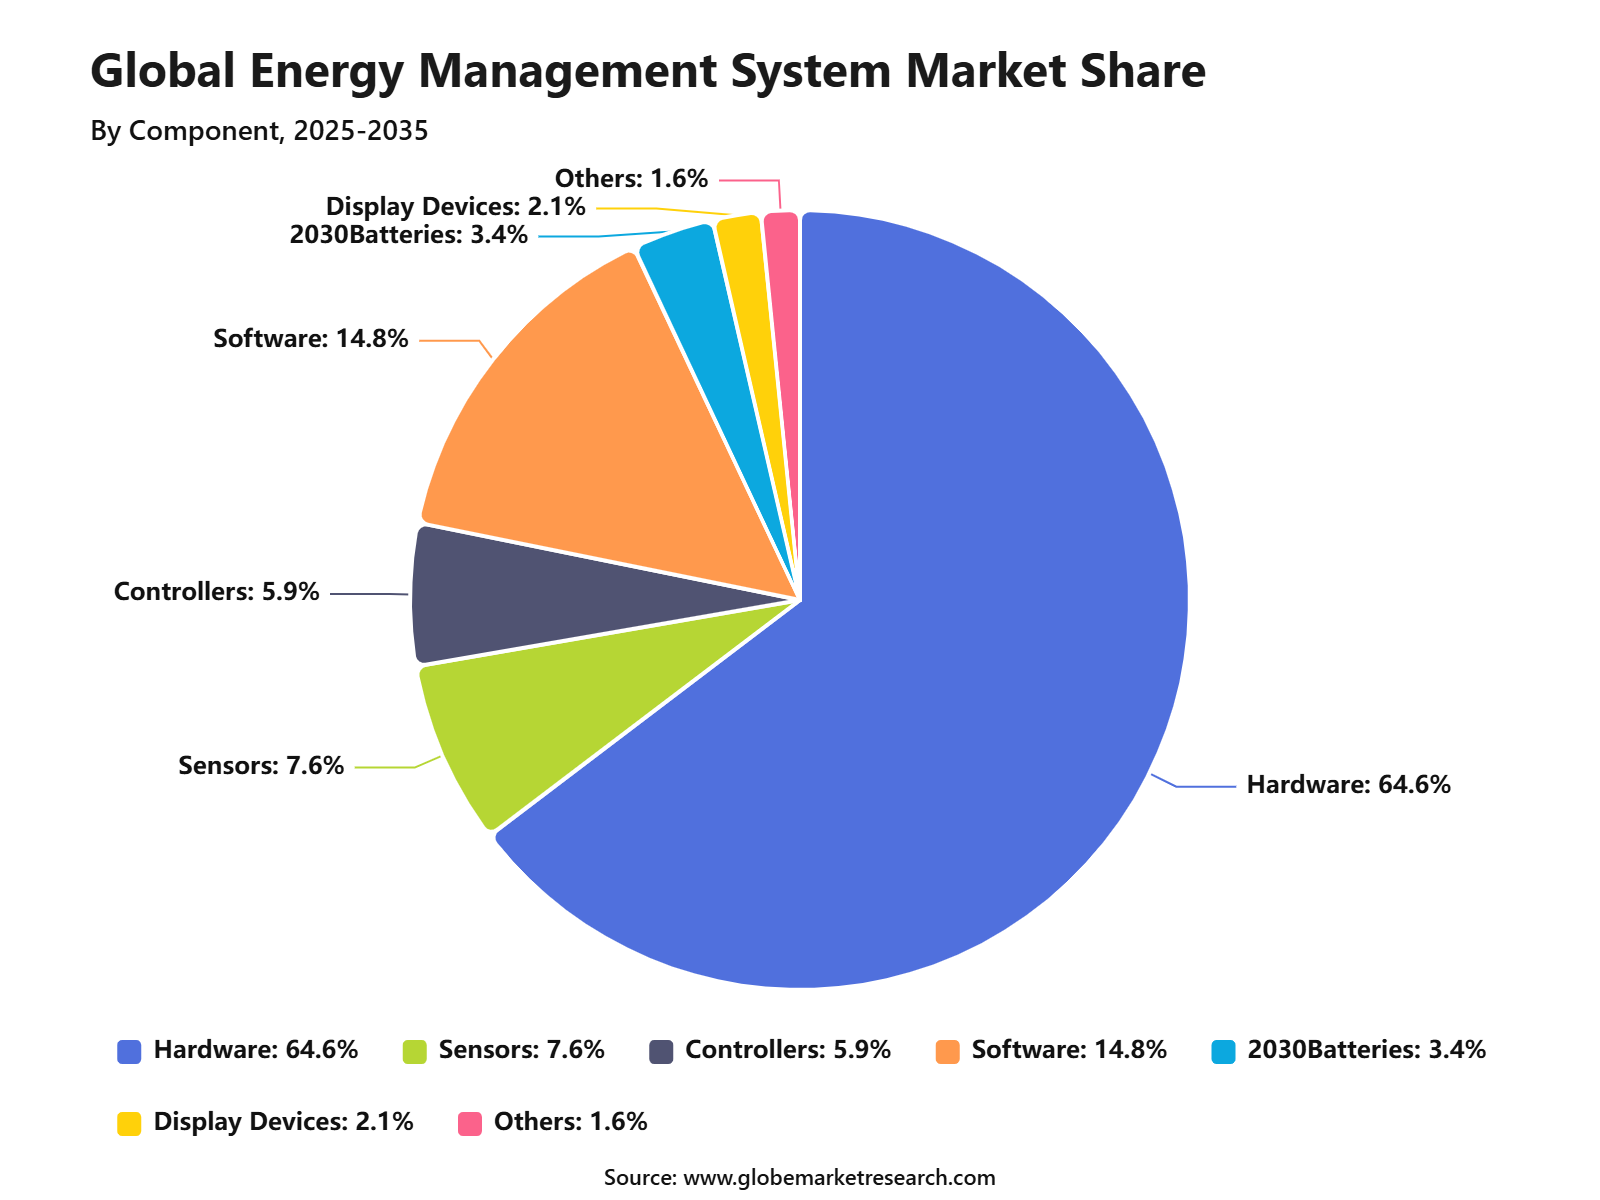 iThe graph shows projected market growth until 2035 based on CAGR analysis. Actual outcomes may vary depending on changing demand, competition, and economic factors.To gain greater insights - request a sample report PDF
By Deployment
On-premises deployment held 82.2% share of the Energy Management System Market. This leading share is supported by strong demand from industrial and large enterprise users that require full control over energy data, system security, and internal operations.
Many facilities prefer on-premises systems because energy management is closely linked with production systems, building controls, utility equipment, and plant-level automation. This deployment model allows organizations to manage sensitive operational data within their own infrastructure.
Demand for on-premises deployment is expected to remain high in manufacturing, utilities, oil and gas, chemicals, pharmaceuticals, and critical infrastructure. These sectors often require low-latency performance, strong cybersecurity controls, and direct integration with existing industrial control systems.
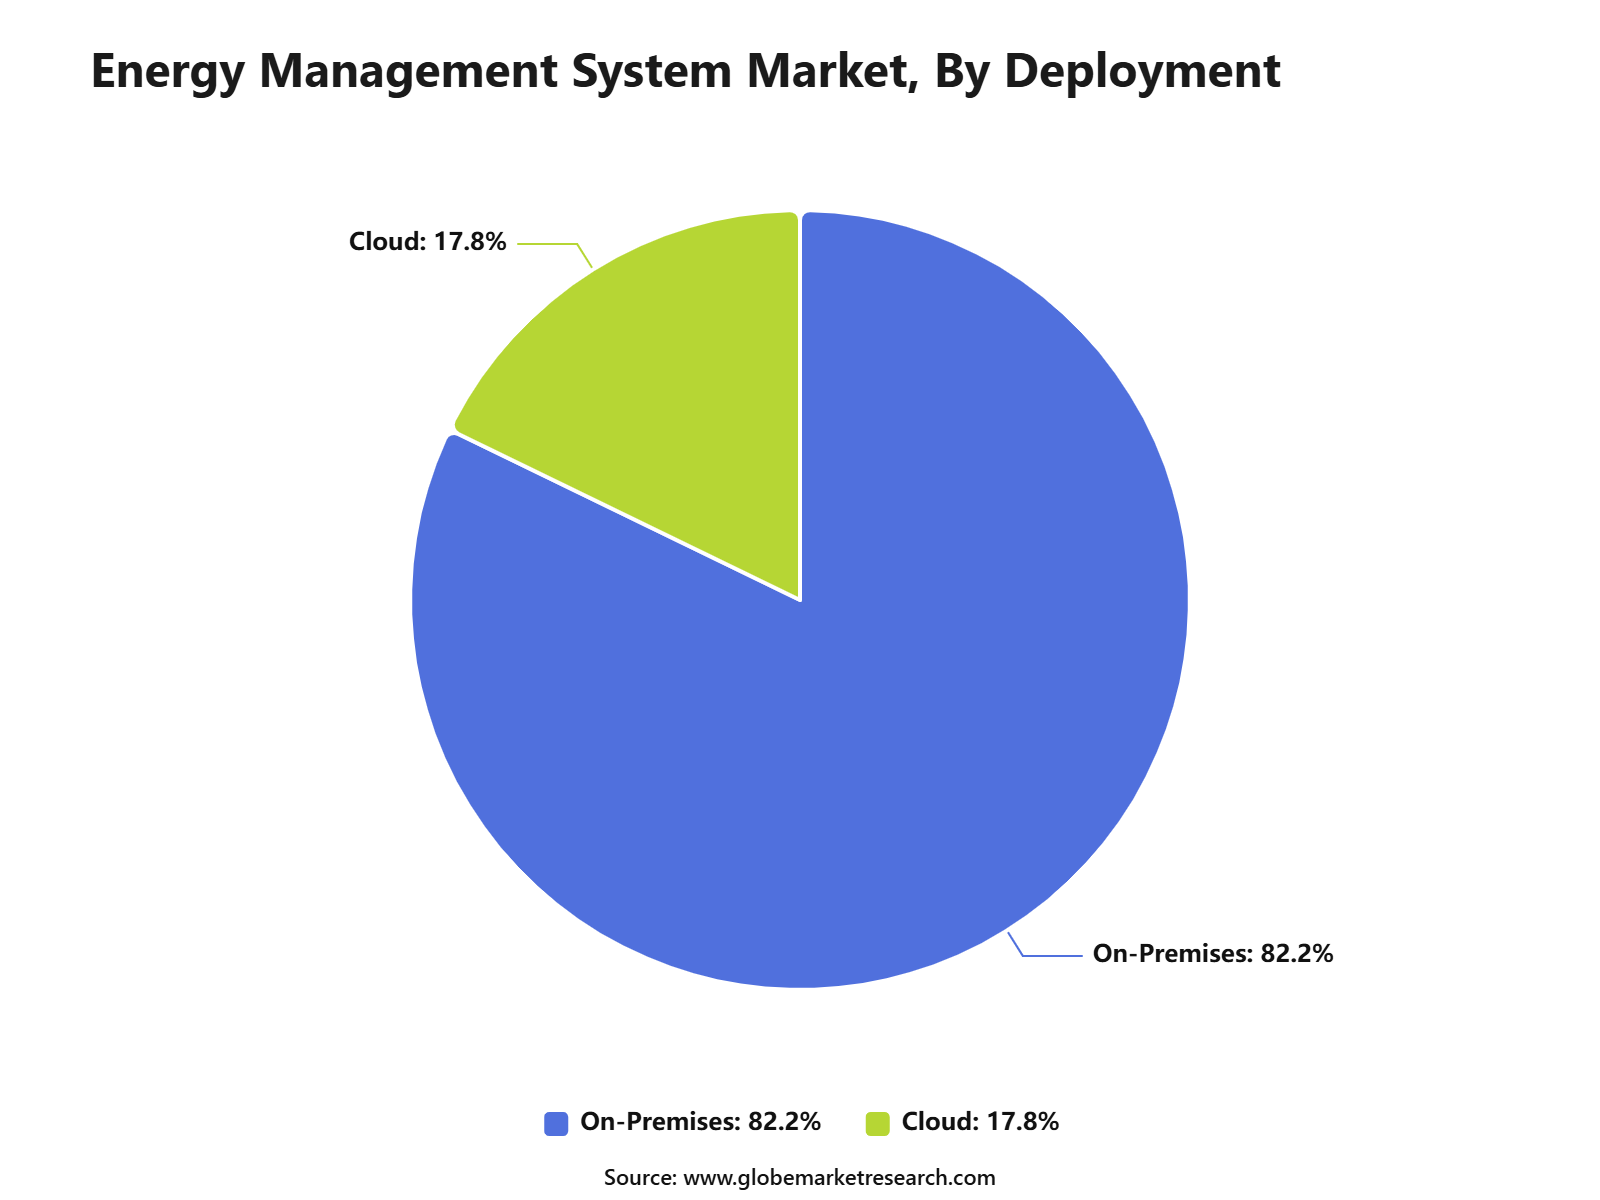 iThe graph shows projected market growth until 2035 based on CAGR analysis. Actual outcomes may vary depending on changing demand, competition, and economic factors.To gain greater insights - request a sample report PDF
By Vertical
Manufacturing accounted for 25.6% share of the Energy Management System Market. This leading position is driven by high energy consumption across production lines, motors, compressors, boilers, HVAC systems, furnaces, lighting, and process equipment.
Energy management systems help manufacturers reduce energy waste, improve equipment performance, and control peak demand charges. These systems also support compliance with energy efficiency standards and help companies track sustainability targets more accurately.
The segment is expected to remain a major demand area as factories increase automation and adopt smart manufacturing practices. Rising electricity costs, carbon reduction targets, and the need for uninterrupted production will continue to support energy management system adoption in manufacturing facilities.
By Region
North America accounted for 38.8% share of the Energy Management System Market, reaching USD 27.3 billion. The region’s leadership is supported by advanced industrial infrastructure, high energy efficiency awareness, strong digital adoption, and rising investment in smart buildings and smart factories.
The United States and Canada are key contributors due to strong demand from manufacturing, commercial buildings, utilities, data centers, healthcare facilities, and public infrastructure. Energy management systems are being used to reduce electricity costs, improve grid reliability, and support corporate sustainability programs.
North America is expected to maintain a strong position as companies continue to invest in energy optimization, building automation, and industrial digitalization. Demand will remain supported by rising power costs, stricter efficiency goals, and wider deployment of connected energy monitoring hardware.
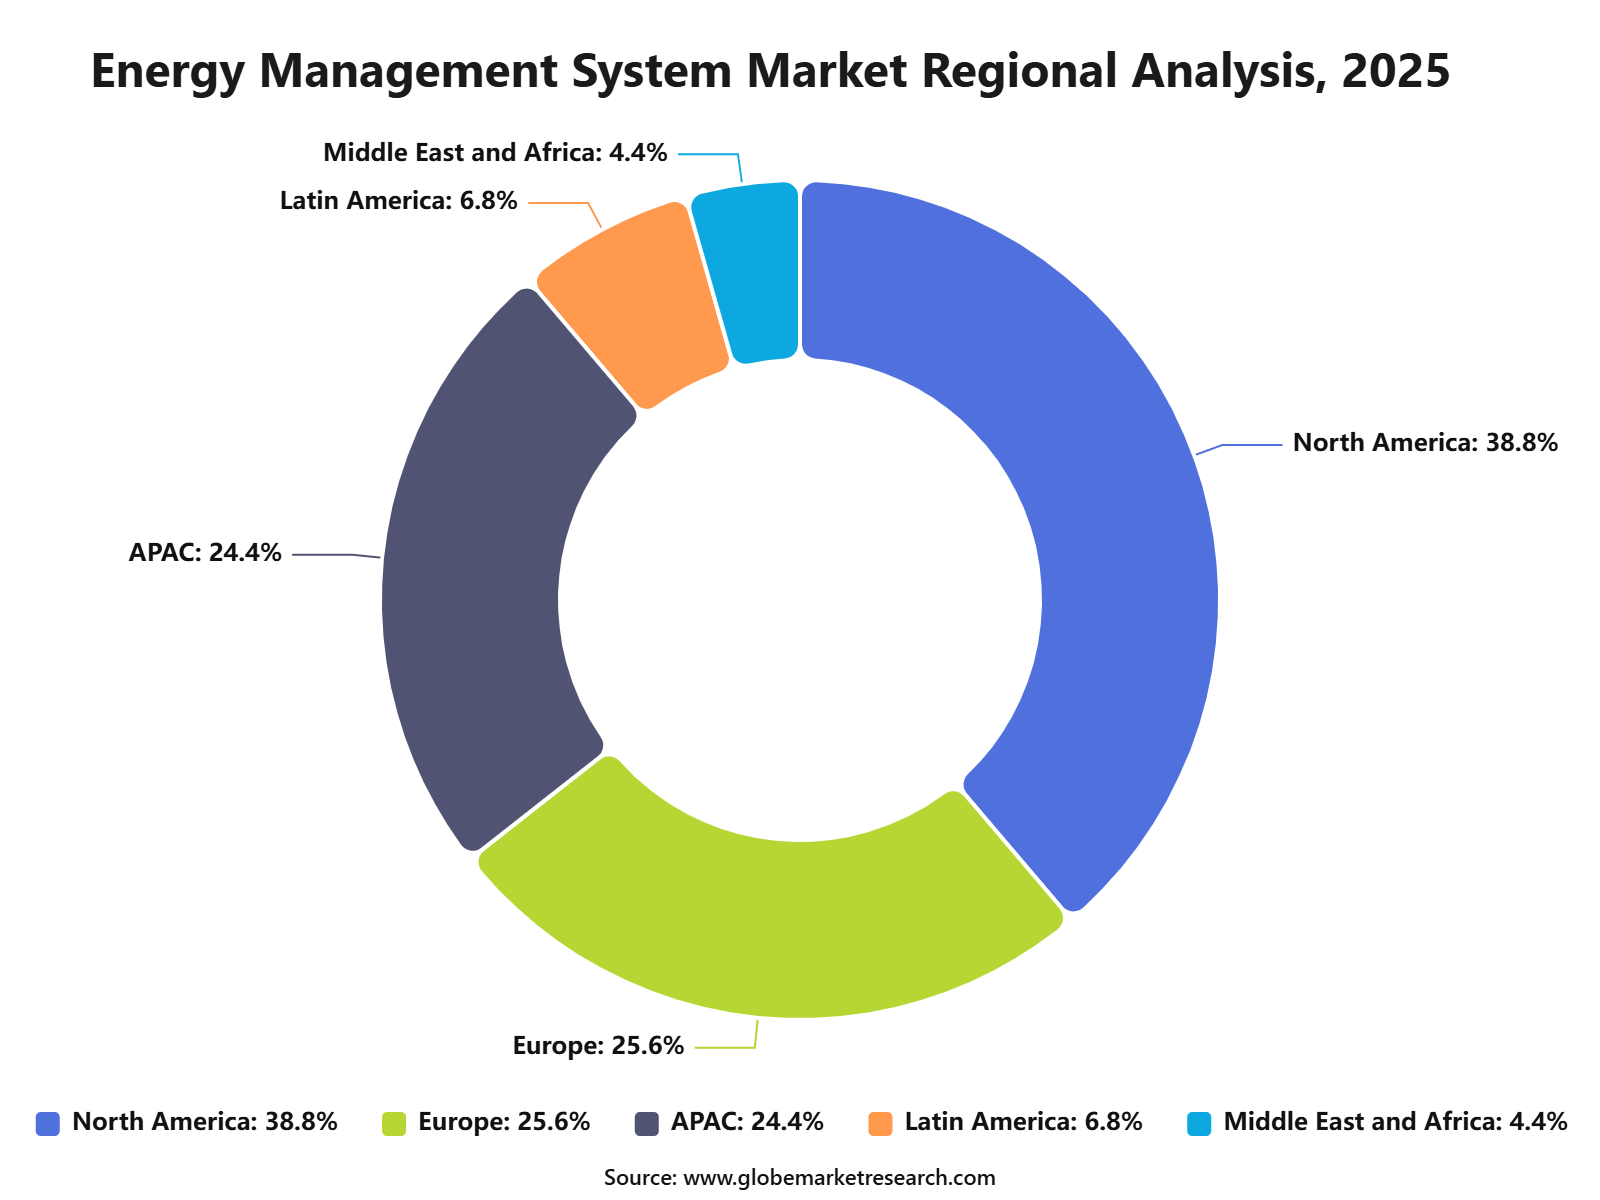 iThe graph shows projected market growth until 2035 based on CAGR analysis. Actual outcomes may vary depending on changing demand, competition, and economic factors.To gain greater insights - request a sample report PDF
Regional Impact Analysis
North America leads the Energy Management System Market with 38.8% share in 2025, valued at around USD 27.4 billion, supported by strong commercial building automation, industrial energy efficiency programs, utility demand response, and growing adoption of cloud-based energy platforms. The U.S. remains the main regional driver due to high energy consumption across buildings, industries, and data centers.
Europe remains important because of strict energy efficiency rules, carbon reduction targets, and demand for building performance improvement. Asia Pacific is expected to build future demand through smart city projects, industrial expansion, rising electricity consumption, and energy digitalization across China, India, Japan, South Korea, and Southeast Asia.
Impact Factor | Estimated CAGR Impact | Regional Relevance | Market Impact |
|---|---|---|---|
North America market leadership | +4.8% | North America, 38.8% share in 2025 | Leads global value demand. |
U.S. smart building and data center demand | +3.7% | U.S. | Drives regional growth. |
Canada energy efficiency modernization | +2.5% | Canada | Supports steady adoption. |
Europe energy performance regulation | +2.3% | Germany, UK, France, Netherlands | Builds compliance-led growth. |
Asia Pacific smart city and industrial demand | +2.7% | China, India, Japan, South Korea | Supports future scale. |
Drivers Impact Analysis
The Energy Management System Market is driven by rising electricity costs, energy efficiency targets, carbon reduction goals, smart building adoption, industrial automation, and growing demand for real-time energy monitoring. Companies are using EMS platforms to track consumption, reduce wastage, manage peak load, and improve operational efficiency.
North America leads the market due to strong adoption across commercial buildings, utilities, manufacturing facilities, data centers, healthcare, and public infrastructure. The U.S. remains the main regional contributor because businesses are investing in digital energy control, demand response, smart meters, and building automation systems.
Impact Factor | Estimated CAGR Impact | Regional Relevance | Market Impact |
|---|---|---|---|
Rising electricity cost pressure | +4.2% | North America, Europe, Asia Pacific | Drives energy optimization demand. |
Growth in smart buildings | +3.7% | U.S., Canada, Europe, Japan | Expands EMS deployment. |
Industrial energy efficiency needs | +3.2% | Manufacturing and process industries | Reduces operating cost. |
Carbon reduction and ESG goals | +2.8% | North America and Europe | Supports enterprise adoption. |
Demand response and grid flexibility | +2.3% | Utilities and commercial users | Improves load management. |
Restraints Impact Analysis
The market faces restraints from high implementation cost, complex integration with legacy systems, limited technical expertise, and data management challenges. Many organizations still operate older meters, building systems, and industrial equipment that need upgrades before EMS can deliver full value.
Another restraint is the long payback concern for smaller businesses. While large enterprises can justify energy management investments through savings and compliance benefits, SMEs may delay adoption due to budget pressure and limited internal energy teams.
Impact Factor | Estimated CAGR Impact | Regional Relevance | Market Impact |
|---|---|---|---|
High initial implementation cost | -2.1% | SMEs and public facilities | Slows faster adoption. |
Legacy system integration issues | -1.8% | Industrial and commercial buildings | Adds deployment complexity. |
Limited energy management expertise | -1.5% | Emerging and mid-sized markets | Affects system usage. |
Data quality and interoperability gaps | -1.3% | Multi-site enterprises | Reduces analytics accuracy. |
Long payback concerns | -1.0% | Cost-sensitive customers | Delays buying decisions. |
Opportunities Impact Analysis
Opportunities are strong in building energy management systems, industrial EMS, home energy management, utility demand response, data center energy optimization, and cloud-based energy analytics. These areas benefit from rising energy prices and stronger focus on measurable efficiency gains.
Higher-value opportunities are emerging in AI-based energy forecasting, IoT-connected energy systems, smart grid integration, renewable energy management, and battery storage coordination. Vendors that offer easy integration, clear savings dashboards, and scalable cloud platforms can capture stronger long-term demand.
Impact Factor | Estimated CAGR Impact | Regional Relevance | Market Impact |
|---|---|---|---|
Building energy management systems | +4.0% | North America, Europe, Asia Pacific | Builds core market opportunity. |
Industrial energy optimization | +3.4% | U.S., Canada, China, Germany, India | Reduces production energy cost. |
AI-based energy analytics | +2.9% | Advanced digital markets | Improves forecasting and control. |
Smart grid and demand response integration | +2.5% | Utilities and commercial users | Adds grid-side value. |
Renewable and storage energy management | +2.1% | Clean energy regions | Supports distributed energy use. |
Challenges Impact Analysis
The main challenge is proving measurable savings across different customer environments. Energy performance depends on building type, equipment condition, user behavior, occupancy patterns, weather, and operating schedules.
Another challenge is cybersecurity and data protection. EMS platforms connect meters, sensors, building systems, industrial equipment, and cloud dashboards, so strong security is needed to protect operational data and prevent unauthorized access.
Impact Factor | Estimated CAGR Impact | Regional Relevance | Market Impact |
|---|---|---|---|
Proving measurable energy savings | -1.8% | Commercial and industrial users | Affects customer confidence. |
Cybersecurity risk in connected systems | -1.6% | Smart buildings and utilities | Raises protection needs. |
Managing multi-site energy data | -1.3% | Large enterprises | Adds operational complexity. |
User adoption and behavior change | -1.1% | Buildings and facilities teams | Impacts savings delivery. |
Vendor and protocol fragmentation | -0.9% | Global EMS deployments | Limits system compatibility. |
Segment Covered in the Report
By Product
Industrial Energy Management Systems
Building Energy Management Systems
Home Energy Management Systems
By Component
Hardware
Sensors
Controllers
Software
Batteries
Display Devices
Others
By Deployment
On-Premises
Cloud
By Vertical
Telecom and IT
Retail and Offices
Others
By Region
North America
Europe
Asia Pacific
Latin America
Middle East and Africa
Market Trend Analysis
The market trend is moving toward cloud-based EMS, AI-driven energy optimization, smart building platforms, IoT-enabled monitoring, automated demand response, and carbon reporting integration. Energy management is becoming part of wider building automation and sustainability planning.
North America remains the value leader because of strong digital infrastructure, large commercial building stock, utility demand response programs, and growing data center energy needs. Europe and Asia Pacific are also expanding through energy efficiency regulation, industrial modernization, and smart city projects.
Impact Factor | Estimated CAGR Impact | Regional Relevance | Market Impact |
|---|---|---|---|
Cloud-based EMS adoption rises | +3.8% | North America, Europe, Asia Pacific | Enables scalable deployment. |
AI energy optimization grows | +3.2% | Advanced enterprise markets | Improves savings accuracy. |
Smart building integration expands | +2.8% | Commercial real estate and public buildings | Supports automated control. |
Carbon and energy reporting tools gain use | +2.3% | ESG-focused enterprises | Links EMS with sustainability. |
Demand response automation increases | +2.0% | Utilities and large buildings | Improves grid participation. |
Investor Type Impact Matrix
Investors should focus on EMS companies with strong cloud platforms, AI analytics, building automation partnerships, smart meter integration, and proven savings measurement. Vendors that can serve commercial, industrial, utility, and multi-site enterprise customers are better positioned for long-term growth.
Strategic investors can also target building energy management providers, industrial EMS firms, demand response software companies, IoT energy monitoring platforms, and carbon reporting solution providers. Companies that connect energy savings with sustainability reporting and grid flexibility can capture stronger market value.
Investor Type | Estimated CAGR Impact | Regional Relevance | Market Impact |
|---|---|---|---|
Energy Management Software Providers | +3.6% | Global | Expands digital energy control. |
Building Energy Management Companies | +3.0% | North America, Europe, Asia Pacific | Supports smart building adoption. |
Industrial EMS Providers | +2.5% | Manufacturing and process industries | Reduces energy operating cost. |
Demand Response and Grid Software Firms | +2.1% | Utility and commercial markets | Adds load flexibility value. |
Strategic Clean Technology Investors | +1.8% | Global energy efficiency markets | Funds platform scale and integration. |
Recent Developments
February 2026: GE Vernova launched GridOS for Distribution, a unified grid software solution helping utilities operate distribution networks, manage rising demand and coordinate distributed energy resources more intelligently.
March 2026: ABB launched ABB Ability BuildingPro Suites, a modular software platform that unifies building, energy, HVAC and automation data into one cybersecure environment for data-driven performance.
June 2026: Johnson Controls launched Metasys 16.0, the latest version of its flagship building automation system, supporting high-performance environments where uptime, resilience and building operational control are critical.
March 2025: GridPoint raised USD 45 million in strategic funding, including USD 20 million from Marunouchi Innovation Partners, to support its building energy management platform and planned international expansion.
Competitive Landscape
The market is characterized by intense competition among established players and emerging companies. Strategic partnerships, mergers and acquisitions, and product innovation are key strategies employed by market participants.
Key Market Players
Siemens AG
Honeywell International Inc.
Schneider Electric
ABB Ltd.
Johnson Controls
Eaton Corporation
General Electric Company
Emerson Electric Co.
GridPoint
C3.ai
Daikin Industries
Elster Group GmbH
Other Key Players
Research Methodology
This market study is prepared using a combination of primary and secondary research. Primary research includes discussions with manufacturers, suppliers, distributors, consultants, industry experts, and end users. Secondary research covers company reports, government databases, trade associations, technical publications, regulatory sources, and trusted industry documents. The collected information is used to assess market demand, pricing trends, technology adoption, competitive activity, and regional performance.
AI language models are not used as primary data sources, and publicly available AI-generated content is not treated as market evidence. Computational tools may be used to support data processing, translation, data classification, and pattern identification. However, every published assessment is supported by verified sources, human review, and primary market discussions.
Market estimates are developed through top-down and bottom-up approaches and validated using data triangulation. Revenue, production, shipment, pricing, and application-level data are compared across multiple sources. Forecasts consider economic conditions, regulatory changes, investment activity, innovation, supply chain developments, and industry risks. All findings are reviewed through source verification and internal quality checks before publication.
Part I
Source Management & Input Data Standards
Who provides data, how sources are qualified, and what types of evidence are admissible.
Part II
Research Scope & Market Coverage
How we define the markets we assess and the parameters that govern each product.
Part III
Data Collection, Verification & Submission
The mechanics of gathering, cross-checking, and hierarchically ranking evidence.
Part IV
Assessment Determination & Quality Controls
How raw data becomes a published assessment — normalisation, expert judgement, and outlier exclusion.
Part V
Publication, Corrections & Revision
Our publication schedule, corrections policy, and methodology review cycle.
Part VI
Independence, Ethics & Complaints
Conflict-of-interest policies, editorial independence, and how clients raise concerns.
Google · Preferred Sources
Don't miss the latest market research insights and industry updates on Google.
Add Globe Market Research as a preferred source in the Google app to see our reports, analysis, and market stories in your news suggestions.
Meet the Team
This report was prepared by our expert analysts with deep industry knowledge and research experience.
Pratiksha K. is a Senior Research Analyst with more than five years of experience in market research, industry analysis, competitive intelligence, and business strategy. She has contributed to detailed market reports, customized research studies, company profiling, market sizing, trend analysis, and strategic consulting projects for clients across different regions. Her industry expertise covers Chemical and Material, Consumer Goods, Food & Beverages and Energy & Power. She closely evaluates changing customer requirements, technology developments, regulatory conditions, supply chain structures, investment activity, and competitive strategies to provide clear and practical market insights.
Sayali brings more than 7 years of experience to Globe Market Research, supporting the accuracy, clarity, and relevance of research content across multiple industries. She reviews market data, segment analysis, competitive insights, and industry trends to ensure each report meets strong quality standards and provides practical value to business decision-makers. Her expertise spans healthcare, information technology, consumer goods, and diverse cross-industry domains. With a strong focus on data reliability, structured analysis, and clear presentation, Sayali helps ensure that each research output delivers well-reviewed insights for clients, investors, consultants, and industry stakeholders.
Frequently Asked Questions
Related Reports
More in Energy and Power
Oil and Gas Turbomachinery Market to Hit USD 26.9 Billion by 2035
Oil and Gas Turbomachinery Market Size, Share, Analysis By Type (Gas Compressors, Gas and Steam Turbines, Pumps, Other Types), By Deployment (Onshore, Offshore), By Industry (Upstream, Midstream, Downstream), By Regional Insights, Business plan and Project Report, Investment Opportunities, Profitability, Industry Trends, Leading Companies and Growth Forecasts by 2025-2035
Liquefied Natural Gas (LNG) Bunkering Market to Hit USD 51.7 Billion by 2035
Liquefied Natural Gas (LNG) Bunkering Market Size, Share, Analysis By Product Type (Ship-to-Ship, Truck-to-Ship, Port-to-Ship, Portable Tanks), By Application (Cargo Fleet, Tanker Fleet, Container Fleet, Ferries, Inland Vessels, Others), By Regional Insights, Business plan and Project Report, Investment Opportunities, Profitability, Industry Trends, Leading Companies and Growth Forecasts by 2025-2035
Wind Energy Market to Hit USD 348.1 Billion by 2035
Wind Energy Market Size, Share, Analysis By Location (Onshore, Offshore), By Application (Utility, Non-Utility), By Component(Turbine, Support Structure, Electrical Infrastructure, Others), By Regional Insights, Business plan and Project Report, Investment Opportunities, Profitability, Industry Trends, Leading Companies and Growth Forecasts by 2025-2035
Power EPC Market to Hit USD 1,516.1 Billion by 2035
Power EPC Market Size, Share, Analysis By Type of Power Generation (Thermal Power, Renewable Energy, Nuclear Power, Hydropower, Others), By Service Type (Engineering, Procurement, Construction), By Equipment Type (Steam Turbines, Gas Turbines, Solar PV Systems, Wind Turbines, Boilers, Generators, Others), By Regional Insights, Business plan and Project Report, Investment Opportunities, Profitability, Industry Trends, Leading Companies and Growth Forecasts by 2025-2035