

Revenue, 2025
USD 110.1 Bn
Forecast, 2035
USD 348.1 Bn
CAGR, 2025-2035
12.2%
Report Coverage
Global
Market Size and Forecast
The Global Wind Energy Market was worth USD 110.1 billion in 2025 and is expected to reach USD 348.1 billion by 2035, growing at a CAGR of 12.2% from 2025 to 2035. Based on this growth rate, the market is estimated to reach around USD 133.9 billion in 2026. Asia Pacific held the largest regional share of 44.3% in 2025, valued at around USD 48.7 billion, supported by large wind power installations, strong renewable energy targets, offshore wind development, and rising electricity demand.
The Wind Energy Market includes electricity generated from onshore and offshore wind turbines, along with related components, project development, installation, grid connection, and maintenance services. It covers utility-scale wind farms, distributed wind systems, turbine blades, towers, nacelles, generators, control systems, and offshore foundations. The market is closely linked with clean power generation, grid decarbonization, energy security, and renewable infrastructure investment.
Key Parameter | Report Details |
|---|---|
Market Revenue, 2025 | USD 110.1 Billion |
Projected Revenue, 2035 | USD 348.1 Billion |
CAGR (2025-2035) | 12.2% |
Largest Region | Asia Pacific (44.3%, USD 48.7 Bn) |
Market Concentration | Medium |
Base Year | 2024 |
Forecast Period | 2025-2035 |
The market outlook remains strong as governments, utilities, and private developers continue expanding wind capacity to reduce dependence on fossil fuels. Growth can be attributed to falling wind power costs, larger turbine designs, offshore wind auctions, and stronger demand for low-carbon electricity. The expansion of Asia Pacific wind projects, manufacturing capacity, and grid modernization is expected to support long-term market demand.
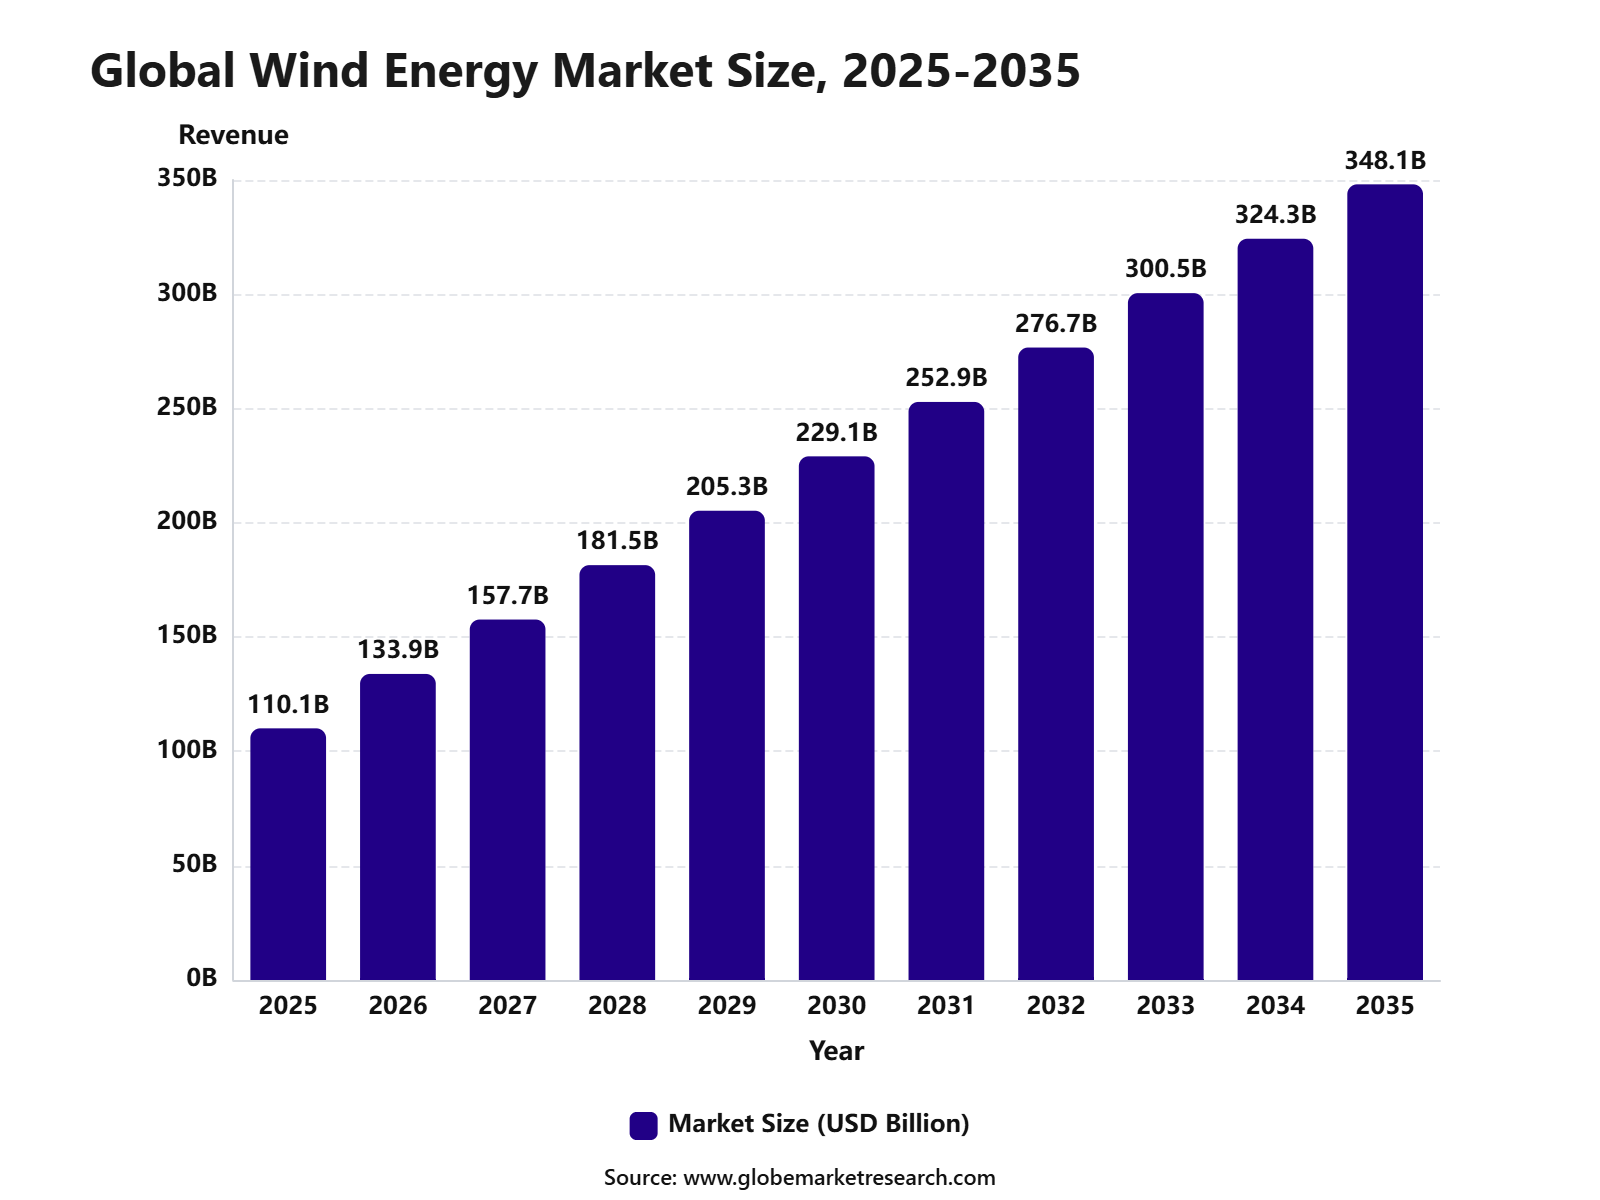 iThe graph shows projected market growth until 2035 based on CAGR analysis. Actual outcomes may vary depending on changing demand, competition, and economic factors.To gain greater insights - request a sample report PDF
Key Market Insights
Onshore wind led the location segment with 71.1% share, supported by lower installation costs, easier grid connectivity, faster project development, and strong adoption across utility-scale wind farms.
Utility applications accounted for 65.8% share, driven by rising demand for large-scale renewable electricity generation, grid decarbonization, and long-term clean power procurement.
Turbines held 45.9% share by component, supported by their central role in wind power generation, energy conversion efficiency, and continued investment in larger, higher-capacity systems.
Asia Pacific led the wind energy market with 44.3% share, valued at USD 48.7 billion, supported by rapid renewable energy expansion, strong wind project pipelines, and large-scale installations across China, India, Japan, and Southeast Asia.
Top Funding and Investment
Top Investments
Dominion Energy updated the total investment required for the Coastal Virginia Offshore Wind project to USD 10.7 billion, excluding financing costs. The project cost increased by approximately 9% due primarily to higher grid upgrade and onshore interconnection expenses. The development will include 176 offshore turbines with a planned generation capacity of approximately 2.6 GW.
Vattenfall allocated SEK 59 billion, representing 64% of its planned growth investments for 2026 to 2030, to new wind power capacity. Major projects include the 1.6 GW Nordlicht I and II offshore wind cluster in Germany and the phased 2 GW Zeevonk offshore wind development in the Netherlands.
ScottishPower confirmed plans to invest GBP 6 billion in offshore wind developments across the East Anglia Hub. The program includes completing the 1.4 GW East Anglia Three project, advancing further offshore capacity, and supporting supply-chain infrastructure. The company also plans to complete four onshore wind farms with a combined capacity of 320 MW.
Ørsted invested a further GBP 2 million in a geotechnical seabed survey for the proposed Mooir Vannin offshore wind farm. The survey supports engineering, foundation design, and construction planning. Ørsted estimates that the complete development, construction, operation, and decommissioning program could require a total investment of approximately GBP 4.5 billion.
RWE approved the repowering of the Muel onshore wind farm in Aragón, Spain. The company will replace 27 ageing turbines with three modern turbines rated at 6.6 MW each, increasing total capacity from 16.2 MW to 19.8 MW while reducing the number of installed units. The capital expenditure value was not disclosed.
Top Funding Transactions
Iberdrola secured approximately GBP 3.6 billion, equivalent to EUR 4.1 billion, in green project financing for the East Anglia Three offshore wind farm. Financing was provided by 23 commercial banks and the Danish Export and Investment Fund. The project will have an installed capacity of 1,400 MW and is scheduled to become operational by the end of 2026.
ESB and Red Rock Renewables raised more than GBP 3.5 billion for the Inch Cape offshore wind project through financing from 22 commercial banks. The 1,080 MW development will use 72 Vestas turbines, each rated at 15 MW, and is expected to generate almost 5 TWh of electricity annually after commercial operations begin.
Ocean Winds secured approximately EUR 2 billion in project financing for the 390 MW BC-Wind offshore wind farm in Poland. The financing includes support from the European Investment Bank, which contributed close to one-third of the package, together with ICO and 13 commercial banks. The project will include 26 offshore turbines and is expected to deliver first electricity in 2028.
Top Acquisitions
Vestas completed the acquisition of LM Wind Power’s onshore wind turbine blade manufacturing facility in Goleniów, Poland. The acquired plant manufactures blades for Vestas turbines, including the V172-7.2 MW platform. Approximately 400 former LM Wind Power employees were retained, increasing Vestas’ total workforce in Poland to nearly 2,000 employees.
Encavis acquired the Zeven and Raßlitz onshore wind farms from Energiequelle, adding approximately 59 MW of operating and near-operational wind capacity. Zeven includes eight Vestas V162 turbines and is expected to generate around 139 GWh annually, while Raßlitz contains two Enercon turbines producing approximately 36 GWh per year.
By Location
Onshore wind energy accounted for 71.1% share of the Wind Energy Market. This leading position is supported by lower installation costs, easier grid connection, simpler maintenance access, and wider availability of suitable land-based wind sites.
Onshore wind farms are widely preferred by utilities, independent power producers, and industrial energy users because they offer scalable clean power generation with proven technology. These projects can be developed across plains, coastal areas, agricultural land, and open terrain where wind resources are strong.
Demand for onshore wind energy is expected to remain strong as countries expand renewable power capacity and reduce dependence on fossil-based electricity. The segment will continue to benefit from improved turbine efficiency, larger rotor designs, and grid modernization investments.
By Application
Utility applications accounted for 65.8% share of the Wind Energy Market. This dominance is driven by the large use of wind farms for grid-scale electricity generation, renewable power procurement, and national clean energy targets.
Utility-scale wind projects are preferred because they can generate high volumes of electricity and support long-term power purchase agreements. These projects help utilities diversify power supply, reduce carbon emissions, and improve energy security across regional grids.
The segment is expected to remain the largest application area as governments and power companies increase investment in renewable infrastructure. Demand will remain supported by rising electricity consumption, corporate clean energy buying, and the need for low-cost renewable power generation.
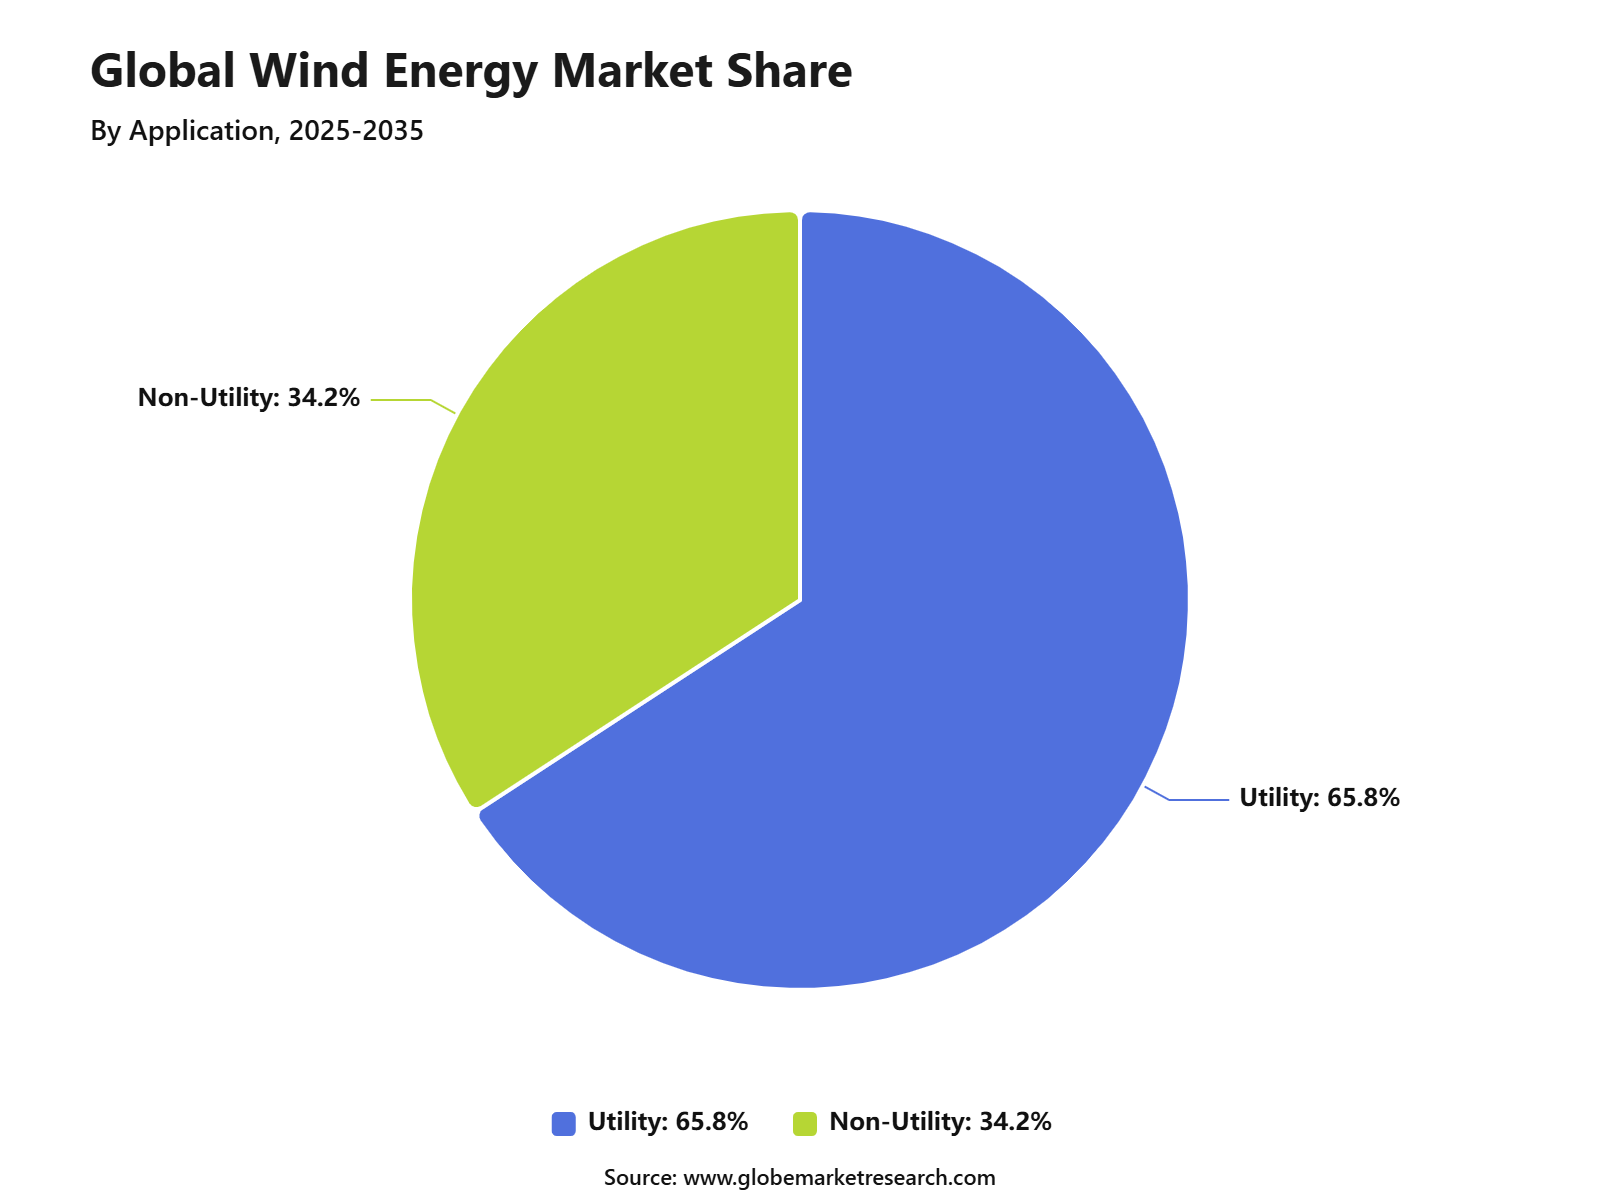 iThe graph shows projected market growth until 2035 based on CAGR analysis. Actual outcomes may vary depending on changing demand, competition, and economic factors.To gain greater insights - request a sample report PDF
By Component
Turbines held 45.9% share of the Wind Energy Market. This leading position is supported by their central role in converting wind energy into electricity and their high cost contribution within overall wind power projects.
Wind turbines include blades, nacelles, towers, gearboxes, generators, control systems, and other key mechanical and electrical parts. Continuous improvement in blade length, generator efficiency, and turbine monitoring systems is helping increase energy output and reduce lifecycle costs.
Demand for turbines is expected to remain strong as new wind projects are commissioned and older turbines are upgraded or replaced. The segment will benefit from larger capacity models, digital condition monitoring, and demand for more efficient power generation systems.
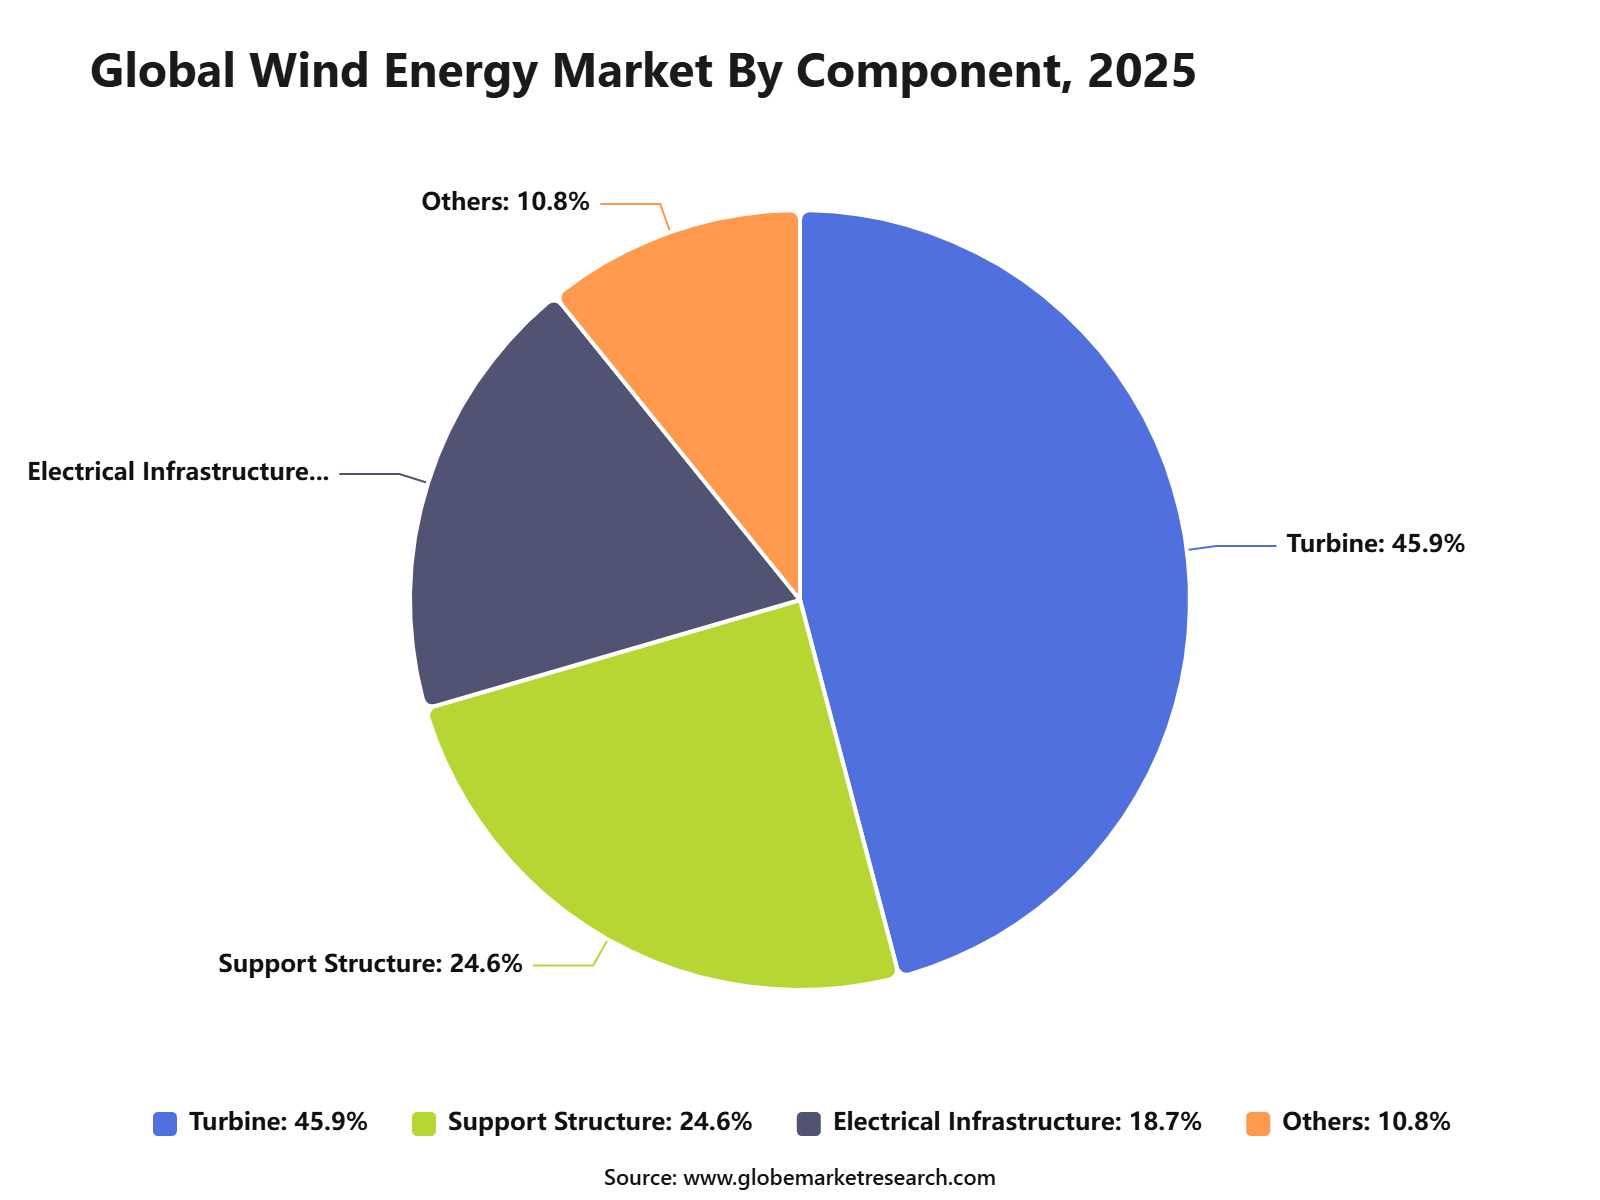 iThe graph shows projected market growth until 2035 based on CAGR analysis. Actual outcomes may vary depending on changing demand, competition, and economic factors.To gain greater insights - request a sample report PDF
By Region
Asia Pacific accounted for 44.3% share of the Wind Energy Market, reaching USD 48.7 billion. The region’s leadership is supported by strong renewable energy targets, rising electricity demand, and large-scale wind power development across major economies.
China, India, Japan, South Korea, Australia, and Southeast Asian countries are key contributors to regional demand. The region benefits from large onshore wind potential, expanding offshore wind activity, domestic turbine manufacturing, and strong policy support for clean power expansion.
Asia Pacific is expected to maintain its leading position as energy demand, industrial growth, and renewable power investment continue to increase. Demand will remain supported by utility-scale wind projects, grid expansion, turbine localization, and the need for reliable low-carbon electricity.
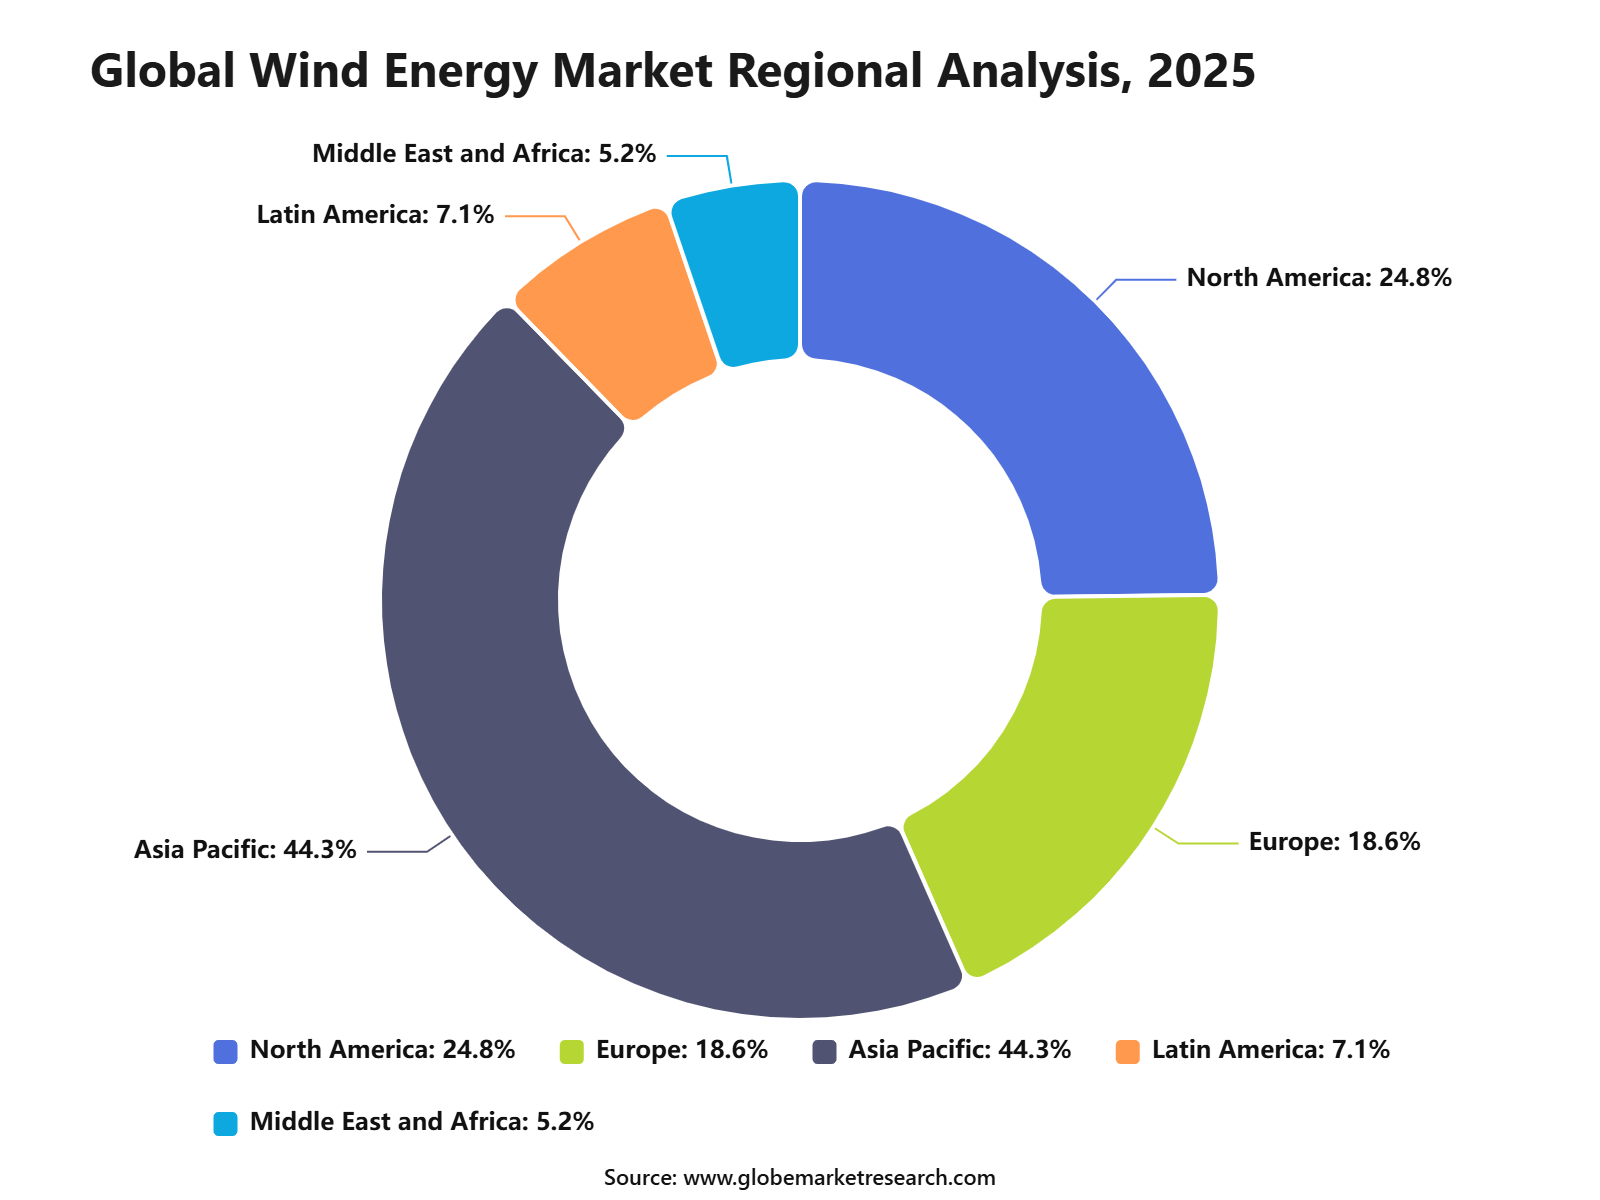 iThe graph shows projected market growth until 2035 based on CAGR analysis. Actual outcomes may vary depending on changing demand, competition, and economic factors.To gain greater insights - request a sample report PDF
Regional Impact Analysis
Asia Pacific leads the Wind Energy Market with 44.3% share in 2025, valued at around USD 48.8 billion, supported by strong wind capacity additions, large electricity demand, turbine manufacturing strength, and government-backed renewable energy goals. China and India remain major regional contributors due to large-scale wind deployment and expanding power infrastructure.
Europe remains important because of offshore wind leadership, repowering projects, and renewable energy mandates. North America supports value growth through utility-scale wind farms, corporate renewable power procurement, transmission investment, and clean energy policy support.
Impact Factor | Estimated CAGR Impact | Regional Relevance | Market Impact |
|---|---|---|---|
Asia Pacific market leadership | +3.6% | Asia Pacific, 44.3% share in 2025 | Leads global value demand. |
China wind capacity expansion | +2.5% | China | Drives regional project scale. |
India onshore wind growth | +2.0% | India | Supports future deployment. |
Europe offshore wind leadership | +1.6% | UK, Germany, Denmark, Netherlands | Adds premium offshore value. |
North America utility-scale wind demand | +1.3% | U.S. and Canada | Supports long-term project pipeline. |
Go-To-Market and Sales Economics
Wind energy companies should prioritise utilities, independent power producers, corporate electricity buyers, and public procurement agencies. Global wind installations reached a record 165 GW in 2025, increasing 40% from the previous record year. A stronger sales pipeline can be developed through early-stage site studies, grid assessments, turbine supply agreements, and long-term power purchase contracts.
Market entry should combine direct project sales with local engineering, construction, transport, and maintenance partners. In 2025, 28,395 wind turbines were installed across 57 countries, while 14 countries commissioned more than 1 GW each. Regional delivery networks can improve permitting support, local-content compliance, installation speed, spare-parts availability, and customer confidence during project execution.
Lifecycle services should be positioned as a core revenue stream rather than an optional contract addition. Nordex booked 4.9 GW of turbine orders during the first half of 2026, including 496 turbines ordered in the second quarter. Bundling monitoring, blade inspection, component replacement, performance upgrades, and availability guarantees can strengthen recurring revenue and customer retention.
Risk Factors & Market Barriers
Grid access remains one of the largest barriers to new wind projects. More than 2,500 GW of renewable, storage, and large-load projects are currently stalled in connection queues worldwide. Developers should secure interconnection studies early, assess curtailment exposure, and coordinate transmission upgrades before final investment decisions, turbine procurement, or fixed construction schedules are approved.
Financing conditions can materially change project economics across countries. IRENA found that national macroeconomic conditions explain about 2.3 times more variation in financing costs than technology factors. Higher interest rates, currency exposure, and uncertain policy support can weaken auction bids, requiring indexed contracts, stronger guarantees, phased investment, and conservative assumptions for debt pricing.
Offshore wind faces higher capital and execution exposure than onshore projects. In 2025, average installed costs were approximately USD 2,931 per kW for offshore wind, compared with USD 976 per kW for onshore wind. Vessel availability, seabed conditions, cable failures, weather delays, and fixed-price contracts can therefore create substantial schedule and margin pressure.
Revenue Potential Analysis
Revenue Landscape Across
Onshore wind provides the broadest revenue opportunity because it offers shorter construction cycles and wider geographic deployment. IRENA reported 159 GW of wind capacity additions in 2025, representing 14% annual growth. Revenue can be generated across turbine supply, civil works, electrical systems, substations, grid connections, commissioning, repowering, and long-term operations and maintenance agreements.
Asia remains central to manufacturing and project deployment. China accounted for approximately three-quarters of new global wind capacity in 2025 and achieved an average onshore wind generation cost of USD 27 per MWh. Suppliers can pursue revenue through local component production, high-capacity turbines, transmission-linked projects, industrial power contracts, and partnerships with domestic developers.
Offshore wind creates high-value opportunities across turbines, foundations, cables, substations, vessels, ports, engineering, and maintenance. The global average offshore wind capacity factor reached 41% in 2025, while generation costs averaged USD 78 per MWh. Revenue potential is strongest where governments provide stable auctions, coordinated transmission, port investment, and predictable permitting schedules.
Financial Impact
Onshore wind remains financially competitive for new electricity supply. Its global average generation cost fell to USD 33 per MWh in 2025, and more than 90% of newly commissioned utility-scale renewable projects were cheaper than the lowest-cost fossil-fuel alternative. Competitive generation costs can support power purchase agreements, refinancing, repowering, and stronger project cash flows.
Improved project execution is supporting manufacturer profitability. Nordex reported first-quarter 2026 sales of EUR 1.6 billion and EBITDA of EUR 130.7 million, producing an 8.2% margin. Its service segment generated EUR 217.9 million in sales and a 19.2% EBIT margin, showing the financial value of recurring maintenance and performance-based contracts.
Large backlogs provide revenue visibility but also create working-capital requirements. Vestas generated EUR 3.97 billion of revenue in the first quarter of 2026, up 14.4%, with EUR 127 million of operating profit before special items. However, adjusted free cash flow was negative EUR 533 million, highlighting the importance of milestone payments, inventory discipline, and supplier management.
Drivers Impact Analysis
The Wind Energy Market is driven by rising clean power demand, utility-scale renewable projects, offshore wind expansion, supportive energy policies, and the need to reduce dependence on fossil fuel-based electricity. Wind power is becoming a major part of national energy planning because it supports large-scale, low-carbon electricity generation.
Asia Pacific leads the market due to strong wind capacity additions, large electricity demand, domestic turbine manufacturing, and government-backed renewable energy targets. China, India, Australia, Japan, South Korea, and Southeast Asian markets remain key contributors through onshore wind farms, offshore wind projects, and grid-linked renewable power development.
Impact Factor | Estimated CAGR Impact | Regional Relevance | Market Impact |
|---|---|---|---|
Rising renewable electricity demand | +3.3% | Asia Pacific, Europe, North America | Drives new wind project development. |
Utility-scale wind farm expansion | +2.8% | China, India, Australia, U.S. | Supports large project pipelines. |
Offshore wind development | +2.4% | China, Japan, South Korea, Europe | Adds high-value capacity growth. |
Government clean energy targets | +2.0% | Asia Pacific and Europe | Improves investment confidence. |
Falling wind power generation cost | +1.6% | Global power markets | Improves project economics. |
Restraints Impact Analysis
The market faces restraints from grid connection delays, land availability issues, high offshore project cost, permitting challenges, and supply chain pressure for turbines, blades, towers, and subsea equipment. Wind projects require strong site planning, transmission access, environmental approvals, and long-term power purchase agreements.
Another restraint is intermittency. Wind power output depends on weather conditions, so utilities need stronger grids, storage systems, forecasting tools, and flexible generation to manage variable electricity supply.
Impact Factor | Estimated CAGR Impact | Regional Relevance | Market Impact |
|---|---|---|---|
Grid connection and transmission delays | -1.6% | Asia Pacific, Europe, North America | Slows project commissioning. |
Land and permitting constraints | -1.3% | Onshore wind markets | Delays development timelines. |
High offshore wind capital cost | -1.1% | Offshore project regions | Limits faster scale-up. |
Turbine supply chain pressure | -0.9% | Global wind equipment markets | Affects project delivery. |
Variable wind generation output | -0.8% | Grid operators and utilities | Requires balancing support. |
Opportunities Impact Analysis
Opportunities are strong in onshore wind farms, offshore wind, floating wind, hybrid wind-solar projects, battery-integrated wind farms, repowering of aging turbines, and wind power for industrial users. These areas benefit from rising electricity demand and cleaner power procurement.
Higher-value opportunities are emerging in offshore wind ports, turbine blades, nacelles, towers, foundations, subsea cables, digital monitoring, and predictive maintenance. Companies that improve turbine efficiency, project execution, and grid integration can capture stronger long-term demand.
Impact Factor | Estimated CAGR Impact | Regional Relevance | Market Impact |
|---|---|---|---|
Offshore wind project pipeline | +3.1% | China, Japan, South Korea, Europe | Builds premium growth opportunity. |
Onshore wind farm development | +2.6% | India, China, Australia, U.S. | Supports large-scale deployment. |
Repowering of old wind assets | +2.1% | Europe, North America, China | Improves output from existing sites. |
Wind-plus-storage projects | +1.7% | Renewable-heavy power markets | Adds grid reliability value. |
Floating wind technology | +1.4% | Japan, South Korea, Europe, U.S. | Expands offshore site access. |
Challenges Impact Analysis
The main challenge is delivering wind projects on time while managing equipment cost, grid availability, local approvals, and construction risk. Large wind projects involve complex logistics, heavy components, specialized vessels, skilled labor, and strong coordination across suppliers.
Another challenge is maintaining long-term turbine performance. Blades, gearboxes, generators, towers, control systems, and offshore foundations require regular inspection and maintenance to protect energy output and project returns.
Impact Factor | Estimated CAGR Impact | Regional Relevance | Market Impact |
|---|---|---|---|
Project execution and logistics risk | -1.5% | Large onshore and offshore projects | Affects delivery schedules. |
Turbine maintenance complexity | -1.2% | Wind farm operators | Impacts lifecycle cost. |
Offshore installation challenges | -1.0% | Coastal and deepwater markets | Raises project difficulty. |
Local community and land-use concerns | -0.8% | Onshore wind regions | Slows approvals. |
Weather-related construction delays | -0.7% | Offshore and remote locations | Affects project timelines. |
Segment Covered in the Report
By Location
Onshore
Offshore
By Application
Utility
Non-Utility
By Component
Turbine
Support Structure
Electrical Infrastructure
Others
By Region
North America
Europe
Asia Pacific
Latin America
Middle East and Africa
Market Trend Analysis
The market trend is moving toward larger wind turbines, offshore wind farms, floating wind platforms, hybrid renewable projects, repowering, digital monitoring, and predictive maintenance. Developers are focusing on higher capacity factors, stronger grid integration, and lower lifecycle costs.
Asia Pacific remains the largest value region because of strong wind power deployment, domestic turbine supply chains, and rising electricity demand. Europe continues to lead in offshore wind maturity, while North America supports growth through clean energy procurement and utility-scale wind investments.
Impact Factor | Estimated CAGR Impact | Regional Relevance | Market Impact |
|---|---|---|---|
Larger turbine capacity adoption | +2.9% | Asia Pacific, Europe, North America | Improves project output. |
Offshore wind becomes mainstream | +2.5% | China, Europe, Japan, South Korea | Adds high-value installations. |
Hybrid wind and storage systems grow | +2.0% | Renewable-heavy grids | Supports stable power supply. |
Digital wind farm monitoring expands | +1.6% | Utility-scale wind operators | Improves asset performance. |
Repowering trend strengthens | +1.3% | Mature wind markets | Extends asset productivity. |
Investor Type Impact Matrix
Investors should focus on wind developers with strong project pipelines, grid access, power purchase agreements, turbine partnerships, and proven construction capability. Project location, wind resource quality, permitting strength, and lifecycle maintenance planning are key success factors.
Strategic investors can also target offshore wind developers, turbine component suppliers, blade manufacturers, operations and maintenance providers, floating wind technology firms, and storage integration companies. Companies that combine scale, reliable execution, and lower lifecycle cost are better positioned for long-term growth.
Investor Type | Estimated CAGR Impact | Regional Relevance | Market Impact |
|---|---|---|---|
Wind Farm Developers | +2.5% | Global | Expands clean power generation. |
Offshore Wind Project Companies | +2.1% | Asia Pacific, Europe, North America | Builds high-value project growth. |
Turbine and Blade Manufacturers | +1.8% | China, India, Europe, U.S. | Supports equipment supply. |
Wind O&M Service Providers | +1.4% | Mature and growing wind markets | Adds recurring service revenue. |
Strategic Renewable Energy Investors | +1.2% | Global clean energy markets | Funds project scale and technology growth. |
Recent Developments
In June 2026, GE Vernova launched its 3.8 MW onshore turbine in India and secured a 100 MW Powerica order, supported by expanded local manufacturing capacity at its Pune facility.
In June 2026, Suzlon secured a new 400 MW EPC order from Tata Power Renewable Energy, taking the partnership beyond 1 GW and expanding Suzlon’s turbine supply and project-execution portfolio.
In April 2026, Shanghai Electric reported that 2025 wind-power equipment orders reached RMB 22.966 billion, increasing 32.18%, as the company expanded turbine manufacturing, project delivery and global power-generation equipment activities.
Competitive Landscape
The market is characterized by intense competition among established players and emerging companies. Strategic partnerships, mergers and acquisitions, and product innovation are key strategies employed by market participants.
Key Market Players
Vestas Wind Systems
Siemens Gamesa Renewable Energy
GE Vernova
Goldwind
Nordex SE
Suzlon Energy
Ming Yang Smart Energy Group
ENERCON GmbH
Dongfang Electric Corporation
Envision Energy
Sinovel Wind Group
Senvion
Shanghai Electric Power Generation Group
Other Key Players
Research Methodology
This market study is prepared using a combination of primary and secondary research. Primary research includes discussions with manufacturers, suppliers, distributors, consultants, industry experts, and end users. Secondary research covers company reports, government databases, trade associations, technical publications, regulatory sources, and trusted industry documents. The collected information is used to assess market demand, pricing trends, technology adoption, competitive activity, and regional performance.
AI language models are not used as primary data sources, and publicly available AI-generated content is not treated as market evidence. Computational tools may be used to support data processing, translation, data classification, and pattern identification. However, every published assessment is supported by verified sources, human review, and primary market discussions.
Market estimates are developed through top-down and bottom-up approaches and validated using data triangulation. Revenue, production, shipment, pricing, and application-level data are compared across multiple sources. Forecasts consider economic conditions, regulatory changes, investment activity, innovation, supply chain developments, and industry risks. All findings are reviewed through source verification and internal quality checks before publication.
Part I
Source Management & Input Data Standards
Who provides data, how sources are qualified, and what types of evidence are admissible.
Part II
Research Scope & Market Coverage
How we define the markets we assess and the parameters that govern each product.
Part III
Data Collection, Verification & Submission
The mechanics of gathering, cross-checking, and hierarchically ranking evidence.
Part IV
Assessment Determination & Quality Controls
How raw data becomes a published assessment — normalisation, expert judgement, and outlier exclusion.
Part V
Publication, Corrections & Revision
Our publication schedule, corrections policy, and methodology review cycle.
Part VI
Independence, Ethics & Complaints
Conflict-of-interest policies, editorial independence, and how clients raise concerns.
Google · Preferred Sources
Don't miss the latest market research insights and industry updates on Google.
Add Globe Market Research as a preferred source in the Google app to see our reports, analysis, and market stories in your news suggestions.
Meet the Team
This report was prepared by our expert analysts with deep industry knowledge and research experience.
Pratiksha K. is a Senior Research Analyst with more than five years of experience in market research, industry analysis, competitive intelligence, and business strategy. She has contributed to detailed market reports, customized research studies, company profiling, market sizing, trend analysis, and strategic consulting projects for clients across different regions. Her industry expertise covers Chemical and Material, Consumer Goods, Food & Beverages and Energy & Power. She closely evaluates changing customer requirements, technology developments, regulatory conditions, supply chain structures, investment activity, and competitive strategies to provide clear and practical market insights.
Sayali brings more than 7 years of experience to Globe Market Research, supporting the accuracy, clarity, and relevance of research content across multiple industries. She reviews market data, segment analysis, competitive insights, and industry trends to ensure each report meets strong quality standards and provides practical value to business decision-makers. Her expertise spans healthcare, information technology, consumer goods, and diverse cross-industry domains. With a strong focus on data reliability, structured analysis, and clear presentation, Sayali helps ensure that each research output delivers well-reviewed insights for clients, investors, consultants, and industry stakeholders.
Frequently Asked Questions
Related Reports
More in Energy and Power
Oil and Gas Turbomachinery Market to Hit USD 26.9 Billion by 2035
Oil and Gas Turbomachinery Market Size, Share, Analysis By Type (Gas Compressors, Gas and Steam Turbines, Pumps, Other Types), By Deployment (Onshore, Offshore), By Industry (Upstream, Midstream, Downstream), By Regional Insights, Business plan and Project Report, Investment Opportunities, Profitability, Industry Trends, Leading Companies and Growth Forecasts by 2025-2035
Liquefied Natural Gas (LNG) Bunkering Market to Hit USD 51.7 Billion by 2035
Liquefied Natural Gas (LNG) Bunkering Market Size, Share, Analysis By Product Type (Ship-to-Ship, Truck-to-Ship, Port-to-Ship, Portable Tanks), By Application (Cargo Fleet, Tanker Fleet, Container Fleet, Ferries, Inland Vessels, Others), By Regional Insights, Business plan and Project Report, Investment Opportunities, Profitability, Industry Trends, Leading Companies and Growth Forecasts by 2025-2035
Power EPC Market to Hit USD 1,516.1 Billion by 2035
Power EPC Market Size, Share, Analysis By Type of Power Generation (Thermal Power, Renewable Energy, Nuclear Power, Hydropower, Others), By Service Type (Engineering, Procurement, Construction), By Equipment Type (Steam Turbines, Gas Turbines, Solar PV Systems, Wind Turbines, Boilers, Generators, Others), By Regional Insights, Business plan and Project Report, Investment Opportunities, Profitability, Industry Trends, Leading Companies and Growth Forecasts by 2025-2035
Sodium Nickel Chloride Battery Market to Hit USD 8.3 Billion by 2035
Sodium nickel chloride battery market Size, Share, Analysis By Product Type (Stationary Sodium Nickel Chloride Batteries, Mobile Sodium Nickel Chloride Batteries, Industrial Sodium Nickel Chloride Batteries, Backup Power Battery Systems), By Application (Renewable Energy Storage, Telecom Backup, Industrial UPS, Grid Stabilization, Electric Mobility), By Regional Insights, Business plan and Project Report, Investment Opportunities, Profitability, Industry Trends, Leading Companies and Growth Forecasts by 2025-2035