

Revenue, 2025
USD 735.6 Bn
Forecast, 2035
USD 1,516.1 Bn
CAGR, 2025-2035
7.5%
Report Coverage
Global
Market Size and Forecast
The Global Power EPC Market was worth USD 735.6 billion in 2025 and is expected to reach USD 1,516.1 billion by 2035, growing at a CAGR of 7.5% from 2025 to 2035. Based on this growth rate, the market is estimated to reach around USD 813.6 billion in 2026. Asia Pacific held the largest regional share of 39.2% in 2025, valued at around USD 288.3 billion, supported by large power plant construction, renewable energy expansion, grid infrastructure upgrades, and rising electricity demand.
The Power EPC Market includes engineering, procurement, and construction services used for developing power generation and transmission projects. It covers thermal power plants, solar farms, wind projects, hydropower facilities, substations, transmission lines, battery storage projects, and hybrid energy systems. The market is closely linked with energy infrastructure development, project execution, utility investment, and national electrification programs.
Key Parameter | Report Details |
|---|---|
Market Revenue, 2025 | USD 735.6 Billion |
Projected Revenue, 2035 | USD 1,516.1 Billion |
CAGR (2025-2035) | 7.5% |
Largest Region | Asia Pacific (39.2%, USD 288.3 Bn) |
Market Concentration | Medium |
Base Year | 2024 |
Forecast Period | 2025-2035 |
The market outlook remains strong as governments and utilities continue investing in reliable, scalable, and cleaner power infrastructure. Growth can be attributed to rising renewable energy capacity, modernization of aging power assets, and increasing demand for turnkey project delivery. The expansion of Asia Pacific industrial power demand, urban infrastructure, and large-scale clean energy projects is expected to support long-term market growth.
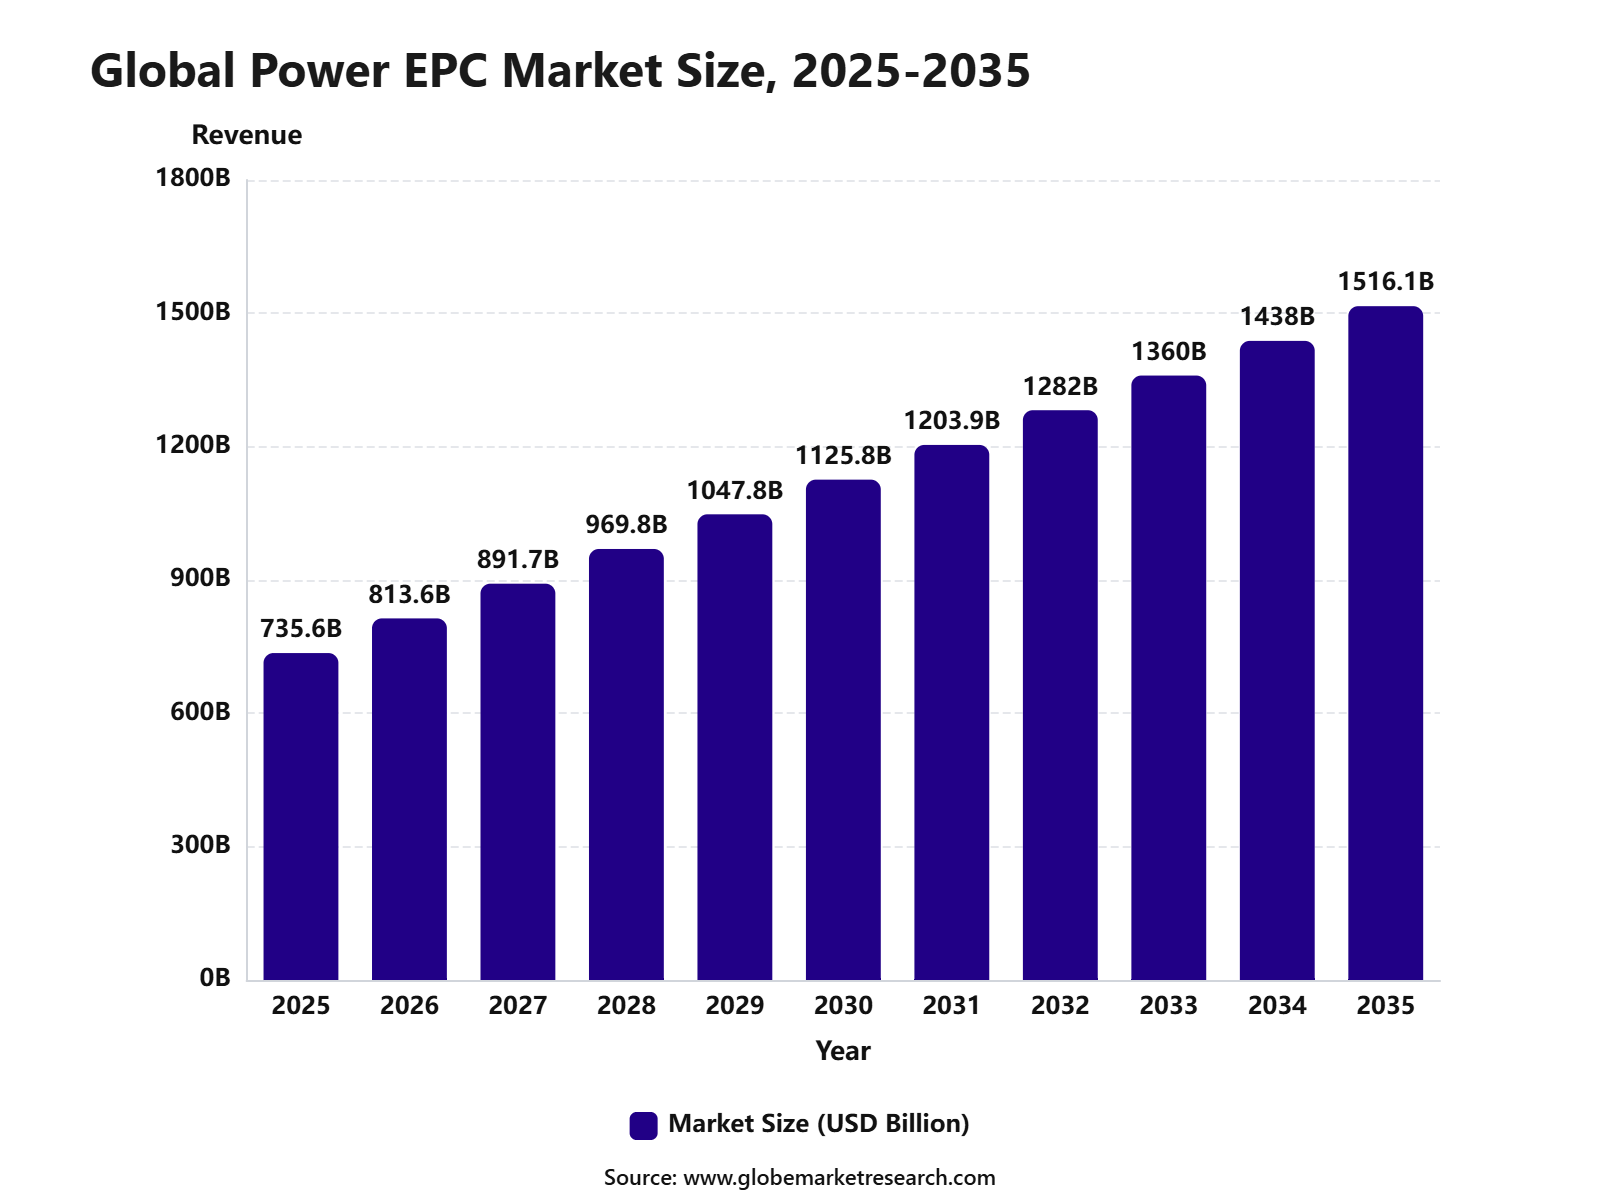 iThe graph shows projected market growth until 2035 based on CAGR analysis. Actual outcomes may vary depending on changing demand, competition, and economic factors.To gain greater insights - request a sample report PDF
Key Market Insights
Thermal power led the type of power generation segment with 43.5% share, supported by its large installed base, ongoing plant upgrades, and continued need for reliable baseload power infrastructure.
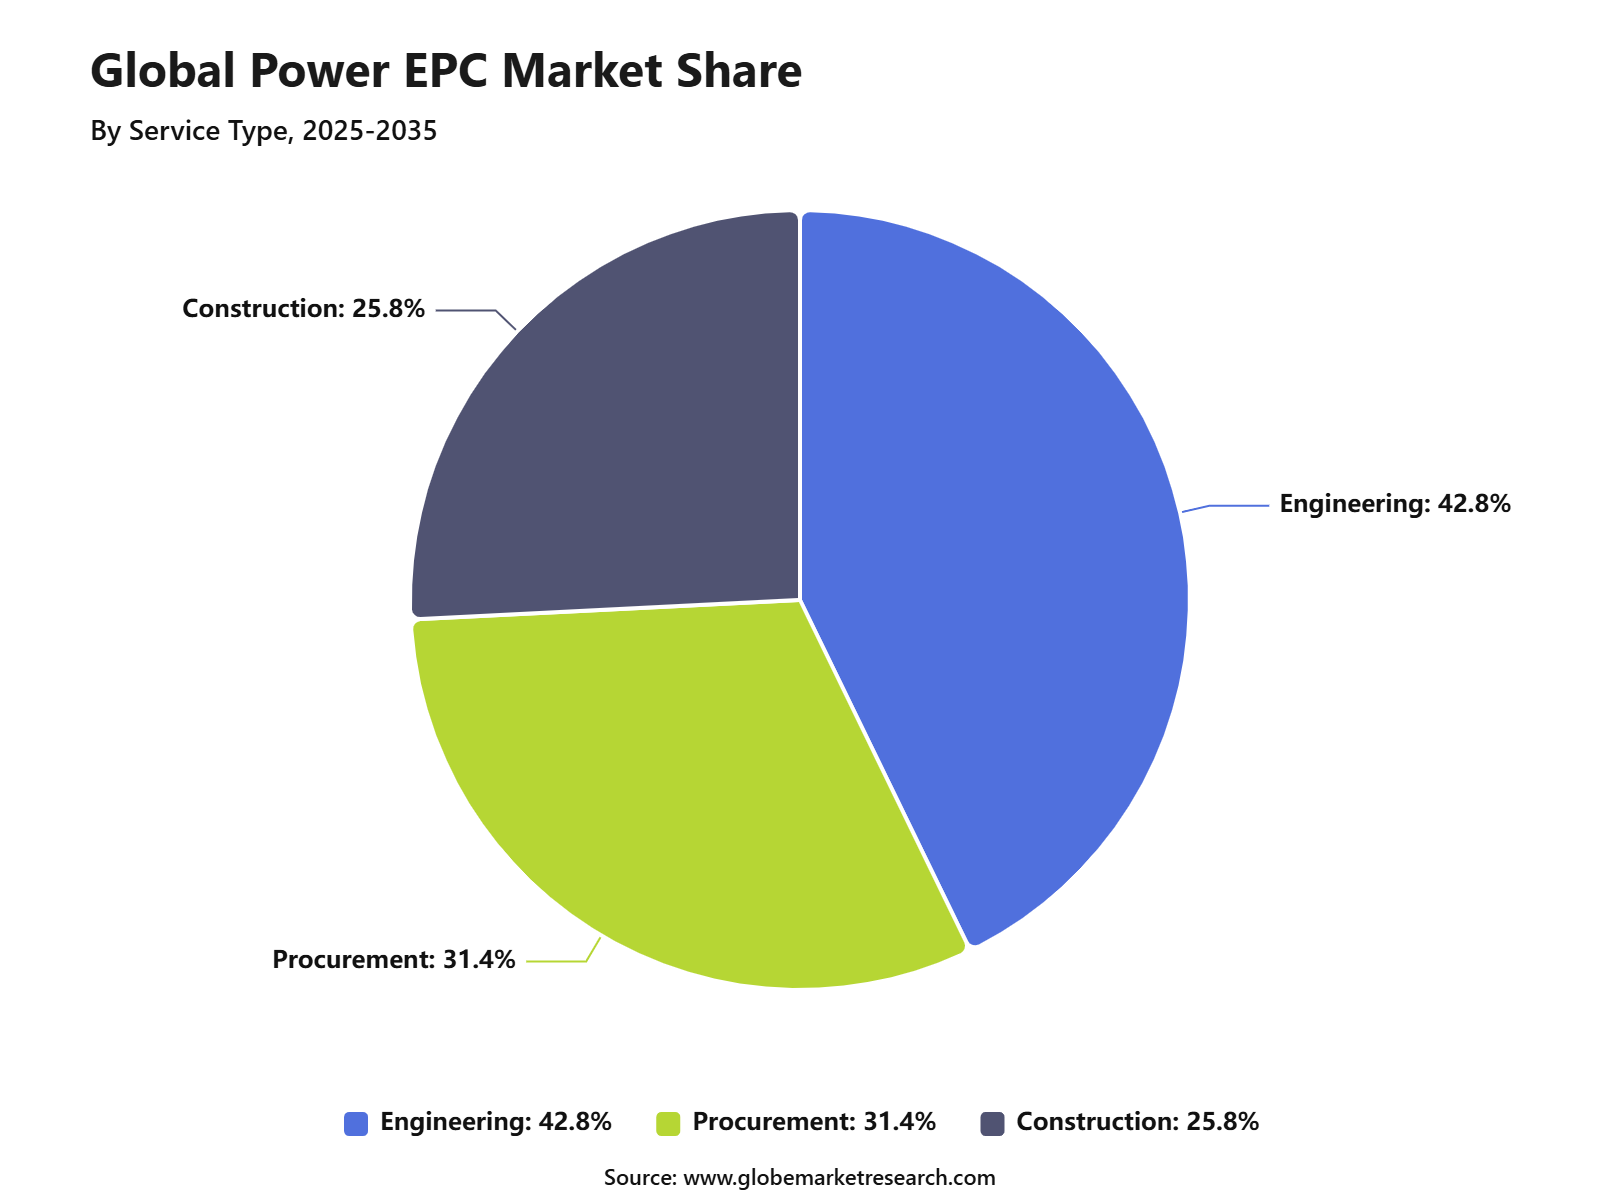
Engineering services accounted for 42.8% share, driven by strong demand for project design, feasibility planning, system integration, technical consulting, and power plant optimization.
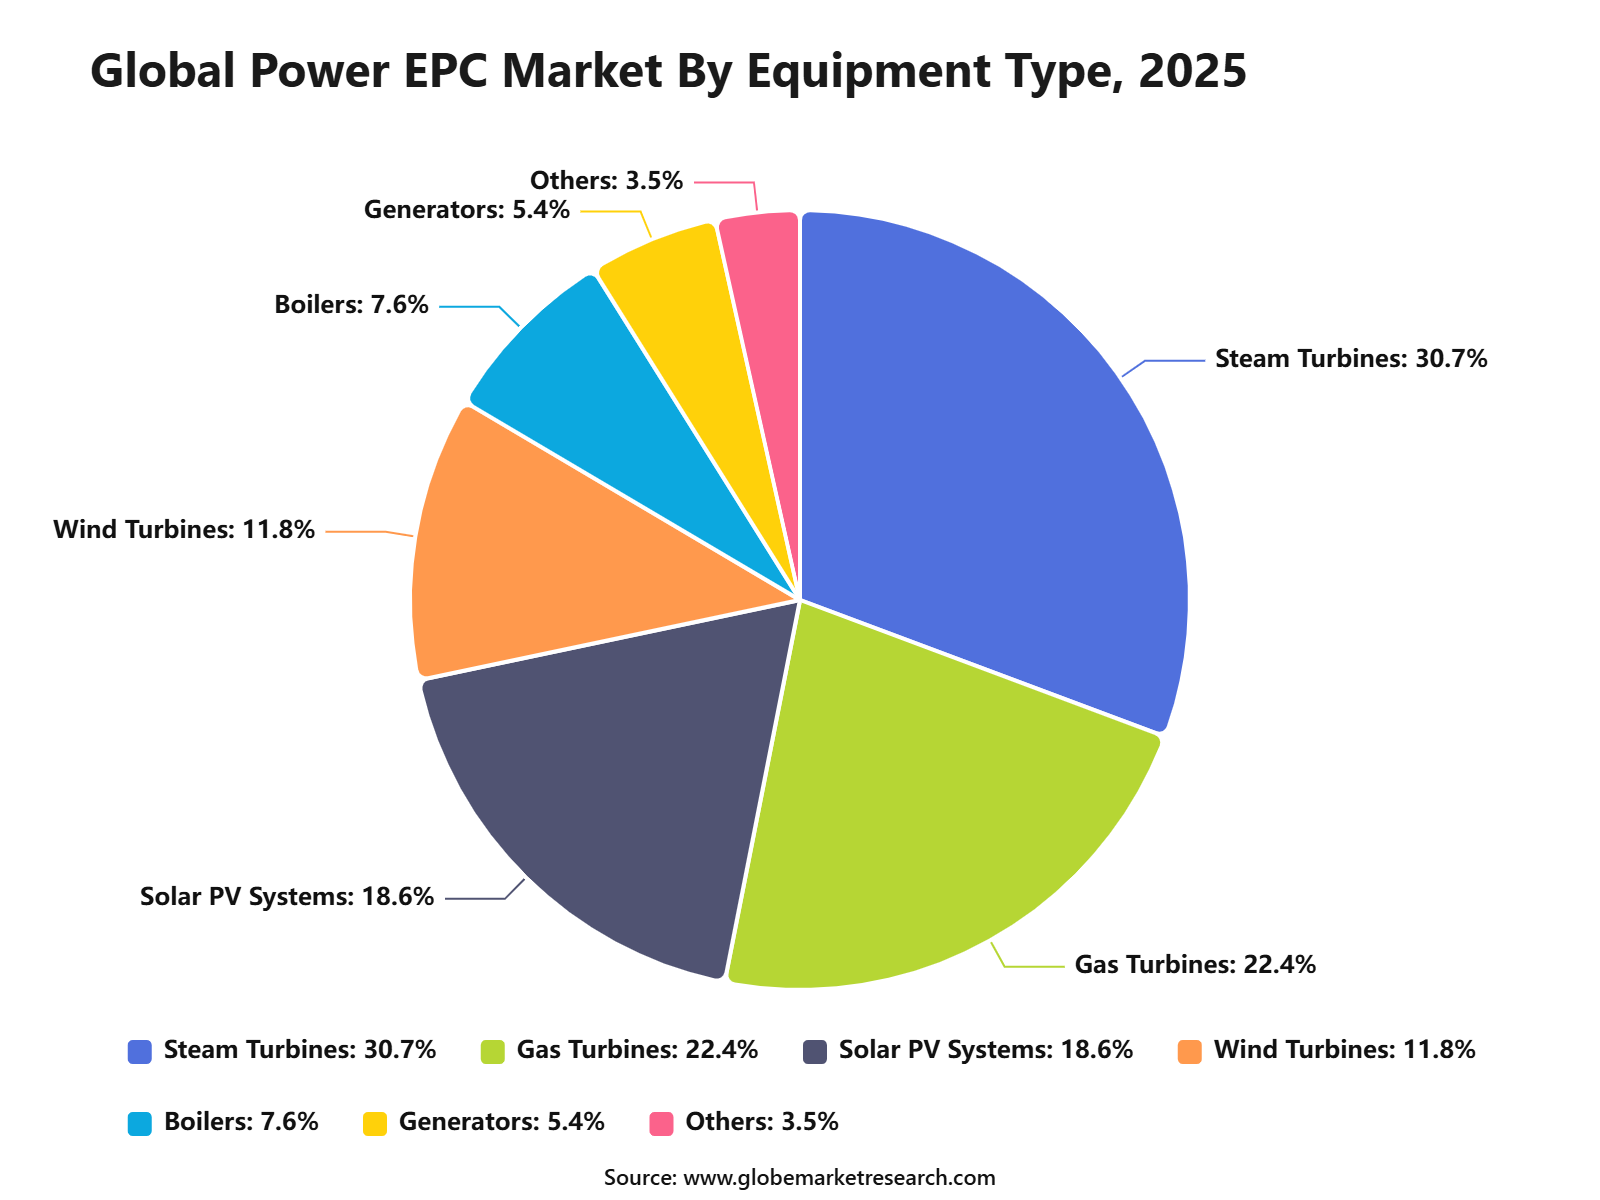
Steam turbines held 30.7% share by equipment type, supported by their wide use in thermal power plants, industrial power systems, and large-scale electricity generation projects.
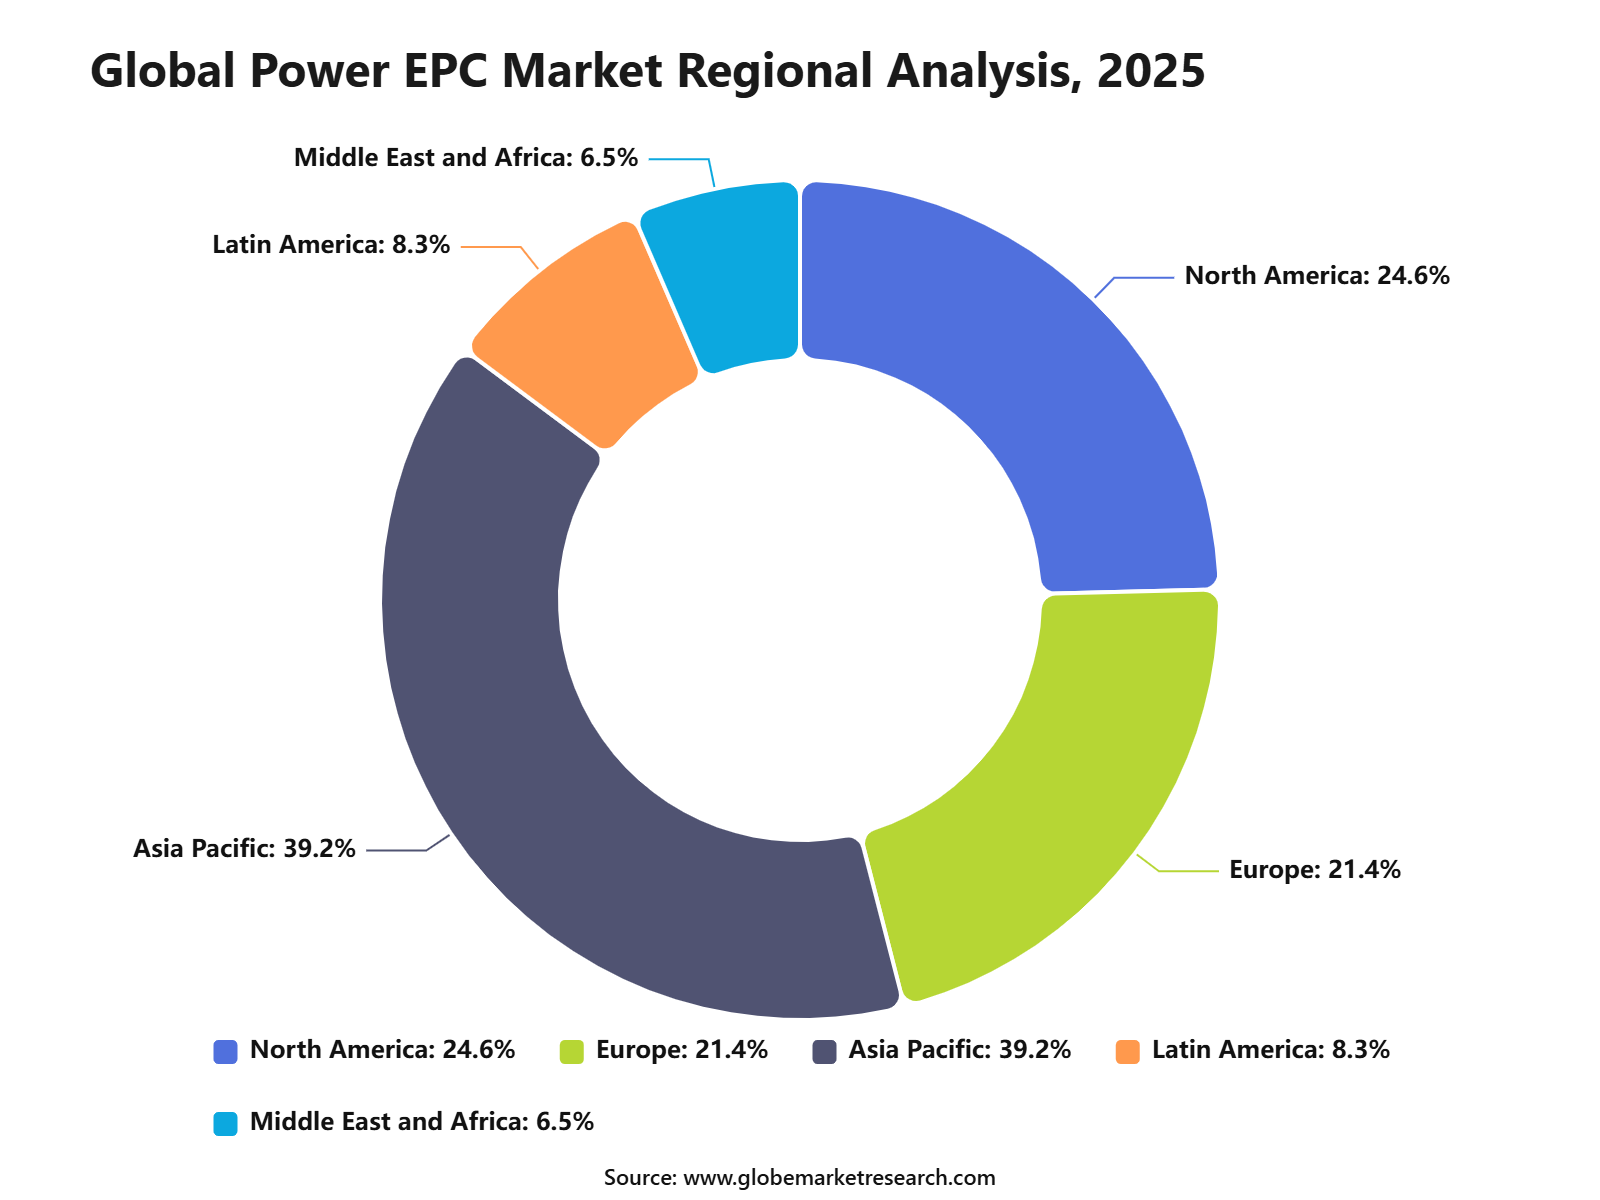
Asia Pacific led the Power EPC market with 39.2% share, valued at USD 288.3 billion, supported by rising electricity demand, rapid industrialization, expanding power infrastructure, and major energy investments across China, India, Japan, and Southeast Asia.
Top Funding and Investment
Top Investments
Duke Energy announced a regulated capital investment program of approximately USD 103 billion over five years. The expenditure will support new generation capacity, transmission infrastructure, distribution-system upgrades, grid resilience, and connections required to serve increasing electricity demand. Duke Energy operates approximately 55,700 MW of generating capacity and supplies electricity to around 8.7 million customers, creating a substantial pipeline of engineering, procurement, construction, and commissioning work.
Southern Company confirmed plans to invest more than USD 80 billion over five years across its electricity and natural gas systems. The capital will be directed toward generation development, grid strengthening, transmission and distribution improvements, system resilience, and the deployment of advanced operating technologies. The program is expected to support large EPC packages involving power plants, substations, transmission lines, distribution networks, and associated control infrastructure.
American Electric Power increased its five-year capital investment plan from USD 72 billion to USD 78 billion. The expansion is being driven by additional transmission projects within the PJM and Southwest Power Pool regions, together with planned natural gas generation capacity in Indiana. The program is expected to support nearly 11% annual rate-base growth and more than 9% annual operating earnings growth through 2030.
NextEra Energy planned to invest approximately USD 75 billion through 2028, primarily in electricity generation, battery storage, transmission infrastructure, and renewable energy development. At the time of the announcement, NextEra Energy Resources operated approximately 39 GW of generating capacity and maintained a development backlog of around 30 GW. Its competitive transmission operations also had approximately USD 6 billion in secured rate-base investments, supporting continued demand for EPC contractors and equipment suppliers.
PG&E outlined a five-year capital investment plan of approximately USD 63 billion through 2028. The program covers electric-system safety, grid modernization, wildfire-risk reduction, underground power lines, stronger overhead networks, and infrastructure required to connect new electricity demand. PG&E’s wildfire mitigation program includes plans to underground approximately 1,100 miles of distribution lines and strengthen around 570 miles of overhead lines, creating significant construction and engineering requirements.
Top Funding Transactions
Vikran Engineering completed an initial public offering valued at approximately INR 772 crore. The transaction included a fresh issue of around INR 721 crore and an offer for sale of approximately INR 51 crore. Fresh capital was raised mainly to support working-capital requirements and the execution of EPC contracts across power transmission, substations, solar projects, railway electrification, and water infrastructure.
Sterling and Wilson Renewable Energy received and drew down an INR 475 crore term loan from the Indian Renewable Energy Development Agency during the second quarter of fiscal year 2026. The financing was used to improve vendor payments and support the execution of renewable power EPC projects. Following the borrowing, the company reported gross debt of approximately INR 1,194 crore, cash and bank balances of INR 452 crore, and net debt of around INR 742 crore.
Om Power Transmission launched an initial public offering valued at approximately INR 150.06 crore. The offering consisted of a fresh issue of approximately INR 132.56 crore and an offer for sale of INR 17.50 crore. Around INR 55 crore of the net proceeds was allocated to long-term working-capital requirements, while additional funds were designated for debt repayment and corporate purposes.
Top Acquisitions
Sterling Infrastructure completed the acquisition of substantially all assets of CEC Facilities Group, an electrical and mechanical engineering and construction contractor. The signed transaction included approximately USD 505 million in upfront consideration, comprising USD 450 million in cash and USD 55 million in Sterling shares, together with a performance-based earn-out.
CEC provides electrical design, engineering, prefabrication, installation, construction, and maintenance services for data centres, semiconductor plants, manufacturing facilities, and other mission-critical infrastructure. Electrical services represented more than 80% of CEC’s 2024 revenue, while mission-critical sectors accounted for more than 80% of its revenue and backlog.
Megha Engineering and Infrastructures, through MEIL Energy, acquired 100% ownership of TAQA Neyveli Power Company from Abu Dhabi National Energy Company. The transaction was completed for approximately INR 9.26 billion, equivalent to about AED 385 million.
The acquired business owns and operates a 250 MW lignite-fired power plant in Neyveli, Tamil Nadu, supported by a long-term electricity offtake arrangement. The acquisition expanded MEIL’s power portfolio to more than 5.2 GW and strengthened its presence across power development, engineering, construction, operation, and maintenance.
By Type of Power Generation
Thermal power accounted for 43.5% share of the Power EPC Market. This leading position is supported by the continued use of coal, gas, and oil-based power plants to meet baseload electricity demand, grid stability needs, and industrial power requirements.
Thermal power EPC projects involve the design, engineering, procurement, construction, installation, and commissioning of power plants and related systems. These projects require boilers, turbines, generators, cooling systems, emission control units, fuel handling systems, and balance-of-plant infrastructure.
Demand from thermal power is expected to remain steady as many countries continue to upgrade existing plants, improve efficiency, and reduce emissions from conventional generation assets. The segment will also be supported by gas-based power projects used for flexible generation and grid balancing.
By Service Type
Engineering accounted for 42.8% share of the Power EPC Market. This dominance is driven by the high importance of project planning, feasibility studies, plant design, system integration, technical evaluation, and regulatory compliance in power infrastructure development.
Engineering services are critical because power projects require accurate design of electrical systems, mechanical systems, civil structures, fuel systems, grid connections, and environmental control systems. Strong engineering support helps reduce project delays, improve plant performance, and control construction risks.
The segment is expected to maintain a strong position as power projects become more complex and technology-focused. Demand will be supported by renewable integration, thermal plant modernization, transmission upgrades, and the need for reliable project execution across large energy assets.
 iThe graph shows projected market growth until 2035 based on CAGR analysis. Actual outcomes may vary depending on changing demand, competition, and economic factors.To gain greater insights - request a sample report PDF
By Equipment Type
Steam turbines held 30.7% share of the Power EPC Market. This leading share is supported by their wide use in thermal power plants, combined cycle plants, nuclear facilities, biomass plants, and industrial captive power generation.
Steam turbines are important because they convert thermal energy from steam into mechanical energy to generate electricity. They are used in large power projects where high efficiency, durability, and continuous operation are required.
Demand for steam turbines is expected to remain strong due to thermal plant upgrades, combined cycle expansion, and industrial power generation needs. The segment will also benefit from efficiency improvement projects and replacement of aging turbine systems in existing power plants.
 iThe graph shows projected market growth until 2035 based on CAGR analysis. Actual outcomes may vary depending on changing demand, competition, and economic factors.To gain greater insights - request a sample report PDF
By Region
Asia Pacific accounted for 39.2% share of the Power EPC Market, reaching USD 288.3 billion. The region’s leadership is supported by rising electricity demand, rapid industrialization, urban expansion, and continued investment in power generation and grid infrastructure.
China, India, Japan, South Korea, Indonesia, Vietnam, and other Southeast Asian economies are key contributors to regional EPC activity. The region has strong demand for thermal power projects, renewable energy plants, transmission systems, and industrial captive power facilities.
Asia Pacific is expected to maintain its leading position as governments and utilities continue to expand power capacity and improve grid reliability. Demand will remain supported by energy security needs, industrial growth, renewable integration, and modernization of aging power infrastructure.
 iThe graph shows projected market growth until 2035 based on CAGR analysis. Actual outcomes may vary depending on changing demand, competition, and economic factors.To gain greater insights - request a sample report PDF
Regional Impact Analysis
Asia Pacific leads the Power EPC Market with 39.2% share in 2025, valued at around USD 288.4 billion, supported by high electricity demand, renewable energy expansion, industrialization, urban growth, and grid investment. China and India remain the largest regional contributors due to large-scale power generation and transmission project pipelines.
North America remains important because of grid modernization, renewable energy projects, data center power demand, and replacement of aging infrastructure. Europe supports value growth through offshore wind, interconnectors, clean power projects, energy security planning, and transmission upgrades.
Impact Factor | Estimated CAGR Impact | Regional Relevance | Market Impact |
|---|---|---|---|
Asia Pacific market leadership | +2.6% | Asia Pacific, 39.2% share in 2025 | Leads global value demand. |
China power and grid project scale | +1.8% | China | Drives regional project volume. |
India electricity and renewable expansion | +1.5% | India | Supports future EPC growth. |
North America grid modernization | +1.1% | U.S. and Canada | Adds replacement and upgrade demand. |
Europe clean power infrastructure | +1.0% | Germany, UK, France, Spain | Supports renewable and grid EPC. |
Go-To-Market and Sales Economics
Power EPC contractors should target utilities, independent power producers, grid operators, data-centre developers, and energy-intensive manufacturers. Global electricity consumption is forecast to rise from 28,200 TWh in 2025 to 33,600 TWh by 2030, adding about 1,100 TWh annually. Early engagement during feasibility, permitting, and interconnection planning can improve bid conversion and project visibility.
Sales strategies should cover generation, substations, transmission, storage, and digital controls within one coordinated offer. Electricity supply and infrastructure investment is expected to approach USD 1.6 trillion in 2026, including nearly USD 550 billion for grids and more than USD 100 billion for battery storage. Integrated packages can therefore increase contract value and reduce client coordination costs.
Framework agreements, front-end engineering, local construction partnerships, and long-term maintenance services should support the commercial model. Siemens Energy reported second-quarter fiscal 2026 orders of EUR 17.7 billion, a 1.72 book-to-bill ratio, and EUR 154 billion of backlog. These figures indicate strong buyer demand, but also make delivery capacity and supplier access important sales differentiators.
Risk Factors & Market Barriers
Equipment availability is a major execution barrier. Industry procurement can require two to three years for cables, up to four years for large power transformers, and more than five years for specialised direct-current cables. Contractors should secure production slots early, approve alternative vendors, standardise designs, and include escalation clauses before committing to fixed completion dates.
Permitting, land access, interconnection approvals, and regional planning can delay revenue recognition even when demand is strong. The U.S. Department of Energy found that most transmission congestion occurs during only 5% of operating hours, while new capacity must address data centres, manufacturing loads, reliability, and generation connections. Detailed stakeholder planning is therefore required before construction mobilisation.
Cost overruns can quickly weaken EPC margins under fixed-price contracts. Fluor reported USD 2.7 billion of first-quarter 2026 awards, with 98% reimbursable, while narrowing annual adjusted EBITDA guidance after cost growth on one project and a temporary geopolitical slowdown on another. This illustrates why contingency allowances, reimbursable structures, insurance, and disciplined change-order management remain essential.
Revenue Potential Analysis
Revenue Landscape Across
Renewable generation provides a large project pipeline across solar, wind, hydropower, substations, and evacuation infrastructure. Renewable capacity increased by 692 GW in 2025, equal to 85.6% of worldwide power additions, with solar contributing about 510 GW. EPC companies can capture more revenue by combining plant construction with transmission, storage, commissioning, and operating-support services.
Grid expansion and modernisation represent a second major revenue pool. Annual grid investment must rise by about 50% from the current USD 400 billion level by 2030 to meet forecast demand. Opportunities will be created across high-voltage lines, substations, advanced conductors, transformers, protection systems, digital control platforms, and upgrades that increase capacity without entirely new corridors.
Thermal and nuclear generation also remain important for dependable capacity. Nuclear output reached a record in 2025, while almost 30 GW of new nuclear capacity is expected in China during 2026 to 2030. Gas-fired generation is also projected to rise in several regions, supporting EPC demand for plants, fuel systems, cooling infrastructure, emissions controls, and grid connections.
Financial Impact
Large backlogs can provide multi-year revenue visibility when projects are priced and scheduled correctly. GE Vernova reported USD 18.3 billion of first-quarter 2026 orders and a USD 13 billion sequential backlog increase. Its gas-power equipment backlog and slot reservations reached 100 GW, indicating substantial downstream opportunities for civil works, installation, balance-of-plant systems, commissioning, and service support.
Cash generation improves when EPC contractors combine engineering, procurement, construction, testing, and recurring maintenance. Quanta Services reported first-quarter 2026 revenue of USD 7.87 billion, up from USD 6.23 billion a year earlier, with record backlog of USD 48.5 billion. The result shows how recurring utility programmes and specialised workforce capabilities can support scale and earnings visibility.
Financial performance depends on contract mix, procurement timing, labour productivity, and change-control discipline. Fluor ended the first quarter of 2026 with USD 25.7 billion of backlog, of which 82% was reimbursable, and generated USD 110 million of operating cash flow. A higher reimbursable share can reduce cost exposure, although execution quality and payment milestones still determine cash conversion.
Drivers Impact Analysis
The Power EPC Market is driven by rising electricity demand, renewable energy expansion, grid modernization, industrial growth, urbanization, and replacement of aging power infrastructure. EPC companies are essential for engineering, procurement, construction, commissioning, and delivery of power generation and transmission projects.
Asia Pacific leads the market due to large electricity consumption, rapid industrial development, renewable capacity additions, and strong investment in power infrastructure. China, India, Japan, South Korea, Australia, and Southeast Asian countries remain major contributors because of growing demand for reliable and cleaner power systems.
Impact Factor | Estimated CAGR Impact | Regional Relevance | Market Impact |
|---|---|---|---|
Rising electricity demand | +2.3% | Asia Pacific, Middle East, Africa | Drives new project development. |
Renewable energy capacity expansion | +2.0% | China, India, Australia, Europe | Supports solar, wind, and hybrid EPC work. |
Grid modernization and transmission upgrades | +1.7% | Asia Pacific, North America, Europe | Expands EPC scope beyond generation. |
Industrial and urban infrastructure growth | +1.4% | India, Southeast Asia, China | Builds long-term power demand. |
Replacement of aging power assets | +1.1% | Mature power markets | Supports retrofit and modernization projects. |
Restraints Impact Analysis
The market faces restraints from high capital cost, project delays, supply chain volatility, permitting issues, and financing challenges. Power EPC projects are large, complex, and exposed to raw material prices, labor availability, equipment lead times, and regulatory approvals.
Another restraint is contract margin pressure. EPC companies often work under fixed-price or milestone-based contracts, so cost overruns, design changes, and delayed payments can reduce profitability.
Impact Factor | Estimated CAGR Impact | Regional Relevance | Market Impact |
|---|---|---|---|
High project capital requirements | -1.1% | Global power infrastructure markets | Slows project approvals. |
Supply chain and equipment delays | -0.9% | Transmission, solar, thermal projects | Affects delivery timelines. |
Permitting and land acquisition issues | -0.8% | Renewable and transmission projects | Delays construction schedules. |
EPC margin pressure | -0.7% | Competitive project markets | Reduces contractor profitability. |
Financing and interest rate pressure | -0.6% | Emerging power markets | Impacts project bankability. |
Opportunities Impact Analysis
Opportunities are strong in solar EPC, wind EPC, battery storage integration, transmission lines, substations, hybrid renewable projects, gas-fired plants, and grid digitalization. These areas benefit from rising electricity demand and the transition toward cleaner power infrastructure.
Higher-value opportunities are also emerging in green hydrogen power integration, offshore wind EPC, smart substations, microgrids, and power infrastructure for data centers. EPC firms with engineering depth, procurement scale, and project execution discipline can capture stronger long-term demand.
Impact Factor | Estimated CAGR Impact | Regional Relevance | Market Impact |
|---|---|---|---|
Solar and wind EPC projects | +2.2% | Asia Pacific, Europe, North America | Builds clean power opportunity. |
Battery storage and hybrid power projects | +1.8% | China, India, Australia, U.S. | Supports grid flexibility. |
Transmission and substation expansion | +1.5% | Asia Pacific and emerging markets | Enables power delivery. |
Data center power infrastructure | +1.2% | U.S., India, Singapore, Japan | Adds high-value demand. |
Offshore wind and green hydrogen-linked EPC | +1.0% | Europe, Asia Pacific, Middle East | Builds future project pipeline. |
Challenges Impact Analysis
The main challenge is completing large power projects on time and within budget. EPC firms must manage engineering changes, equipment sourcing, contractor coordination, safety requirements, and commissioning risks across complex project sites.
Another challenge is balancing traditional and renewable project portfolios. While thermal power remains important in some regions, EPC companies must expand capabilities in renewables, storage, grid automation, and low-carbon infrastructure.
Impact Factor | Estimated CAGR Impact | Regional Relevance | Market Impact |
|---|---|---|---|
Project execution and delay risk | -1.0% | Global EPC contractors | Affects profitability and trust. |
Skilled labor and engineering shortages | -0.8% | Large project markets | Slows project delivery. |
Managing complex supplier networks | -0.7% | Equipment-heavy projects | Raises procurement risk. |
Transition from thermal to renewable EPC | -0.6% | Asia Pacific and Europe | Requires capability upgrade. |
Safety and compliance requirements | -0.5% | Power construction sites | Adds execution complexity. |
Segment Covered in the Report
By Type of Power Generation
Thermal Power
Renewable Energy
Nuclear Power
Hydropower
Others
By Service Type
Engineering
Procurement
Construction
By Equipment Type
Steam Turbines
Gas Turbines
Solar PV Systems
Wind Turbines
Boilers
Generators
Others
By Region
North America
Europe
Asia Pacific
Latin America
Middle East and Africa
Market Trend Analysis
The market trend is moving toward renewable EPC, integrated power storage, smart grids, digital project management, modular construction, and low-carbon power infrastructure. EPC companies are increasingly expected to deliver complete solutions rather than only construction services.
Asia Pacific remains the largest value region because of strong power demand, renewable capacity growth, and large-scale grid investment. North America and Europe also support growth through grid modernization, clean power projects, offshore wind, and energy security investments.
Impact Factor | Estimated CAGR Impact | Regional Relevance | Market Impact |
|---|---|---|---|
Renewable EPC becomes mainstream | +2.1% | Asia Pacific, Europe, North America | Shifts project pipeline. |
Grid and substation EPC expands | +1.7% | China, India, Southeast Asia | Supports power reliability. |
Digital project management adoption rises | +1.4% | Large EPC contractors | Improves cost and schedule control. |
Hybrid renewable-plus-storage projects grow | +1.2% | Renewable-heavy markets | Improves power stability. |
Modular construction methods increase | +1.0% | Utility and industrial projects | Speeds project execution. |
Investor Type Impact Matrix
Investors should focus on EPC companies with strong execution capability, renewable project experience, grid infrastructure expertise, procurement scale, and healthy order books. Strong risk management, contract discipline, and delivery track record are key success factors.
Strategic investors can also target renewable EPC firms, transmission contractors, energy storage integrators, digital construction platforms, offshore wind EPC specialists, and equipment-linked EPC service providers. Companies that combine engineering strength with clean power and grid modernization capabilities are better positioned for long-term growth.
Investor Type | Estimated CAGR Impact | Regional Relevance | Market Impact |
|---|---|---|---|
Power EPC Contractors | +1.8% | Global | Expands core project delivery. |
Renewable EPC Companies | +1.5% | Asia Pacific, Europe, North America | Supports clean energy projects. |
Transmission and Substation Contractors | +1.2% | Grid expansion markets | Builds network infrastructure value. |
Energy Storage EPC Integrators | +1.0% | Renewable-heavy markets | Adds flexibility and reliability. |
Strategic Infrastructure Investors | +0.8% | Global power markets | Funds large-scale project execution. |
Recent Developments
In April 2026, Fluor signed a contract with X-energy to provide early engineering, project-definition and risk-assessment services for Dow’s proposed advanced nuclear power project at its Seadrift operations in Texas.
In February 2026, Vikram Solar secured a 378.75 MW module order for an NTPC Green Energy project near Nakhatrana, Gujarat, expanding its role as a domestic equipment supplier for utility-scale solar development.
In August 2025, Tata Projects adopted SAP’s cloud-based business suite across its operations, investing in enterprise-wide digital systems intended to improve planning, procurement, execution visibility and control across complex EPC projects.
Competitive Landscape
The market is characterized by intense competition among established players and emerging companies. Strategic partnerships, mergers and acquisitions, and product innovation are key strategies employed by market participants.
Key Market Players
Bechtel Corporation
Fluor Corporation
Siemens AG
Siemens AG
Mitsubishi Heavy Industries
Honeywell International Inc.
Samsung Engineering
Sterling and Wilson Renewable Energy
Tata Power Solar
Waaree Energies
Adani Solar
Vikram Solar
Azure Power
Other Key Players
Research Methodology
This market study is prepared using a combination of primary and secondary research. Primary research includes discussions with manufacturers, suppliers, distributors, consultants, industry experts, and end users. Secondary research covers company reports, government databases, trade associations, technical publications, regulatory sources, and trusted industry documents. The collected information is used to assess market demand, pricing trends, technology adoption, competitive activity, and regional performance.
AI language models are not used as primary data sources, and publicly available AI-generated content is not treated as market evidence. Computational tools may be used to support data processing, translation, data classification, and pattern identification. However, every published assessment is supported by verified sources, human review, and primary market discussions.
Market estimates are developed through top-down and bottom-up approaches and validated using data triangulation. Revenue, production, shipment, pricing, and application-level data are compared across multiple sources. Forecasts consider economic conditions, regulatory changes, investment activity, innovation, supply chain developments, and industry risks. All findings are reviewed through source verification and internal quality checks before publication.
Part I
Source Management & Input Data Standards
Who provides data, how sources are qualified, and what types of evidence are admissible.
Part II
Research Scope & Market Coverage
How we define the markets we assess and the parameters that govern each product.
Part III
Data Collection, Verification & Submission
The mechanics of gathering, cross-checking, and hierarchically ranking evidence.
Part IV
Assessment Determination & Quality Controls
How raw data becomes a published assessment — normalisation, expert judgement, and outlier exclusion.
Part V
Publication, Corrections & Revision
Our publication schedule, corrections policy, and methodology review cycle.
Part VI
Independence, Ethics & Complaints
Conflict-of-interest policies, editorial independence, and how clients raise concerns.
Google · Preferred Sources
Don't miss the latest market research insights and industry updates on Google.
Add Globe Market Research as a preferred source in the Google app to see our reports, analysis, and market stories in your news suggestions.
Meet the Team
This report was prepared by our expert analysts with deep industry knowledge and research experience.
Pratiksha K. is a Senior Research Analyst with more than five years of experience in market research, industry analysis, competitive intelligence, and business strategy. She has contributed to detailed market reports, customized research studies, company profiling, market sizing, trend analysis, and strategic consulting projects for clients across different regions. Her industry expertise covers Chemical and Material, Consumer Goods, Food & Beverages and Energy & Power. She closely evaluates changing customer requirements, technology developments, regulatory conditions, supply chain structures, investment activity, and competitive strategies to provide clear and practical market insights.
Sayali brings more than 7 years of experience to Globe Market Research, supporting the accuracy, clarity, and relevance of research content across multiple industries. She reviews market data, segment analysis, competitive insights, and industry trends to ensure each report meets strong quality standards and provides practical value to business decision-makers. Her expertise spans healthcare, information technology, consumer goods, and diverse cross-industry domains. With a strong focus on data reliability, structured analysis, and clear presentation, Sayali helps ensure that each research output delivers well-reviewed insights for clients, investors, consultants, and industry stakeholders.
Frequently Asked Questions
Related Reports
More in Energy and Power
Oil and Gas Turbomachinery Market to Hit USD 26.9 Billion by 2035
Oil and Gas Turbomachinery Market Size, Share, Analysis By Type (Gas Compressors, Gas and Steam Turbines, Pumps, Other Types), By Deployment (Onshore, Offshore), By Industry (Upstream, Midstream, Downstream), By Regional Insights, Business plan and Project Report, Investment Opportunities, Profitability, Industry Trends, Leading Companies and Growth Forecasts by 2025-2035
Liquefied Natural Gas (LNG) Bunkering Market to Hit USD 51.7 Billion by 2035
Liquefied Natural Gas (LNG) Bunkering Market Size, Share, Analysis By Product Type (Ship-to-Ship, Truck-to-Ship, Port-to-Ship, Portable Tanks), By Application (Cargo Fleet, Tanker Fleet, Container Fleet, Ferries, Inland Vessels, Others), By Regional Insights, Business plan and Project Report, Investment Opportunities, Profitability, Industry Trends, Leading Companies and Growth Forecasts by 2025-2035
Wind Energy Market to Hit USD 348.1 Billion by 2035
Wind Energy Market Size, Share, Analysis By Location (Onshore, Offshore), By Application (Utility, Non-Utility), By Component(Turbine, Support Structure, Electrical Infrastructure, Others), By Regional Insights, Business plan and Project Report, Investment Opportunities, Profitability, Industry Trends, Leading Companies and Growth Forecasts by 2025-2035
Sodium Nickel Chloride Battery Market to Hit USD 8.3 Billion by 2035
Sodium nickel chloride battery market Size, Share, Analysis By Product Type (Stationary Sodium Nickel Chloride Batteries, Mobile Sodium Nickel Chloride Batteries, Industrial Sodium Nickel Chloride Batteries, Backup Power Battery Systems), By Application (Renewable Energy Storage, Telecom Backup, Industrial UPS, Grid Stabilization, Electric Mobility), By Regional Insights, Business plan and Project Report, Investment Opportunities, Profitability, Industry Trends, Leading Companies and Growth Forecasts by 2025-2035