

Revenue, 2025
USD 3.5 Bn
Forecast, 2035
USD 51.7 Bn
CAGR, 2025-2035
30.9%
Report Coverage
Global
Market Size and Forecast
The Global Liquefied Natural Gas (LNG) Bunkering Market was worth USD 3.5 billion in 2025 and is expected to reach USD 51.7 billion by 2035, growing at a CAGR of 30.9% from 2025 to 2035. Based on this growth rate, the market is estimated to reach around USD 8.3 billion in 2026. Europe held the largest regional share of 42.8% in 2025, valued at around USD 1.4 billion, supported by strict marine emission rules, strong port infrastructure, LNG-powered vessel adoption, and cleaner fuel transition across shipping routes.
The LNG Bunkering Market includes the supply of liquefied natural gas as marine fuel for ships, ferries, offshore vessels, container carriers, cruise ships, and bulk carriers. It covers truck-to-ship, ship-to-ship, port-to-ship, and terminal-based bunkering operations. The market is closely linked with maritime decarbonization, fuel cost efficiency, port modernization, and compliance with sulfur and greenhouse gas emission standards.
Key Parameter | Report Details |
|---|---|
Market Revenue, 2025 | USD 3.5 Billion |
Projected Revenue, 2035 | USD 51.7 Billion |
CAGR (2025-2035) | 30.9% |
Largest Region | Europe (42.8%, USD 1.4 Bn) |
Fastest Growing Region | Asia Pacific |
Market Concentration | Medium |
Base Year | 2024 |
Forecast Period | 2025-2035 |
The market outlook remains strong as shipping companies move toward lower-emission fuel options to meet environmental regulations and reduce operational emissions. Growth can be attributed to rising LNG-fueled vessel orders, expansion of bunkering terminals, and increasing demand for cleaner marine fuels on major trade routes. Europe’s advanced port network, policy support, and early adoption of LNG marine infrastructure are expected to support long-term market growth.
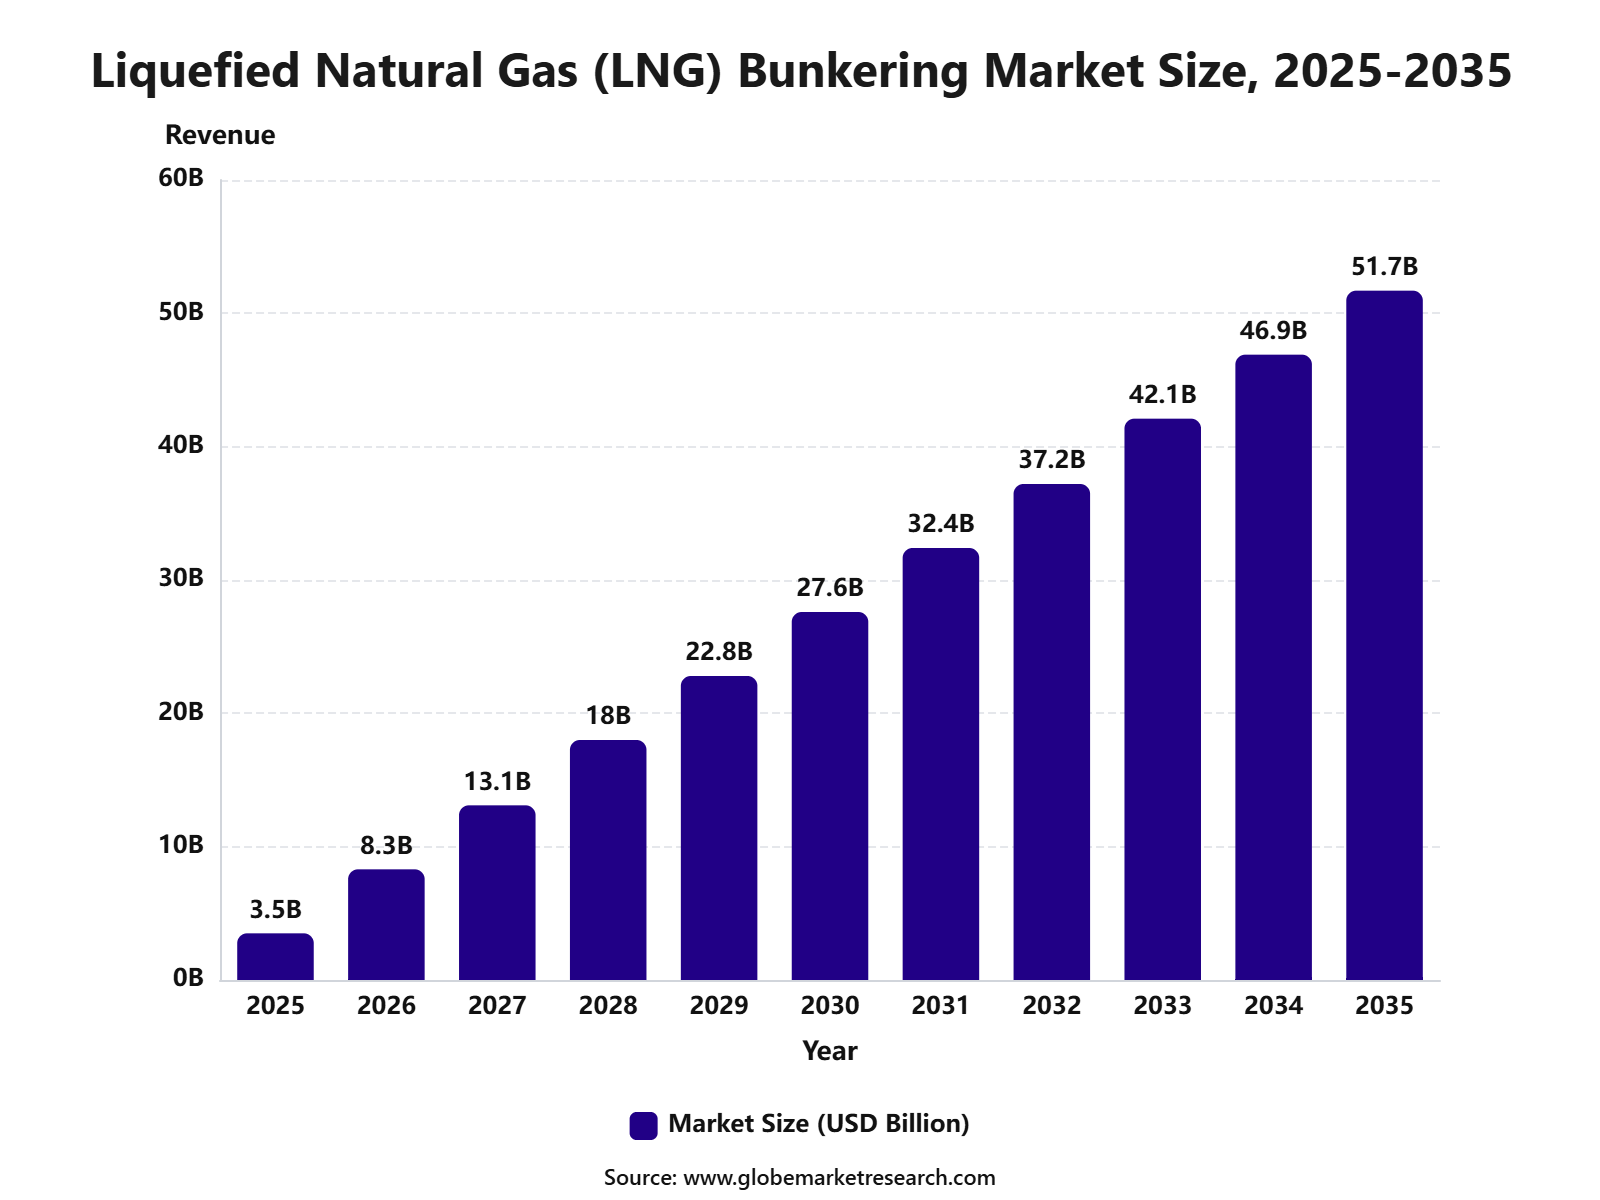 iThe graph shows projected market growth until 2035 based on CAGR analysis. Actual outcomes may vary depending on changing demand, competition, and economic factors.To gain greater insights - request a sample report PDF
Key Market Insights
Ship-to-ship bunkering led the product type segment with 43.3% share, supported by flexible fueling operations, suitability for large vessels, and strong use at busy ports and offshore anchoring locations.
Cargo fleet applications accounted for 39.8% share, driven by rising LNG adoption in bulk carriers, container ships, tankers, and other commercial vessels seeking lower-emission marine fuel options.
Europe led the LNG bunkering market with 42.8% share, valued at USD 1.4 billion, supported by strict marine emission rules, advanced port infrastructure, and growing demand for cleaner shipping fuel across major European trade routes.
Top Funding and Investment
Top Investments
Galveston LNG Bunker Port secured the final federal permits required to develop a dedicated LNG marine-fuelling terminal on Shoal Point in Texas City. The approximately USD 300 million project is planned across nearly 140 acres and is designed to supply as much as 720,000 gallons of LNG per day through marine bunker barges. Commercial operations are targeted for the second half of 2027, subject to final investment approval and construction progress.
H-Line Shipping placed a contract valued at approximately KRW 127.1 billion, or nearly USD 88 million, with HJ Shipbuilding & Construction for an LNG bunkering vessel. The vessel will have a storage capacity of approximately 18,000 cubic metres and is scheduled for delivery by the end of 2027. It will be capable of supplying large LNG-powered vessels during a single bunkering operation.
Cochin Port Authority signed an agreement with Bharat Petroleum Corporation Limited to establish LNG bunkering infrastructure at Cochin Port. The project carries an estimated investment of INR 500 crore and covers facilities at the outer anchorage, inner port limits, and the Petronet LNG terminal jetty. The development is intended to position the port as an LNG refuelling centre for domestic and international vessels.
TotalEnergies and CMA CGM agreed to establish a 50:50 joint venture to develop LNG bunkering operations in Rotterdam. The partners will commission and jointly operate a new bunker vessel with approximately 20,000 cubic metres of LNG capacity, expected to enter service by the end of 2028. The arrangement is designed to supply CMA CGM with up to 360,000 tonnes of LNG annually through 2040. The investment value was not disclosed.
Gasum and Sirius Shipping formed a joint venture to invest in a new LNG and bio-LNG bunker vessel. The ship is being constructed by RMK Marine and is expected to be delivered in 2027 with a capacity of approximately 7,800 cubic metres. It will expand Gasum’s ability to deliver lower-emission marine fuels to vessels operating across Northwestern Europe. The project value was not disclosed.
Top Funding Transactions
Peninsula renewed a USD 400 million syndicated credit facility through its Singapore operations. The financing supports working capital, marine fuel procurement, vessel operations, and the expansion of its global physical bunkering activities, including LNG supply services. The transaction strengthened Peninsula’s total funding capacity to more than USD 1.5 billion, providing additional liquidity for international marine energy operations.
Avenir LNG secured approximately USD 128 million in pre-delivery and post-delivery financing for two new LNG bunkering vessels. The funding supports the construction and delivery of the ships, which will expand the company’s small-scale LNG transportation and marine-fuelling fleet. The financing structure was arranged to cover both the shipbuilding period and the vessels’ entry into commercial service.
Hong Kong introduced a Green Maritime Fuel Bunkering Incentive Scheme that includes financial support for early LNG bunkering operations. Eligible companies can receive HKD 500,000 for each of their first two qualifying LNG or green-methanol bunkering operations completed within the prescribed period. The scheme provides up to HKD 2 million for each recognized fuel category, supporting initial operating costs and safety preparation.
Top Acquisitions
Shell, Singapore, April 2025: Acquisition of Pavilion Energy
Shell completed the acquisition of 100% of Pavilion Energy from Temasek. The acquired portfolio includes approximately 6.5 million tonnes per annum of contracted LNG supply, LNG purchase and sales agreements, chartered vessels, and around 2 million tonnes per annum of long-term regasification capacity at the Isle of Grain terminal in the United Kingdom.
The transaction also transferred Pavilion Energy’s LNG bunkering operations to Shell. These assets include marine-fuel supply capabilities in Singapore and an LNG bunker vessel that had entered service in early 2024. The acquisition increased Shell’s access to LNG markets, shipping capacity, and marine-fuelling customers across Asia and Europe. The purchase price was not publicly disclosed.
Molgas Energy, Netherlands, October 2025: Acquisition of Titan Clean Fuels
Molgas Energy acquired full ownership of Titan Energy Holding, the parent company of Titan Clean Fuels, after previously holding a 45% minority interest. The acquisition included Titan’s LNG and bio-LNG bunkering business, marine-fuel distribution operations, customer contracts, and specialized bunker vessel fleet.
Following the transaction, the combined Molgas group operated seven LNG bunkering vessels, more than 70 road-fuelling stations, and over 200 fuel sales points. The acquisition expanded Molgas’ position in LNG and renewable liquefied biomethane supply across European ports and inland transportation networks.
By Product Type
Ship-to-ship bunkering accounted for 43.3% share of the Liquefied Natural Gas (LNG) Bunkering Market. This leading position is supported by its operational flexibility, faster fuel transfer, and strong suitability for large vessels operating at busy ports and offshore locations.
The method is widely preferred because LNG can be supplied directly from a bunker vessel to the receiving ship without requiring the vessel to shift berth. This helps reduce port congestion, improve turnaround time, and support continuous operations for cargo ships, container vessels, tankers, ferries, and offshore support vessels.
Demand for ship-to-ship LNG bunkering is expected to remain strong as shipping companies move toward lower-emission marine fuels. Its ability to support larger fuel volumes and serve vessels across multiple port locations will continue to strengthen its role in LNG marine fuel supply.
By Application
Cargo fleet applications accounted for 39.8% share of the LNG Bunkering Market. This dominance is driven by the high fuel demand of container ships, bulk carriers, tankers, roll-on roll-off vessels, and other commercial cargo vessels used in global trade.
LNG bunkering is being adopted in cargo fleets because it helps reduce sulfur oxide, nitrogen oxide, and particulate emissions compared with traditional marine fuels. It also supports compliance with stricter maritime emission rules while allowing operators to maintain long-distance shipping performance.
The segment is expected to remain a major demand area as cargo operators invest in LNG-fueled vessels and dual-fuel engines. Growth will be supported by expanding LNG bunkering infrastructure, rising international trade, and the need for cleaner fuel options in commercial shipping.
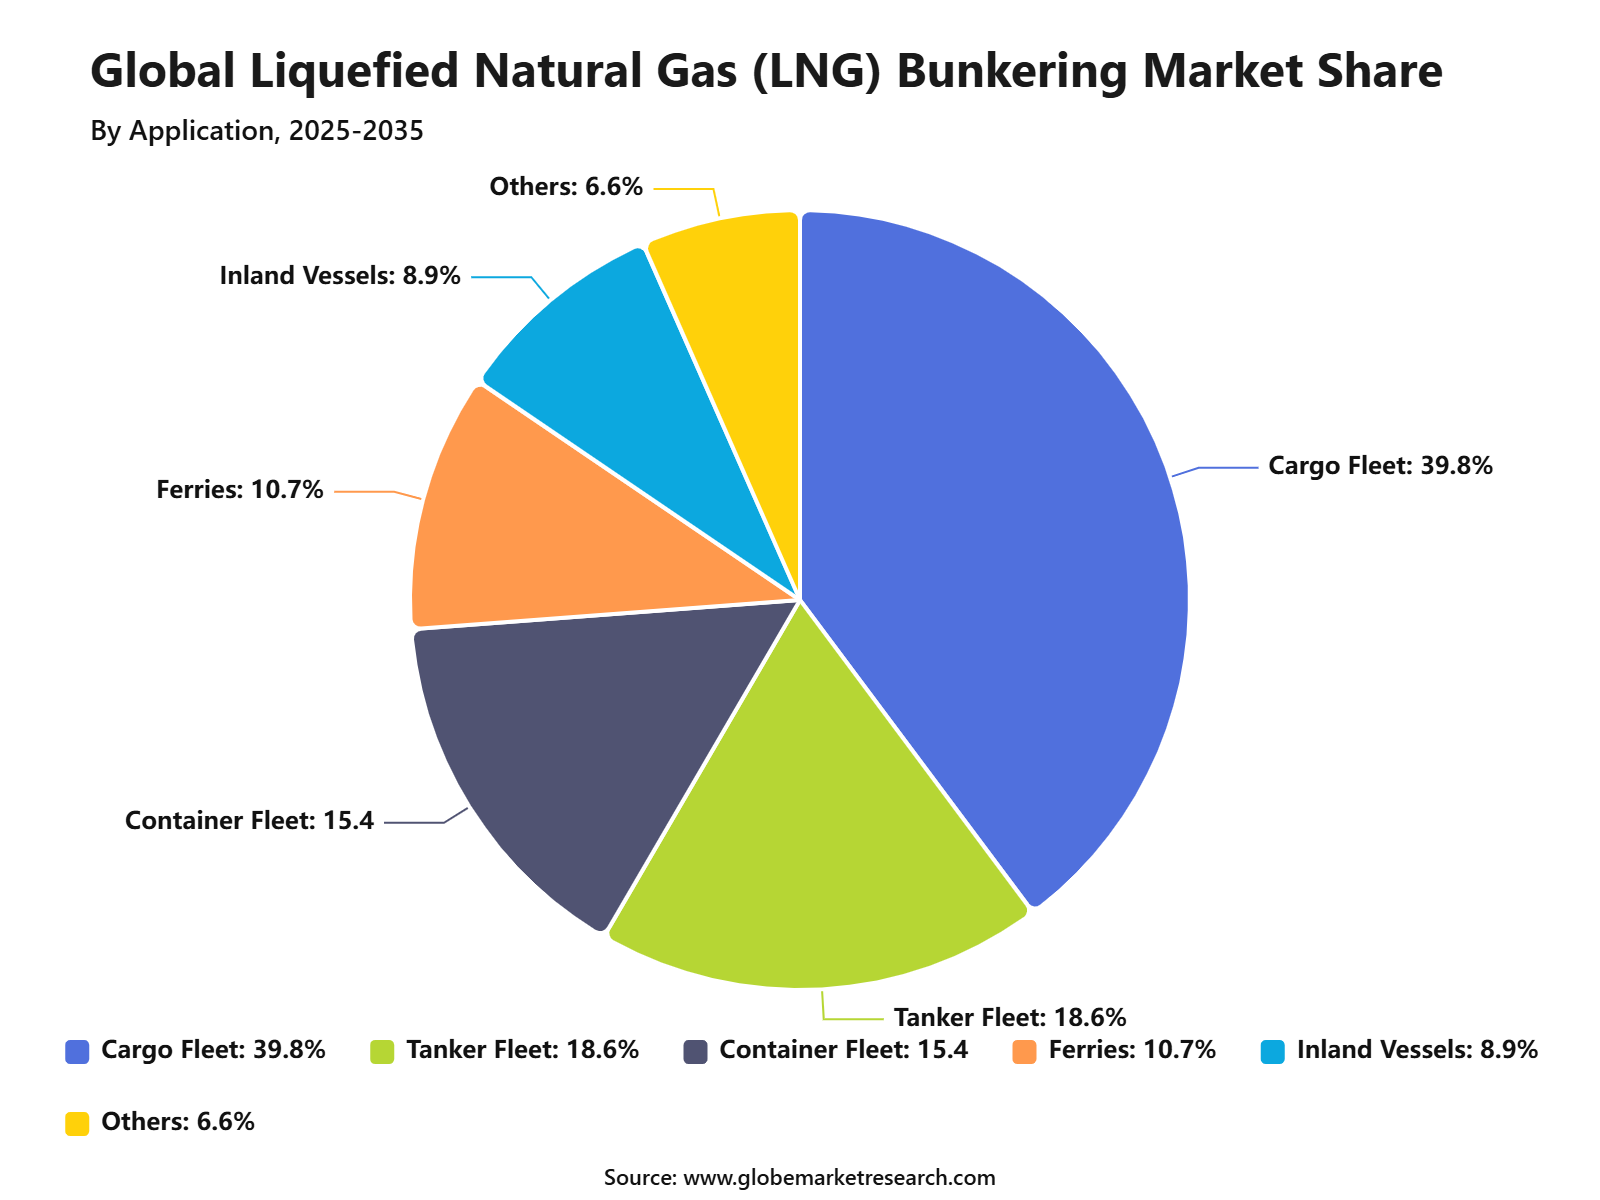 iThe graph shows projected market growth until 2035 based on CAGR analysis. Actual outcomes may vary depending on changing demand, competition, and economic factors.To gain greater insights - request a sample report PDF
By Region
Europe accounted for 42.8% share of the Liquefied Natural Gas (LNG) Bunkering Market, reaching USD 1.4 billion. The region’s leadership is supported by strict marine emission regulations, strong port infrastructure, and early adoption of LNG as a cleaner marine fuel.
Countries such as the Netherlands, Norway, Germany, Spain, France, Belgium, and the United Kingdom are key contributors to regional LNG bunkering activity. Europe benefits from established LNG terminals, active short-sea shipping routes, and strong policy support for reducing emissions from maritime transport.
Europe is expected to maintain a strong position as shipping companies continue to modernize fleets and ports expand LNG refueling capacity. Demand will remain supported by cargo fleets, passenger vessels, offshore ships, and regional efforts to reduce the environmental impact of marine operations.
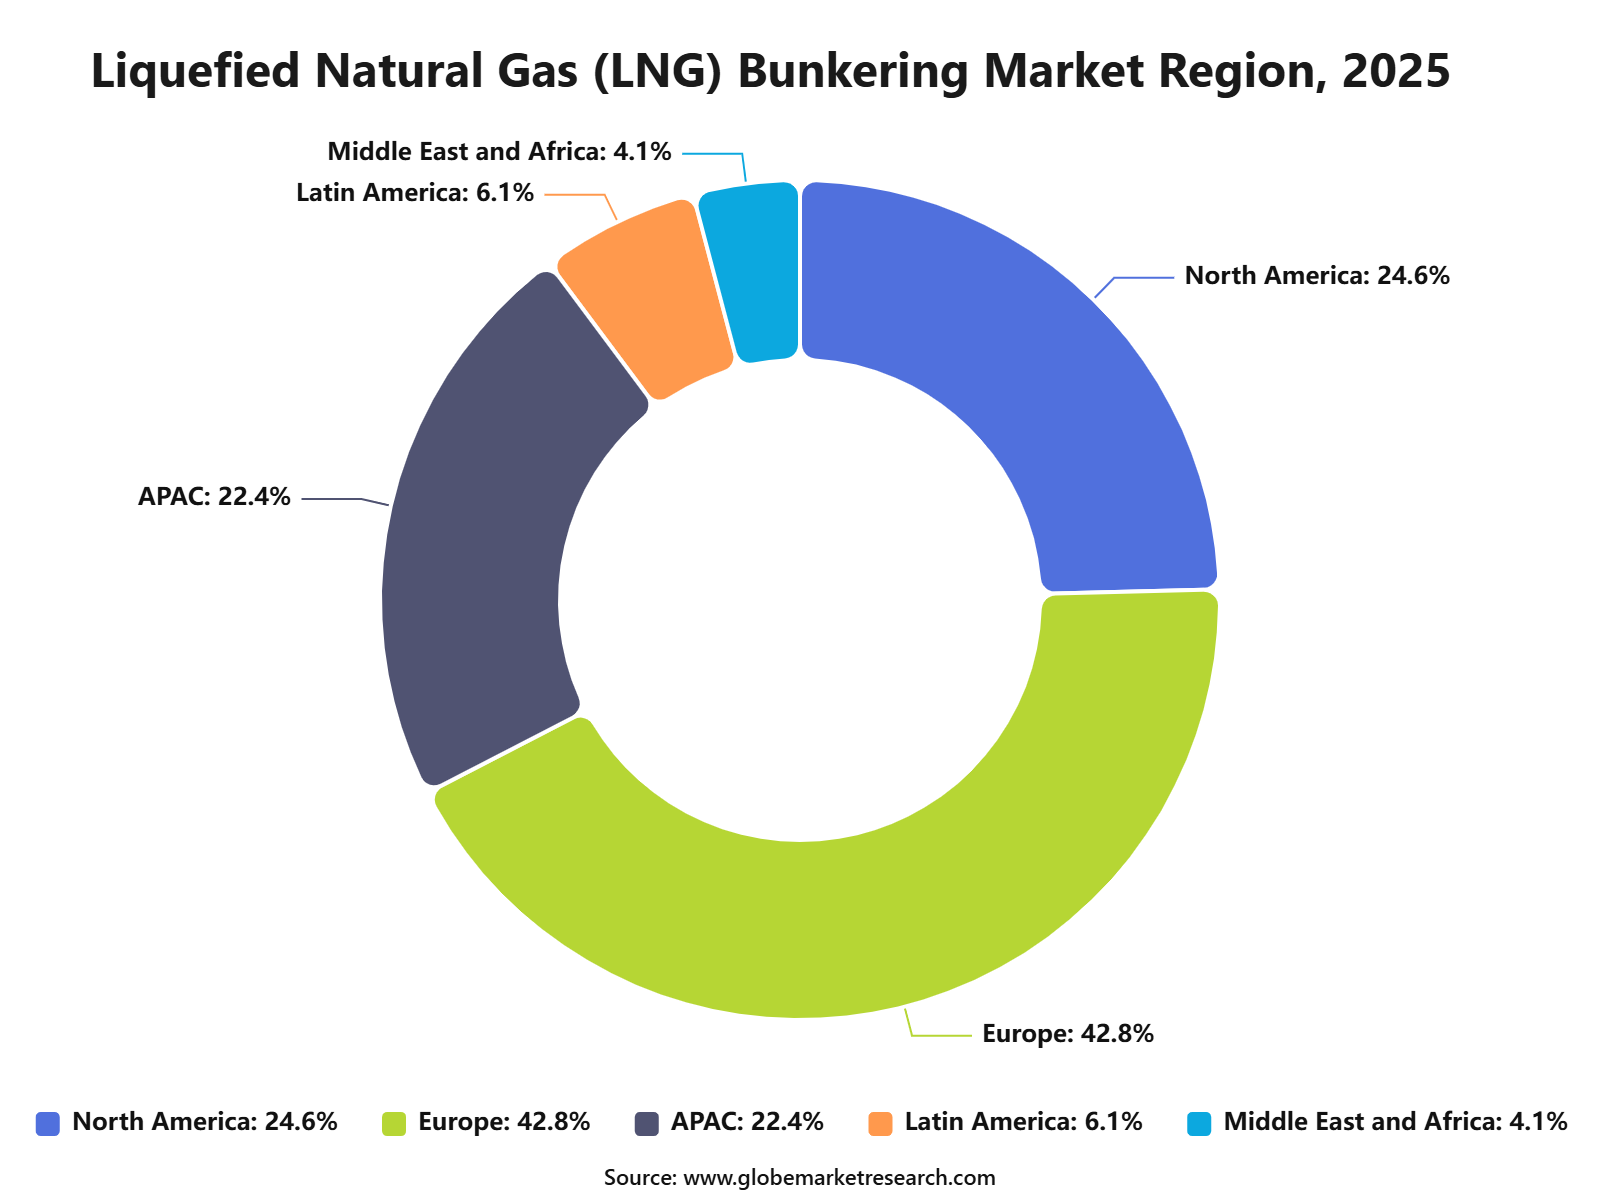 iThe graph shows projected market growth until 2035 based on CAGR analysis. Actual outcomes may vary depending on changing demand, competition, and economic factors.To gain greater insights - request a sample report PDF
Regional Impact Analysis
Europe leads the Liquefied Natural Gas Bunkering Market with 42.8% share in 2025, valued at around USD 1.5 billion, supported by mature port infrastructure, clean shipping regulations, LNG-fueled ferries, cruise vessels, and short-sea shipping routes. Norway, Netherlands, Spain, Germany, France, Belgium, and the UK remain key regional markets.
Asia Pacific is expected to build strong future demand through major ports, shipbuilding activity, LNG import infrastructure, and growing marine fuel diversification. North America supports value growth through LNG export capacity, coastal shipping, cruise operations, and port decarbonization initiatives.
Impact Factor | Estimated CAGR Impact | Regional Relevance | Market Impact |
|---|---|---|---|
Europe market leadership | +9.0% | Europe, 42.8% share in 2025 | Leads global value demand. |
Norway and Netherlands bunkering maturity | +6.7% | Northern Europe | Supports early infrastructure strength. |
Spain and Germany port expansion | +5.4% | Southern and Central Europe | Adds regional fueling capacity. |
Asia Pacific port and shipbuilding growth | +4.8% | China, Japan, South Korea, Singapore | Builds future scale. |
North America LNG supply advantage | +3.9% | U.S. and Canada | Supports marine fuel availability. |
Go-To-Market and Sales Economics
LNG bunker suppliers should target container lines, car carriers, cruise operators, tanker fleets, and vessel-management companies through port-based account teams. Shell’s June 2026 outlook counted 922 operational LNG-fuelled vessels and 770 vessels on order, excluding LNG carriers. This installed and committed fleet creates visible demand for contracted fuel supply, delivery slots, and technical support.
Market entry should be concentrated around major trade lanes rather than broad national coverage. SEA-LNG reported in January 2026 that LNG bunkering was available at 222 ports, supported by more than 62 bunker vessels and an orderbook of 38. Hub-and-spoke operations, ship-to-ship delivery, and partnerships with terminals can improve asset utilisation and customer reach.
Singapore provides a strong model for commercial expansion. The Maritime and Port Authority reported 56.77 million tonnes of marine fuel sales in 2025, including 1.95 million tonnes of alternative fuels. New LNG bunker-supply licences opened in January 2026, while upgraded technical standards were scheduled for the second quarter, supporting safer market participation and service differentiation.
Risk Factors & Market Barriers
Regulatory exposure is increasing for LNG-fuelled shipping. From 2026, the EU Emissions Trading System covers methane and nitrous oxide alongside carbon dioxide. It applies to 100% of emissions between EU ports and within ports, plus 50% of emissions on voyages connecting the EU with non-EU ports, raising compliance and reporting costs for suppliers and customers.
Methane slip remains an important technical and reputational barrier. At MEPC 84 in 2026, three measurement guidelines were adopted for test-bed testing, onboard measurements, engine-load monitoring, and continuous emission systems. Suppliers may need verified fuel pathways, accurate custody-transfer data, and engine-specific emissions evidence because lifecycle performance can influence customer purchasing and regulatory treatment.
Demand can also shift quickly with fuel pricing, route changes, and competing compliance options. Rotterdam reported that total bunker volumes fell about 25% during the first quarter of 2026, although alternative-fuel sales increased 6.4%. Fixed infrastructure, vessel charter costs, and storage commitments can therefore pressure margins when utilisation falls or customers redirect bunkering to competing ports.
Revenue Potential Analysis
Revenue Landscape Across
Northern Europe offers immediate revenue through established container and short-sea routes. Rotterdam supplied more than 1 million cubic metres of LNG during 2025, while bio-LNG reached 17,644 cubic metres, over six times the 2024 volume. Suppliers can develop premium offerings through certified bio-LNG blends, scheduled ship-to-ship deliveries, and emissions-documentation services for regulated European voyages.
Asia provides scale through Singapore’s high-volume bunkering ecosystem. The port had nine Green and Digital Shipping Corridors in 2025, while 2026 projects cover emissions reporting, digital exchanges, and fuel trials. Revenue can be expanded through long-term offtake contracts, simultaneous cargo and bunkering operations, quality assurance, and regional supply arrangements serving major Asia-Europe routes.
The Gulf is emerging as a new LNG bunkering corridor. Marsa LNG in Oman is being developed with annual liquefaction capacity of 1 million tonnes, primarily for marine fuel, with production expected in the first quarter of 2028. A dedicated bunker vessel will serve container ships, tankers, and cruise vessels from Sohar, creating regional supply and logistics opportunities.
Financial Impact
Long-term contracts can provide stable throughput and improve bunker-vessel financing. TotalEnergies and CMA CGM plan a 20,000-cubic-metre vessel in Rotterdam by 2028 under a 50:50 logistics joint venture. The associated agreement provides for up to 360,000 tonnes of LNG annually through 2040, demonstrating how committed volumes can support infrastructure investment and predictable operating revenue.
Fleet growth should increase addressable fuel volumes. Shell’s 2026 outlook projects LNG bunkering demand rising from about 4 million tonnes annually in 2025 to approximately 15 million tonnes by 2030. Suppliers that secure terminal access and vessel capacity before demand accelerates may achieve stronger utilisation, although returns will remain dependent on spreads, charter rates, and delivery density.
Low-carbon methane can improve pricing potential but introduces feedstock and certification costs. DNV reported in June 2026 that liquefied biomethane in Rotterdam was priced near USD 1,860 per tonne in late 2025, almost three times fossil LNG. However, reduced EU ETS exposure and FuelEU pooling income can make it competitive on selected intra-European voyages, supporting higher-value contracts.
Drivers Impact Analysis
The Liquefied Natural Gas Bunkering Market is driven by stricter marine emission rules, growing LNG-fueled vessel fleets, port decarbonization plans, and rising demand for cleaner marine fuel alternatives. LNG bunkering helps shipping operators reduce sulfur oxide, nitrogen oxide, and particulate emissions compared with traditional marine fuels.
Europe leads the market due to strong port infrastructure, cleaner shipping policies, ferry and cruise vessel adoption, and established LNG supply networks. Norway, Netherlands, Spain, Germany, France, Belgium, and the UK remain important markets because of active maritime trade routes and early LNG bunkering investment.
Impact Factor | Estimated CAGR Impact | Regional Relevance | Market Impact |
|---|---|---|---|
Stricter marine emission regulations | +8.6% | Europe, North America, Asia Pacific | Drives LNG fuel adoption. |
Growth in LNG-fueled vessel fleets | +7.4% | Europe and global shipping routes | Expands bunkering demand. |
Port decarbonization programs | +6.3% | European ports and coastal hubs | Supports infrastructure rollout. |
Rising demand for cleaner marine fuels | +5.4% | Shipping and cruise operators | Improves LNG fuel acceptance. |
Expansion of LNG supply chains | +4.5% | Europe, Asia Pacific, Middle East | Strengthens fuel availability. |
Restraints Impact Analysis
The market faces restraints from high infrastructure cost, cryogenic storage requirements, limited bunkering availability in some ports, and uncertainty around long-term fuel choices. LNG bunkering requires specialized storage tanks, transfer systems, safety equipment, trained crews, and port-side approvals.
Another restraint is competition from alternative marine fuels such as methanol, ammonia, hydrogen, biofuels, and battery-electric solutions for short routes. Shipping companies may delay fleet fuel decisions while future fuel standards and vessel economics become clearer.
Impact Factor | Estimated CAGR Impact | Regional Relevance | Market Impact |
|---|---|---|---|
High LNG bunkering infrastructure cost | -4.2% | Global ports and terminal operators | Slows network expansion. |
Limited bunkering availability | -3.6% | Emerging maritime hubs | Restricts vessel route planning. |
Cryogenic handling complexity | -3.1% | Port and vessel operators | Raises safety and training needs. |
Competition from future marine fuels | -2.7% | Europe, Japan, South Korea, U.S. | Creates investment uncertainty. |
Methane slip concerns | -2.3% | Regulated shipping markets | Increases technology pressure. |
Opportunities Impact Analysis
Opportunities are strong in ship-to-ship bunkering, truck-to-ship bunkering, terminal-based bunkering, LNG-fueled container ships, cruise ships, ferries, tankers, and offshore support vessels. These applications benefit from rising demand for cleaner fuel options across high-volume maritime routes.
Higher-value opportunities are emerging in bio-LNG blending, small-scale LNG terminals, bunkering vessels, digital fuel management, port-side LNG storage, and long-term marine fuel supply contracts. Companies that provide safe, flexible, and route-based bunkering services can capture stronger long-term growth.
Impact Factor | Estimated CAGR Impact | Regional Relevance | Market Impact |
|---|---|---|---|
Ship-to-ship LNG bunkering expansion | +8.2% | Europe, Asia Pacific, North America | Builds flexible fuel supply. |
LNG-fueled container vessel growth | +6.9% | Major trade corridors | Supports large-volume demand. |
Cruise and ferry LNG adoption | +5.8% | Europe and coastal markets | Adds regular bunkering use. |
Bio-LNG blending opportunity | +4.9% | Europe and low-carbon shipping hubs | Improves emissions profile. |
Small-scale LNG terminal development | +4.0% | Regional ports and islands | Expands supply access. |
Challenges Impact Analysis
The main challenge is building a reliable bunkering network across major shipping corridors. Vessel owners need confidence that LNG fuel will be available at key ports before committing to LNG-powered ships.
Another challenge is maintaining safe operations during LNG transfer. Bunkering involves low-temperature fuel handling, vapor management, pressure control, emergency response systems, and strict coordination between port authorities, fuel suppliers, and ship operators.
Impact Factor | Estimated CAGR Impact | Regional Relevance | Market Impact |
|---|---|---|---|
Route-based infrastructure gaps | -3.9% | Global shipping corridors | Limits vessel adoption confidence. |
Safety and crew training requirements | -3.3% | Ports and vessel operators | Adds operating complexity. |
Methane management and fuel quality control | -2.8% | Regulated marine markets | Affects environmental credibility. |
Coordinating port approvals | -2.4% | Busy maritime hubs | Delays project execution. |
Balancing demand and asset utilization | -2.0% | New bunkering facilities | Impacts project returns. |
Segment Covered in the Report
By Product Type
Ship-to-Ship
Truck-to-Ship
Port-to-Ship
Portable Tanks
By Application
Cargo Fleet
Tanker Fleet
Container Fleet
Ferries
Inland Vessels
Others
By Region
North America
Europe
Asia Pacific
Latin America
Middle East and Africa
Market Trend Analysis
The market trend is moving toward ship-to-ship bunkering, LNG bunker vessels, bio-LNG integration, dual-fuel marine engines, small-scale LNG logistics, and port-based clean fuel corridors. Shipping operators are focusing on fuels that can reduce emissions while using available engine and storage technology.
Europe remains the largest value region because of early LNG bunkering infrastructure, strict maritime emission focus, and strong adoption across ferries, cruise vessels, and short-sea shipping. Asia Pacific is also gaining importance through large shipbuilding capacity, busy ports, and growing LNG-fueled vessel deployment.
Impact Factor | Estimated CAGR Impact | Regional Relevance | Market Impact |
|---|---|---|---|
LNG bunker vessel deployment rises | +7.8% | Europe, Asia Pacific, North America | Improves fueling flexibility. |
Dual-fuel vessel adoption grows | +6.6% | Global commercial shipping | Supports long-term fuel demand. |
Bio-LNG gains market attention | +5.5% | Europe and clean fuel ports | Adds low-carbon pathway. |
Small-scale LNG logistics expand | +4.7% | Regional and island routes | Supports localized bunkering. |
Green port initiatives increase | +3.9% | European and Asian ports | Strengthens infrastructure investment. |
Investor Type Impact Matrix
Investors should focus on LNG bunkering companies with strong port access, safe transfer operations, bunker vessel capacity, long-term shipping contracts, and reliable LNG supply. Utilization rate, safety compliance, route coverage, and fuel procurement strength are key success factors.
Strategic investors can also target bunker vessel operators, small-scale LNG terminal developers, port infrastructure firms, bio-LNG suppliers, dual-fuel vessel service providers, and digital marine fuel platforms. Companies that connect LNG supply with active shipping routes are better positioned for long-term growth.
Investor Type | Estimated CAGR Impact | Regional Relevance | Market Impact |
|---|---|---|---|
LNG Bunkering Operators | +6.8% | Global maritime hubs | Expands fuel service networks. |
LNG Bunker Vessel Owners | +5.6% | Europe, Asia Pacific, North America | Supports ship-to-ship fueling. |
Port Infrastructure Developers | +4.7% | Major ports and terminals | Builds long-term asset value. |
Bio-LNG Fuel Suppliers | +3.9% | Europe and clean shipping routes | Improves low-carbon positioning. |
Strategic Maritime Energy Investors | +3.2% | Global shipping markets | Funds infrastructure and route scale. |
Recent Developments
In July 2026, Peninsula supplied bio-LNG to Royal Caribbean’s Legend of the Seas in Cádiz, completing the port’s first bio-LNG delivery and extending its lower-carbon marine-fuel operations across Mediterranean ports.
In February 2026, Galileo Technologies supported Indonesia’s first modular micro-LNG plant using three Cryobox units, processing 2.47 million cubic feet daily and producing more than 40 tonnes of LNG per day.
In January 2026, PETRONAS prioritised fleet rejuvenation, lower-emission shipping investments, reliable LNG supply and expanded regasification capacity, strengthening the gas and maritime infrastructure required to support Malaysia’s evolving energy and marine-fuel needs.
Competitive Landscape
The market is characterized by intense competition among established players and emerging companies. Strategic partnerships, mergers and acquisitions, and product innovation are key strategies employed by market participants.
Key Market Players
Shell plc
TotalEnergies SE
Gasum Oy
ENGIE SA
Titan LNG
Peninsula Petroleum
FueLNG Pte Ltd
Petronas
Korea Gas Corporation
Harvey Gulf International Marine
Seaside LNG
Nauticor GmbH
Galileo Technologies
Other Key Players
Research Methodology
This market study is prepared using a combination of primary and secondary research. Primary research includes discussions with manufacturers, suppliers, distributors, consultants, industry experts, and end users. Secondary research covers company reports, government databases, trade associations, technical publications, regulatory sources, and trusted industry documents. The collected information is used to assess market demand, pricing trends, technology adoption, competitive activity, and regional performance.
AI language models are not used as primary data sources, and publicly available AI-generated content is not treated as market evidence. Computational tools may be used to support data processing, translation, data classification, and pattern identification. However, every published assessment is supported by verified sources, human review, and primary market discussions.
Market estimates are developed through top-down and bottom-up approaches and validated using data triangulation. Revenue, production, shipment, pricing, and application-level data are compared across multiple sources. Forecasts consider economic conditions, regulatory changes, investment activity, innovation, supply chain developments, and industry risks. All findings are reviewed through source verification and internal quality checks before publication.
Part I
Source Management & Input Data Standards
Who provides data, how sources are qualified, and what types of evidence are admissible.
Part II
Research Scope & Market Coverage
How we define the markets we assess and the parameters that govern each product.
Part III
Data Collection, Verification & Submission
The mechanics of gathering, cross-checking, and hierarchically ranking evidence.
Part IV
Assessment Determination & Quality Controls
How raw data becomes a published assessment — normalisation, expert judgement, and outlier exclusion.
Part V
Publication, Corrections & Revision
Our publication schedule, corrections policy, and methodology review cycle.
Part VI
Independence, Ethics & Complaints
Conflict-of-interest policies, editorial independence, and how clients raise concerns.
Google · Preferred Sources
Don't miss the latest market research insights and industry updates on Google.
Add Globe Market Research as a preferred source in the Google app to see our reports, analysis, and market stories in your news suggestions.
Meet the Team
This report was prepared by our expert analysts with deep industry knowledge and research experience.
Pratiksha K. is a Senior Research Analyst with more than five years of experience in market research, industry analysis, competitive intelligence, and business strategy. She has contributed to detailed market reports, customized research studies, company profiling, market sizing, trend analysis, and strategic consulting projects for clients across different regions. Her industry expertise covers Chemical and Material, Consumer Goods, Food & Beverages and Energy & Power. She closely evaluates changing customer requirements, technology developments, regulatory conditions, supply chain structures, investment activity, and competitive strategies to provide clear and practical market insights.
Sayali brings more than 7 years of experience to Globe Market Research, supporting the accuracy, clarity, and relevance of research content across multiple industries. She reviews market data, segment analysis, competitive insights, and industry trends to ensure each report meets strong quality standards and provides practical value to business decision-makers. Her expertise spans healthcare, information technology, consumer goods, and diverse cross-industry domains. With a strong focus on data reliability, structured analysis, and clear presentation, Sayali helps ensure that each research output delivers well-reviewed insights for clients, investors, consultants, and industry stakeholders.
Frequently Asked Questions
Related Reports
More in Energy and Power
Oil and Gas Turbomachinery Market to Hit USD 26.9 Billion by 2035
Oil and Gas Turbomachinery Market Size, Share, Analysis By Type (Gas Compressors, Gas and Steam Turbines, Pumps, Other Types), By Deployment (Onshore, Offshore), By Industry (Upstream, Midstream, Downstream), By Regional Insights, Business plan and Project Report, Investment Opportunities, Profitability, Industry Trends, Leading Companies and Growth Forecasts by 2025-2035
Wind Energy Market to Hit USD 348.1 Billion by 2035
Wind Energy Market Size, Share, Analysis By Location (Onshore, Offshore), By Application (Utility, Non-Utility), By Component(Turbine, Support Structure, Electrical Infrastructure, Others), By Regional Insights, Business plan and Project Report, Investment Opportunities, Profitability, Industry Trends, Leading Companies and Growth Forecasts by 2025-2035
Power EPC Market to Hit USD 1,516.1 Billion by 2035
Power EPC Market Size, Share, Analysis By Type of Power Generation (Thermal Power, Renewable Energy, Nuclear Power, Hydropower, Others), By Service Type (Engineering, Procurement, Construction), By Equipment Type (Steam Turbines, Gas Turbines, Solar PV Systems, Wind Turbines, Boilers, Generators, Others), By Regional Insights, Business plan and Project Report, Investment Opportunities, Profitability, Industry Trends, Leading Companies and Growth Forecasts by 2025-2035
Sodium Nickel Chloride Battery Market to Hit USD 8.3 Billion by 2035
Sodium nickel chloride battery market Size, Share, Analysis By Product Type (Stationary Sodium Nickel Chloride Batteries, Mobile Sodium Nickel Chloride Batteries, Industrial Sodium Nickel Chloride Batteries, Backup Power Battery Systems), By Application (Renewable Energy Storage, Telecom Backup, Industrial UPS, Grid Stabilization, Electric Mobility), By Regional Insights, Business plan and Project Report, Investment Opportunities, Profitability, Industry Trends, Leading Companies and Growth Forecasts by 2025-2035