

Revenue, 2025
$3.6 Bn
Forecast, 2035
$113.5 Bn
CAGR, 2025-2035
41.2%
Report Coverage
Global
Market Size and Forecast
The Global Graphene Market reached USD 3.6 billion in 2025 and is expected to grow to USD 113.5 billion by 2035, registering a CAGR of 41.2% from 2025 to 2035. The growth of the market can be attributed to rising demand for lightweight, high-strength, conductive, and flexible materials across electronics, energy storage, composites, coatings, sensors, biomedical devices, and advanced manufacturing applications. Graphene is gaining strong attention due to its high electrical conductivity, thermal performance, mechanical strength, and ability to improve product durability and efficiency.
Demand is further supported by increasing use of graphene in batteries, supercapacitors, conductive inks, anti-corrosion coatings, polymer composites, and next-generation electronic devices. Asia Pacific held the largest regional share of 47.6% in 2025, supported by strong electronics manufacturing, battery production, material innovation, and industrial research activity across China, Japan, South Korea, India, and Southeast Asia. The region is benefiting from growing investment in electric vehicles, energy storage systems, semiconductors, flexible electronics, and advanced composite materials. China remains a key production and commercialization hub, while Japan and South Korea are focused on high-performance electronics, batteries, and nanomaterial applications.
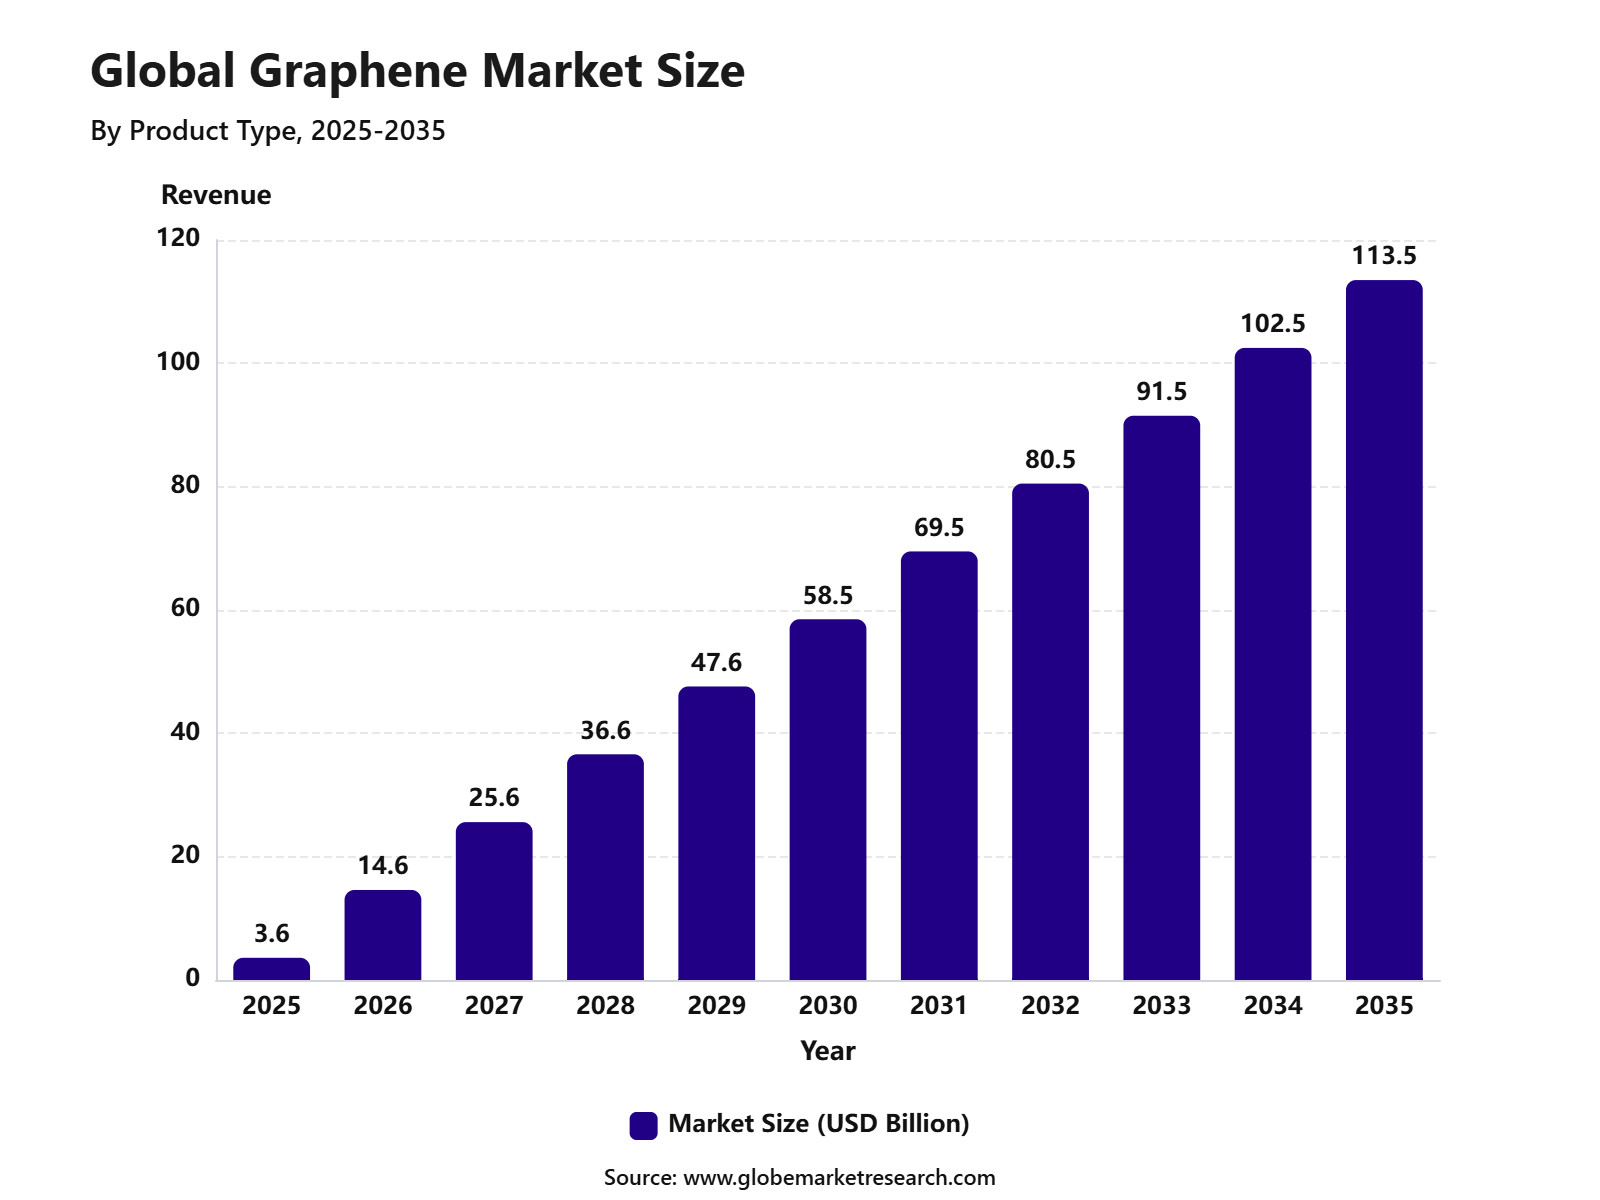 iThe graph shows projected market growth until 2035 based on CAGR analysis. Actual outcomes may vary depending on changing demand, competition, and economic factors.To gain greater insights - request a sample report PDF
Key Market Insights
Graphene nanoplatelets led the product type segment with 55.1% share, supported by their wide use in coatings, composites, batteries, conductive inks, and lightweight materials.
Chemical vapor deposition accounted for 40.4% share by production method, driven by its ability to produce high-quality graphene films for electronics, sensors, and advanced material applications.
Composites held 37.4% share by application, supported by rising demand for stronger, lighter, and more conductive materials across automotive, aerospace, energy, and industrial uses.
Electronics and telecommunications led the end-user industry with 55.4% share, driven by growing use of graphene in sensors, semiconductors, flexible electronics, displays, and high-speed communication systems.
Asia Pacific accounted for 47.6% share of the graphene market, supported by strong electronics manufacturing, material innovation, battery production, and rising investment in advanced nanomaterials.
Graphene Market Overview
The Graphene Market is gaining strong commercial interest because graphene is one of the thinnest and strongest known materials, with high electrical conductivity, strong heat transfer, flexibility, and light weight. It is a single layer of carbon atoms, and public science sources describe it as one atom thick and about 200 times stronger than steel, which makes it valuable for advanced electronics, batteries, coatings, sensors, composites, water filtration, and biomedical materials.
The Graphene Flagship, launched under the European Commission’s Horizon 2020 framework, had a budget of €1 billion and became one of Europe’s largest coordinated research initiatives for bringing graphene from laboratories into industrial use. This level of public research funding shows that graphene is being treated as a strategic material for future electronics, clean energy, advanced manufacturing, and high-performance industrial products. Market demand is being supported by rising investment in electric vehicles, energy storage, lightweight composites, and high-performance coatings.
The International Energy Agency reported that global electric car sales exceeded 20 million units in 2025, rising 20% from 2024, and electric cars accounted for 25% of total car sales, creating a stronger demand base for advanced battery and conductive materials. Graphene-based materials are being studied for battery electrodes, supercapacitors, fuel cells, solar cells, hydrogen storage, sensors, and thermal management systems, although large-scale commercialization still depends on lower production cost, consistent material quality, and proven performance in end-use products.
Customer Acquisition Strategy
The Graphene Market needs an application-led go-to-market strategy because buyers do not purchase graphene only as a raw material. They purchase it for measurable improvements such as better conductivity, higher strength, lower weight, improved heat transfer, corrosion resistance, and longer battery life. Suppliers should focus on end-use testing with battery makers, coating producers, composite manufacturers, electronics companies, construction material firms, and automotive suppliers. This approach improves sales conversion because industrial customers usually require proof of repeatable performance before changing formulations.
Sales economics are strongest when graphene is sold as a performance additive, coating formulation, masterbatch, membrane, conductive ink, or battery material input rather than as a generic powder. Energy storage is one of the most important demand areas, as IEA reported that EV battery demand was about 1 TWh in 2024 and could rise above 3 TWh by 2030 under its stated policy scenario. Electric car sales also topped 20 million globally in 2025, with one in four new cars sold worldwide being electric, which supports demand for advanced battery and thermal materials.
Tariff Impact
Tariff impact in the Graphene Market is mainly linked to graphite feedstock, battery anode materials, and country-of-origin rules. Many graphene grades are produced from graphite, so tariff changes on natural graphite, artificial graphite, and battery-grade graphite can affect input costs. The U.S. Trade Representative confirmed that tariffs on natural graphite from China are scheduled to increase to 25% in 2026 under Section 301 actions. This can raise landed costs for producers that depend on Chinese graphite or graphite-derived intermediates.
Battery-linked graphene applications face higher trade risk because anode materials are under close policy review in the U.S. and Europe. In 2025, the U.S. moved against China-linked graphite active anode material, with reported anti-dumping duties of 93.5% on Chinese anode-grade graphite imports. For graphene suppliers, this means procurement teams need stronger supplier checks, origin traceability, customs classification, and contract terms that allow price adjustments when tariffs or trade duties change.
Product Type Analysis
Graphene nanoplatelets led the Graphene Market with a 55.1% share in 2025. Their leadership can be linked to easier bulk handling, strong mechanical strength, good electrical conductivity, light weight, and wide compatibility with polymers, coatings, inks, and composite materials. These features make graphene nanoplatelets practical for industries that need performance improvement without fully changing existing material systems.
Demand is also supported by their use in conductive plastics, reinforced composites, sensors, energy storage parts, coatings, and flexible electronics. Research literature highlights graphene nanoplatelets as attractive materials because of their planar structure, high aspect ratio, electrical conductivity, low weight, and mechanical toughness. This supports their strong role in commercial graphene adoption.
Production Method Analysis
Chemical Vapor Deposition led the production method segment with a 40.4% share in 2025. The method is preferred where high-quality graphene films, better layer control, and improved electronic properties are required. It is especially important for electronics, photonics, sensors, transparent conductive films, and semiconductor-related applications.
CVD is gaining importance because it can support large-area graphene production and better compatibility with advanced device manufacturing. Research on CVD graphene shows that major efforts are focused on large-scale production, transfer to target substrates, and use in semiconductor-compatible process flows. This makes CVD a key production route for premium graphene applications.
Application Analysis
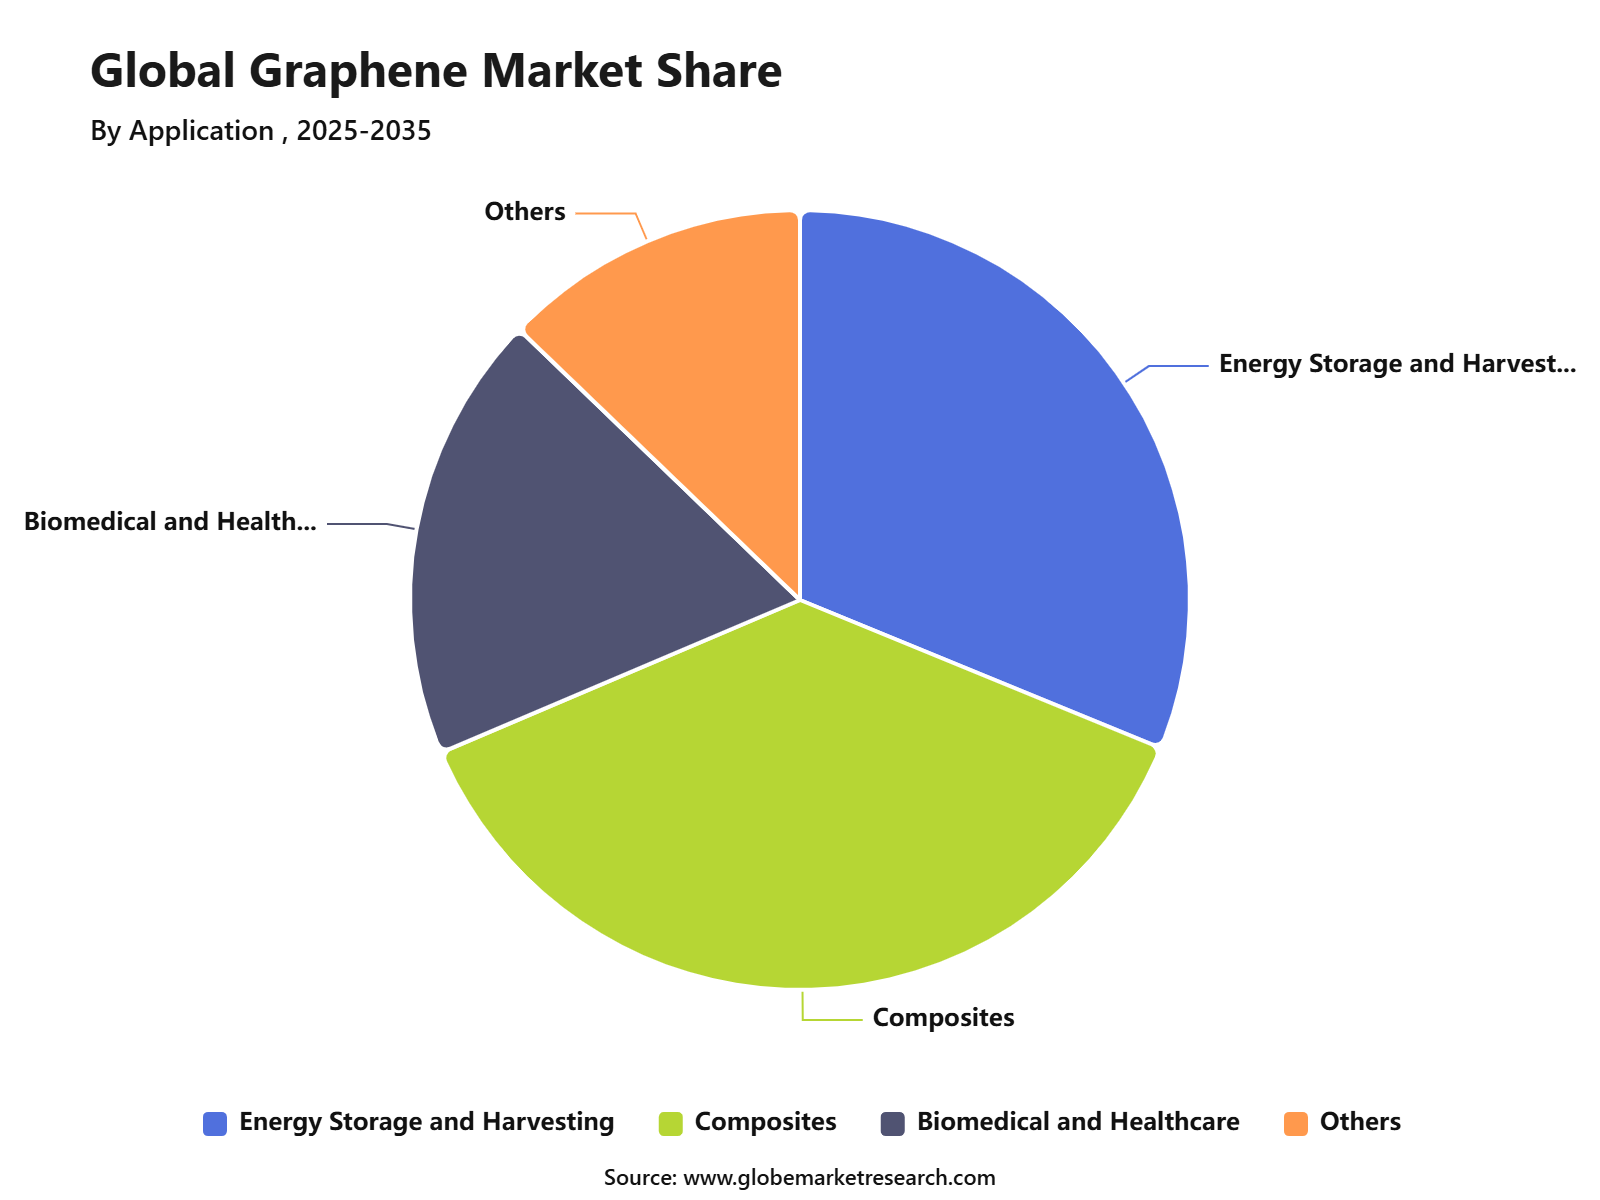
Composites accounted for a 37.4% share of the Graphene Market in 2025. Growth was supported by the use of graphene to improve strength, stiffness, electrical conductivity, thermal performance, and durability in polymer and industrial materials. These benefits are valuable in automotive, aerospace, construction, sports equipment, protective coatings, packaging, and electronics.
The segment is also supported by the ability of graphene to enhance existing materials at relatively low loading levels. The Graphene Flagship states that graphene-related materials can be used across wide composite and coating applications where material performance improvement is required. This makes composites one of the most practical and scalable application areas for graphene.
 iThe graph shows projected market growth until 2035 based on CAGR analysis. Actual outcomes may vary depending on changing demand, competition, and economic factors.To gain greater insights - request a sample report PDF
End-User Industry Analysis
Electronics and telecommunications led the end-user industry segment with a 55.4% share in 2025. Growth was supported by rising interest in graphene for sensors, flexible electronics, photonics, conductive films, high-speed devices, thermal management, and next-generation communication components. Graphene’s strong electrical conductivity and thin structure make it suitable for advanced electronic use cases.
The segment is also gaining support from research and industrial development in electronics and photonics. The Graphene Flagship roadmap identifies graphene and related materials as important for electronics and photonics applications. This supports continued adoption in areas where faster signal performance, lower energy loss, miniaturization, and flexible device design are important.
Regional Analysis
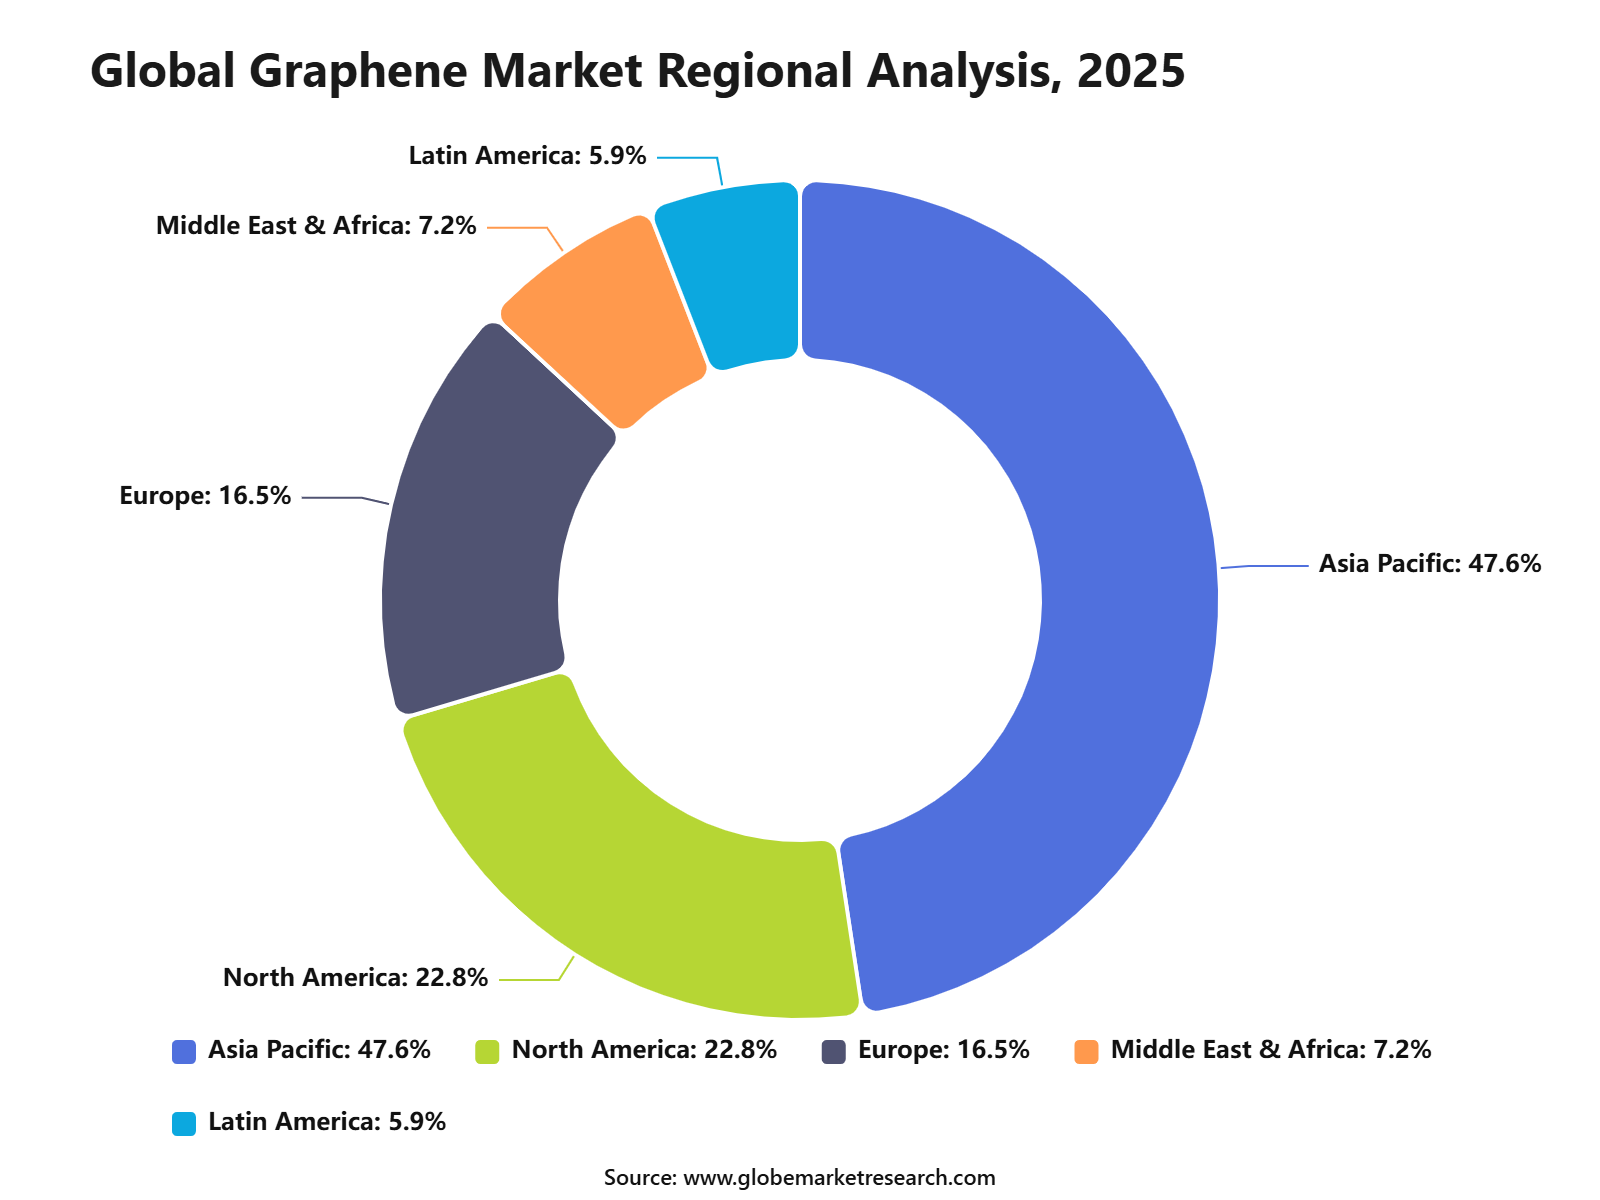
Asia Pacific led the Graphene Market with 47.6% share, supported by strong electronics manufacturing, battery production, material innovation, and industrial demand across China, Japan, South Korea, India, and Southeast Asia. The region has a large manufacturing base for electronics, automotive components, energy storage systems, and advanced materials.
Region | Market Share (%) |
|---|---|
Asia Pacific | 47.6% |
North America | 22.8% |
Europe | 16.5% |
Middle East & Africa | 7.2% |
Latin America | 5.9% |
The growth of Asia Pacific is also supported by rising investment in nanomaterials, clean energy technologies, electric vehicles, semiconductors, and high-performance composites. The region is expected to remain the leading market as industrial users continue to adopt graphene for electronics, coatings, batteries, composites, and thermal management applications.
 iThe graph shows projected market growth until 2035 based on CAGR analysis. Actual outcomes may vary depending on changing demand, competition, and economic factors.To gain greater insights - request a sample report PDF
Revenue Potential Analysis
Revenue Landscape Across
The revenue landscape for graphene is spread across energy storage, electronics, composites, coatings, conductive inks, membranes, thermal management, sensors, aerospace, automotive, and construction materials. Energy storage is the most visible opportunity because lithium-ion batteries need better conductivity, faster charging, thermal stability, and longer operating life. Graphene can be positioned as a performance enhancer in anodes, conductive additives, current collectors, supercapacitors, and thermal management layers. However, commercial success depends on customer validation, not only material performance claims.
Electronics and thermal management are also important revenue areas because graphene can support heat spreading, electromagnetic shielding, flexible electronics, sensors, and conductive films. Composite and coating applications can generate steady industrial demand where graphene improves strength, barrier protection, corrosion resistance, and weight reduction. The strongest revenue opportunities are expected where graphene is sold as part of a formulated solution, because customers can measure the value in the final product rather than judging graphene only by material cost.
Financial Impact
The financial impact is expected to be strongest for producers that can move beyond raw graphene powder and sell engineered grades for specific applications. Higher margins can be created through customized dispersions, masterbatches, coatings, battery additives, and application-ready formulations. Companies with strong quality systems, technical support, and customer qualification data are better placed to secure long-term supply agreements. This can reduce price pressure and improve customer retention.
Financial risk remains high because scale-up, compliance, testing, and customer approval can require large upfront investment before revenue becomes stable. Graphite supply risk also affects financial planning, as China’s strong position in graphite mining and processing creates exposure to export controls, tariffs, and logistics disruption. IEA reported that China supplied over 90% of anode active material production in 2024 and controlled a major share of graphite mining and refining.
Investment Opportunity Analysis
Impact Factor | Estimated CAGR Impact | Regional Relevance | Market Impact |
|---|---|---|---|
Graphene nanoplatelet production | +10.1% | Asia Pacific, Europe, North America | Offers volume growth. |
Battery-grade graphene materials | +9.6% | China, Japan, South Korea, U.S. | Supports energy transition. |
Graphene composites for mobility sectors | +8.8% | Automotive, aerospace, marine | Builds lightweight demand. |
High-purity graphene for electronics | +8.1% | Asia Pacific, U.S., Europe | Supports premium applications. |
Graphene coatings and membranes | +7.2% | Global industrial markets | Expands specialty revenue. |
Technology Adoption Analysis
Impact Factor | Estimated CAGR Impact | Regional Relevance | Market Impact |
|---|---|---|---|
Chemical vapor deposition technology | +9.8% | Asia Pacific, Europe, U.S. | Supports premium graphene output. |
Liquid phase exfoliation | +8.5% | Global | Improves scalable production. |
Graphene nanoplatelet production | +9.2% | Asia Pacific, North America, Europe | Supports bulk applications. |
Graphene-enhanced battery materials | +8.7% | China, Japan, South Korea, U.S. | Improves energy performance. |
Graphene-based sensor platforms | +7.4% | Healthcare, electronics, industrial monitoring | Enables advanced sensing. |
Segment covered in the Report
By Product Type
Nanoplatelets
Graphene Sheets and Films
Others
By Production Method
Chemical Vapor Deposition
Liquid-Phase Exfoliation
Thermal Exfoliation
Chemical Exfoliation
Electrochemical Exfoliation
Methane Pyrolysis
By Application
Energy Storage and Harvesting
Composites
Biomedical and Healthcare
Others
By End-User Industry
Electronics and Telecommunications
Biomedical and Healthcare
Others
By Region
Asia Pacific
North America
Europe
Middle East & Africa
Latin America
Drivers Impact Analysis
Impact Factor | Estimated CAGR Impact | Regional Relevance | Market Impact |
|---|---|---|---|
Rising demand for graphene in electronics | +10.6% | Asia Pacific, North America, Europe | Drives advanced material adoption. |
Growth in battery and energy storage applications | +9.8% | China, Japan, South Korea, U.S., Europe | Supports high-value demand. |
Increasing use in composites and lightweight materials | +8.9% | Automotive, aerospace, marine, construction | Improves strength and durability. |
Expansion of semiconductor and sensor applications | +8.1% | Asia Pacific, U.S., Europe | Supports next-generation devices. |
Rising investment in nanomaterials | +7.4% | China, India, Japan, U.S., Germany | Accelerates commercialization. |
Restraints Impact Analysis
Impact Factor | Estimated CAGR Impact | Regional Relevance | Market Impact |
|---|---|---|---|
High production cost | -5.0% | Global | Limits mass adoption. |
Scale-up challenges in commercial production | -4.6% | North America, Europe, Asia Pacific | Slows volume supply. |
Quality inconsistency across graphene grades | -4.0% | Global | Affects application reliability. |
Limited standardization | -3.5% | Global | Delays industrial acceptance. |
Complex integration into existing materials | -3.1% | Automotive, electronics, energy storage | Raises adoption barriers. |
Opportunities Impact Analysis
Impact Factor | Estimated CAGR Impact | Regional Relevance | Market Impact |
|---|---|---|---|
Expansion in lithium-ion and next-gen batteries | +10.4% | China, South Korea, Japan, U.S., Europe | Creates strong energy demand. |
Growth in graphene nanoplatelets | +9.5% | Asia Pacific, Europe, North America | Supports composite applications. |
Adoption in flexible electronics | +8.7% | Asia Pacific, U.S., Europe | Opens device innovation. |
Graphene use in coatings and membranes | +7.8% | Global industrial markets | Expands application scope. |
Development of conductive inks and sensors | +7.1% | Electronics and healthcare sectors | Builds specialty demand. |
Recent Developments
April 2026: The European Commission approved a €211 million Italian State aid measure to support graphene-based photonic optical transceivers by CamGraPhIC. The project will be carried out in Pisa and Bergamo and is expected to support applications in automotive, telecommunications, aerospace, and defence. This development shows rising public funding support for graphene in next-generation chips and AI data infrastructure.
April 2026: Graphene Manufacturing Group announced progress on its Gen 2.0 Graphene Production Project in Richlands, Queensland. The project is expected to produce at least 10 tonnes per year of graphene, with future expansion plans in Australia and North America. This supports rising commercial demand for graphene coatings, lubricants, battery additives, and aluminium-ion batteries.
Report Scope
Report Highlights | Details |
|---|---|
Market Revenue (2025) | USD 3.6 Billion |
Forecast Revenue (2035) | USD 113.5 Billion |
CAGR (2025-2035) | 41.2% |
Base Year for Estimation | 2025 |
Historic Data | 2020-2024 |
Forecast Period | 2025-2035 |
Report Coverage | AI market impact analysis, market surveys, trade analysis, Industry & competitive intelligence, Revenue projections, company positioning, competitive analysis, growth drivers, and emerging market trends, Strategic Consultation & Advisory Services |
Segments Covered | By Product Type (Nanoplatelets, Graphene Sheets and Films, and Others), By Production Method (Chemical Vapor Deposition, Liquid-Phase Exfoliation, Thermal Exfoliation, Chemical Exfoliation, Electrochemical Exfoliation, Methane Pyrolysis), By Application (Energy Storage and Harvesting, Composites, Biomedical and Healthcare and Others), By End-User Industry (Electronics and Telecommunications, Biomedical and Healthcare, and Others) |
Regional Analysis | North America - US, Canada; Europe - Germany, France, The UK, Spain, Italy, Russia, Netherlands, Rest of Europe; Asia Pacific - China, Japan, South Korea, India, New Zealand, Singapore, Thailand, Vietnam, Rest of Latin America; Latin America - Brazil, Mexico, Rest of Latin America; Middle East & Africa - South Africa, Saudi Arabia, UAE, Rest of MEA |
Key companies profiled | Graphenea S.A., Haydale Graphene Industries plc, Versarien plc, Grafoid Inc., XG Sciences, Applied Graphene Materials Plc, G6 Materials Corp., NanoXplore Inc., Directa Plus plc, Talga Resources Ltd, Graphene NanoChem plc, Angstron Materials Inc., Vorbeck Materials Corp., Applied Nanotech Inc., NanoMaterials Ltd. |
Customization Scope | Tailored insights for specific regions, countries, and market segments can be provided. Additional report customization is available upon request. |
Competitive Landscape
The market is characterized by intense competition among established players and emerging companies. Strategic partnerships, mergers and acquisitions, and product innovation are key strategies employed by market participants.
Key Market Players
Graphenea S.A.
Haydale Graphene Industries plc
Versarien plc
Grafoid Inc
XG Sciences
Applied Graphene Materials Plc
G6 Materials Corp.
NanoXplore Inc.
Directa Plus plc
Talga Resources Ltd
Graphene NanoChem plc
Angstron Materials Inc.
Vorbeck Materials Corp.
Applied Nanotech Inc.
NanoMaterials Ltd.
Meet the Team
This report was prepared by our expert analysts with deep industry knowledge and research experience.
Pratiksha is market research analyst with strong experience in industry research, market forecasting, and competitive analysis. She specializes in identifying market trends, evaluating growth opportunities, and preparing data-driven insights across global industries. Her work supports businesses in understanding market dynamics, customer demand, regional opportunities, and strategic investment areas.
Sayali brings more than 5 years of experience to Globe Market Research, supporting the accuracy, clarity, and relevance of research content across multiple industries. She reviews market data, segment analysis, competitive insights, and industry trends to ensure each report meets strong quality standards and provides practical value to business decision-makers. Her expertise spans healthcare, information technology, consumer goods, and diverse cross-industry domains. With a strong focus on data reliability, structured analysis, and clear presentation, Sayali helps ensure that each research output delivers well-reviewed insights for clients, investors, consultants, and industry stakeholders.
Frequently Asked Questions
Related Reports
More in Chemical and Material
Oxygen Market to Exceed USD 171.1 Billion by 2035
Global Oxygen Market Size, Share Analysis By Form (Gas, Liquid, Solid), By Type (Industrial, Medical), By Application (Metals and Mining, Chemical Industry, Oil and Gas, Healthcare, Pharmaceutical, Other Applications), By Regional Insights, Business plan and Project Report, Investment Opportunities, Profitability, Industry Trends, Leading Companies and Growth Forecasts by 2025-2035
Tannin Market to Hit USD 9.8 Billion by 2035
Global Tannin Market Size, Share and Go-to-Market Strategy Analysis By Source (Plant, Brown Algae), By Product Type (Hydrolysable Tannins, Condensed Tannins, Phlorotannins, Others), By Application (Food and Beverage, Pharmaceutical and Nutraceutical, Leather Industry, Wood Industry, Others), By Regional Insights, Business plan and Project Report, Investment Opportunities, Profitability, Industry Trends, Leading Companies and Growth Forecasts by 2025-2035
Printing Ink Market to Hit USD 30.6 Billion by 2035
Global Printing Ink Market Size, Go-to-Market Strategy Analysis By Type (Solvent-Based, Water-Based, Oil-Based, UV, UV-LED, Others), By Process (Lithographic Printing, Flexographic Printing, Gravure Printing, Digital Printing, Others), By Application (Packaging, Commercial and Publication, Textiles, Others), By Regional Insights, Business plan and Project Report, Investment Opportunities, Profitability, Industry Trends, Leading Companies and Growth Forecasts by 2025-2035
Methanol Market to Exceed USD 64.1 Billion by 2035
Global Methanol Market Size By Feedstock (Natural Gas, Coal, Biomass and Renewables), By Derivative (Formaldehyde, Acetic Acid, MTBE, DME, Gasoline Blending, Biodiesel, MTO/MTP, Solvent, Others), By Sub-derivatives (Gasoline additives, Olefins, UF/PF resins, VAM, Polyacetals, MDI, PTA, Acetate Esters, Acetic anhydride, Fuels, Others), By Application (Construction, Automotive, Electronics, Others), By Regional Insights, Business plan and Project Report, Investment Opportunities, Profitability, Industry Trends, Leading Companies and Growth Forecasts by 2025-2035