

Revenue, 2025
$ 39.7 Bn
Forecast, 2035
$ 64.1 Bn
CAGR, 2025-2035
4.9%
Report Coverage
Global
Market Size and Forecast
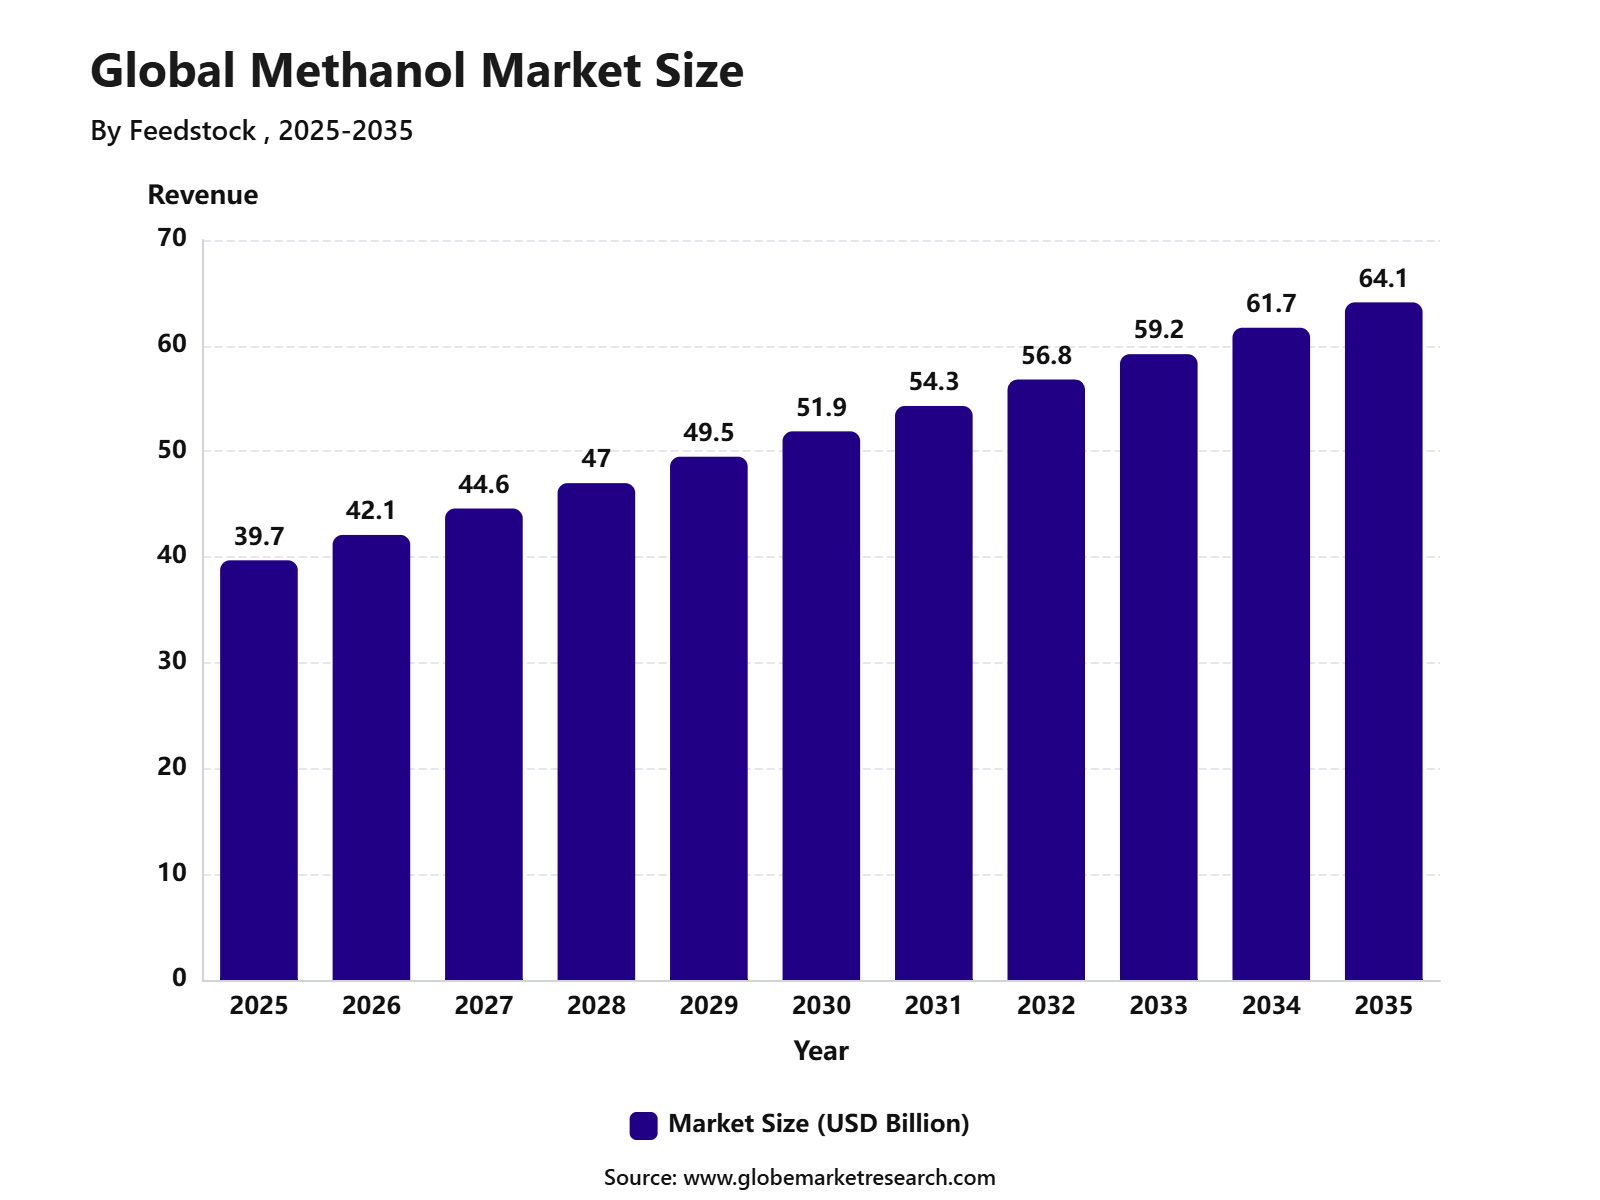
The Global Methanol Market was valued at USD 39.7 billion in 2025 and is projected to reach USD 64.1 billion by 2035, growing at a CAGR of 4.9% from 2025 to 2035. Asia Pacific held the largest regional share of 70.8% in 2025, supported by strong demand from chemical manufacturing, fuel blending, plastics, adhesives, paints, coatings, and construction-related applications.
Methanol is a key industrial chemical used in the production of formaldehyde, acetic acid, methyl tert-butyl ether, dimethyl ether, olefins, and several downstream chemical products. The growth of the market can be attributed to increasing use of methanol in petrochemicals, rising demand for cleaner fuel alternatives, and expanding applications in energy and transportation sectors.
The market outlook remains stable as industries continue to use methanol as a cost-effective feedstock for chemicals and fuel-related applications. Asia Pacific is expected to maintain its leading position due to large manufacturing capacity, strong demand from China and India, expanding petrochemical production, and rising use of methanol in industrial and energy applications.
 iThe graph shows projected market growth until 2035 based on CAGR analysis. Actual outcomes may vary depending on changing demand, competition, and economic factors.To gain greater insights - request a sample report PDF
Key Market Insights
Natural gas led the feedstock segment with 60.2% share, supported by its wide availability, cost efficiency, and strong use in large-scale methanol production.
MTO and MTP accounted for 39.7% share by derivative, driven by rising demand for methanol-to-olefins and methanol-to-propylene processes in chemical manufacturing.
Olefins held 25.5% share by sub-derivative, supported by their use in plastics, packaging materials, synthetic fibers, and industrial chemicals.
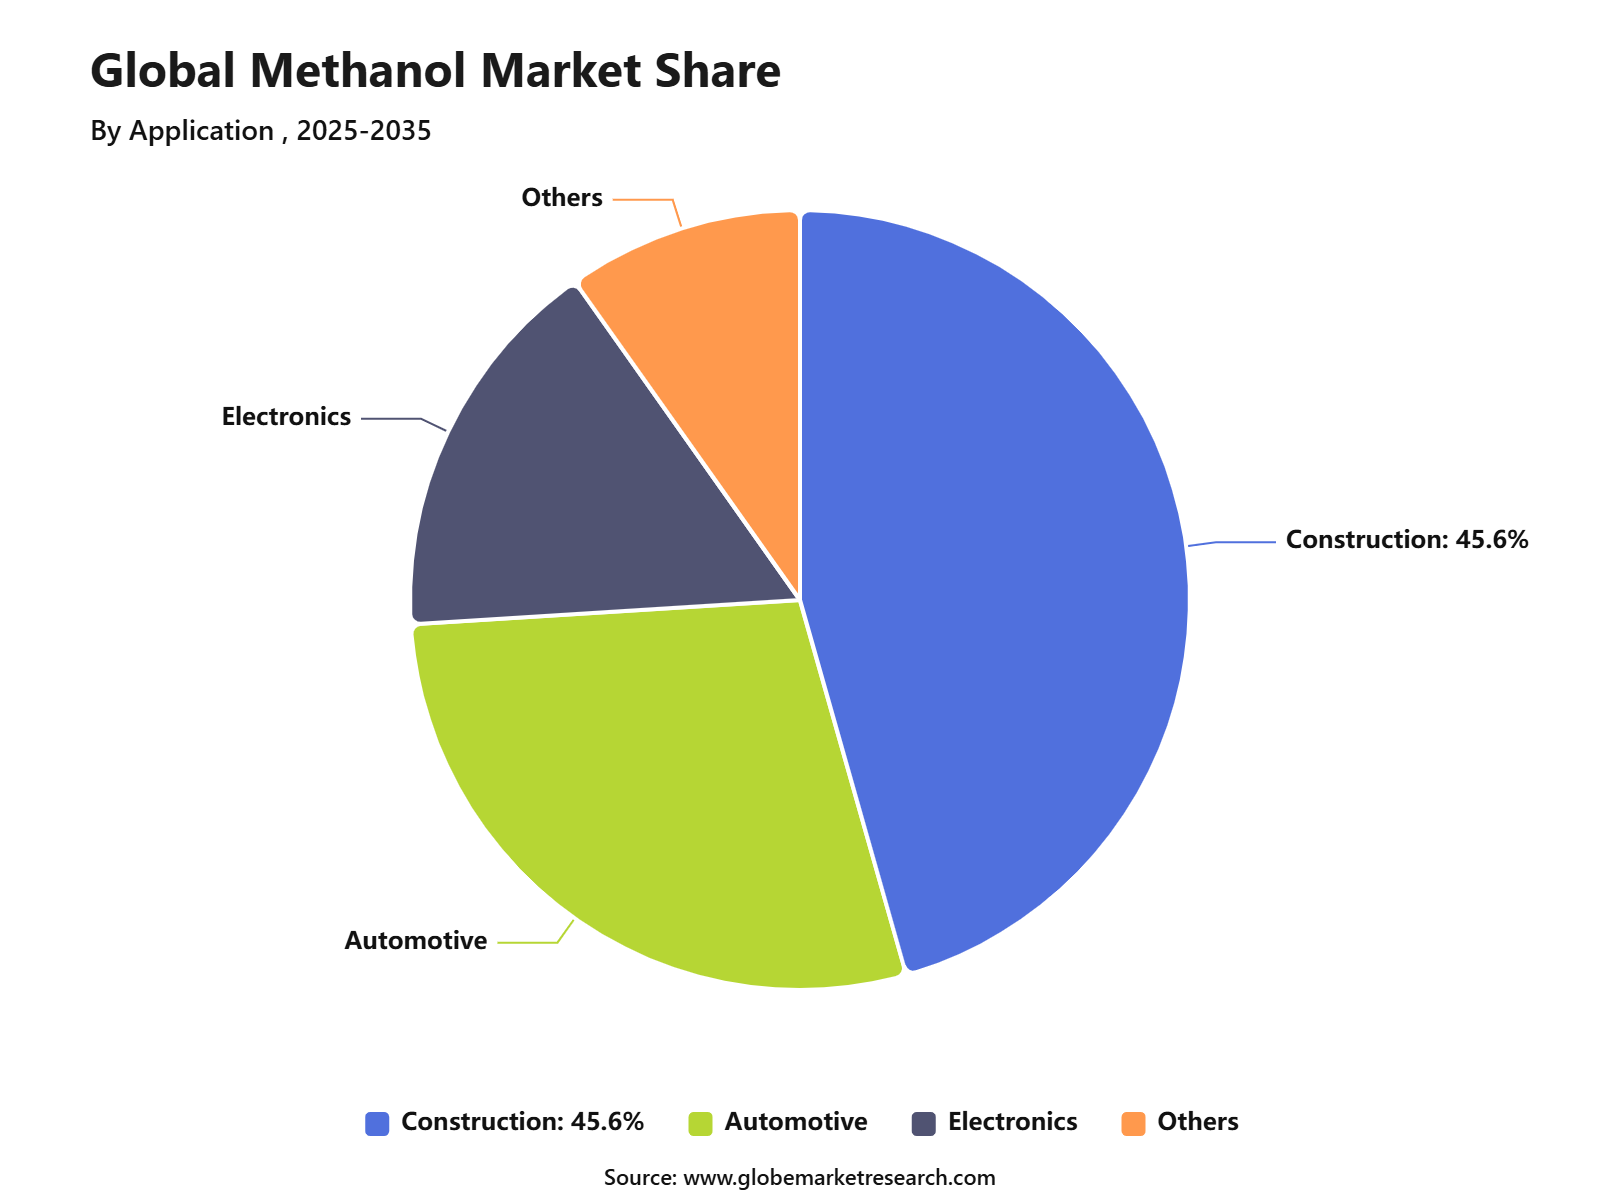
Construction captured 45.6% share by application, driven by methanol-based derivatives used in adhesives, paints, coatings, insulation materials, and construction chemicals.
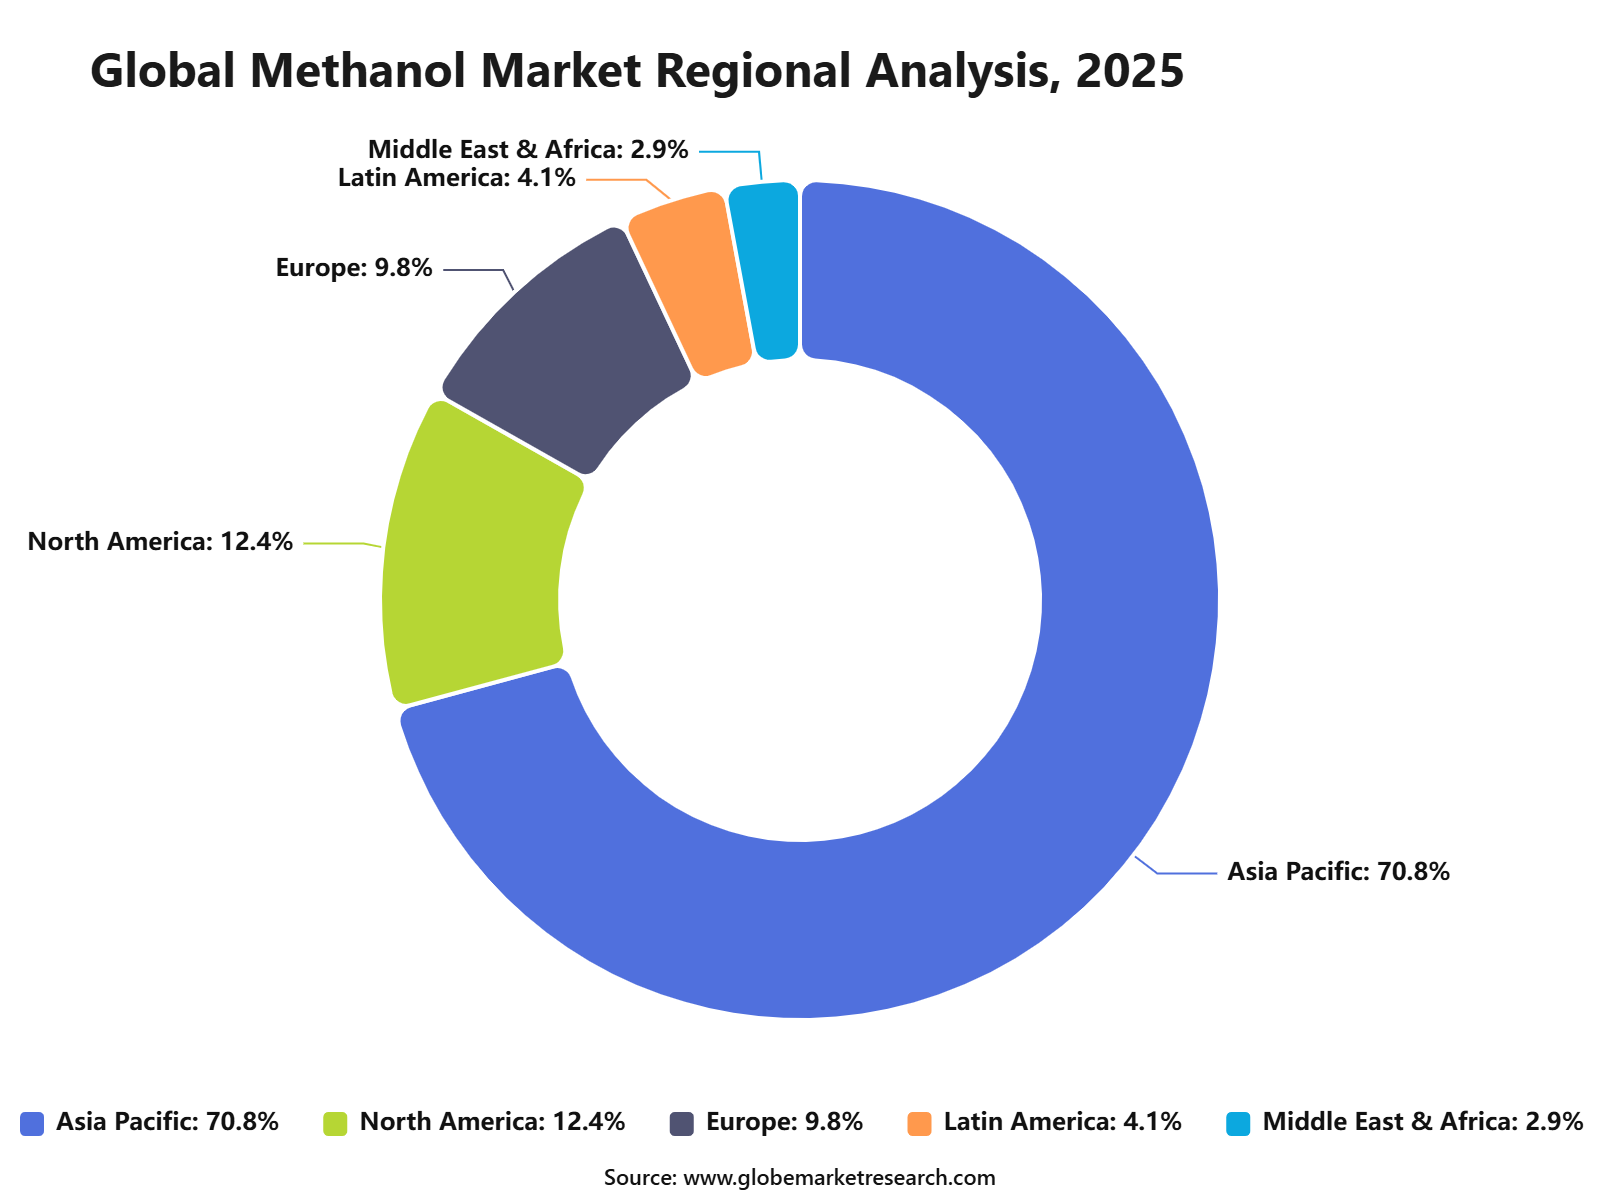
Asia Pacific led the methanol market with 70.8% share, supported by strong chemical production, high industrial demand, expanding construction activity, and large methanol consumption across China and other regional economies.
Go-to-Market and Sales Economics
The Methanol Market needs an end-use-led go-to-market strategy because methanol is used both as a chemical building block and as an energy product. Suppliers should target formaldehyde, acetic acid, methylamines, MTBE, DME, biodiesel, solvents, olefins, plastics, paints, construction materials, fuel blending, marine fuel, and clean-fuel applications. The Methanol Institute states that worldwide methanol capacity is about 110 million metric tons across more than 90 plants, which shows that methanol is already a large and established global chemical platform.
Sales economics are strongly linked to feedstock cost, especially natural gas, coal, and captured carbon routes for renewable methanol. In the U.S., EIA reported that the Henry Hub natural gas spot price averaged USD 2.94 per MMBtu in May 2026, up from April, which matters because gas-based methanol producers are exposed to gas price movement. Suppliers with access to low-cost gas, integrated production, export terminals, and long-term offtake contracts are better positioned to protect margins.
Tariff Impact
Tariff impact in the Methanol Market depends on HS classification, country of origin, end use, and destination market. In the U.S., methanol is classified under HTS 2905.11, and the USITC tariff schedule lists methanol imported for synthetic natural gas use or direct fuel use with a rate of 4.8 cents per liter. This makes customs classification important because methanol may be imported for chemical production, fuel use, blending, or industrial applications.
For buyers, tariff risk is not limited to the base duty rate. It can also come from country-specific trade actions, sanctions exposure, freight disruptions, port costs, and changes in energy security policy. Methanol is globally traded, with 2024 leading exporters including Trinidad and Tobago at USD 1.85 billion, Oman at USD 1.6 billion, and Saudi Arabia at USD 1.49 billion, according to OEC data updated in June 2026. This trade concentration makes landed cost sensitive to shipping routes, Middle East supply stability, and regional import rules.
Risk Factors & Market Barriers
The main risk factor is feedstock and energy price volatility. Methanol production can depend on natural gas, coal, biomass, renewable power, captured CO₂, and hydrogen, so cost structures vary widely by region. When gas, coal, electricity, or carbon prices rise, producers may face pressure if downstream buyers cannot absorb higher costs. This is especially important for buyers in formaldehyde, acetic acid, resins, plastics, and fuel blending, where methanol is a major input cost.
Another barrier is the supply gap between conventional methanol and low-carbon methanol. The Methanol Institute reported that, as of March 2026, its renewable methanol database tracked 263 projects globally, with announced anticipated capacity of 48.5 million tons by 2031, including 23.8 million tons of e-methanol and 24.7 million tons of biomethanol. This shows strong project momentum, but many projects still need final investment decisions, renewable power, biomass supply, CO₂ sourcing, electrolyzers, and long-term buyers.
Revenue Potential Analysis
Revenue Landscape Across
The revenue landscape for methanol is spread across formaldehyde, acetic acid, MTBE, DME, olefins, biodiesel, solvents, fuel blending, marine fuel, clean fuels, adhesives, engineered wood products, coatings, plastics, and construction materials. Chemical demand remains the foundation because methanol is a base input for many everyday products, while energy demand is adding new growth routes through shipping, road fuel blending, fuel cells, and industrial boilers. The strongest opportunities are expected where methanol supports both chemical value chains and energy transition needs.
Marine fuel is becoming a more visible revenue area. Equinor signed a two-year agreement in 2026 to supply bio-methanol to Wallenius Wilhelmsen at the Belgian ports of Zeebrugge and Antwerp, with deliveries planned later in the year. Maersk also has long-term bio-methanol supply arrangements beginning in 2026, showing that shipowners are moving from trials to commercial fuel procurement.
Financial Impact
The financial impact can be positive for producers with low-cost feedstock, integrated logistics, export access, and exposure to both chemical and fuel markets. Conventional methanol producers can benefit from stable demand in formaldehyde, acetic acid, olefins, and resins, while renewable methanol producers can target premium buyers in shipping, consumer goods, and low-carbon chemicals. Better margins are expected where suppliers provide certified low-carbon methanol, long-term offtake, and reliable port delivery.
Financial risk remains linked to feedstock volatility, carbon policy uncertainty, project financing, technology scale-up, and competition from ethanol, LNG, ammonia, biodiesel, and hydrogen-based fuels. Reuters reported that ethanol is now being tested in methanol-ready engines, including Maersk trials using 100% ethanol, which shows that methanol must compete with other scalable alternative fuels. The strongest financial resilience is expected from companies that secure feedstock, prove lifecycle emissions, diversify customers, and build contracts with price-adjustment mechanisms.
Feedstock Analysis
Natural gas led the Methanol Market feedstock segment with 60.2% share, supported by its wide use in conventional methanol production. Natural gas is converted into synthesis gas and then processed into methanol, making it a preferred feedstock in regions with stable gas availability and developed petrochemical infrastructure.
The growth of this segment can be attributed to the need for reliable, large-scale, and cost-efficient methanol production. Natural gas-based methanol plants are widely used because they offer strong process efficiency and support demand from chemicals, fuels, plastics, and industrial applications.
Derivative Analysis
MTO/MTP led the derivative segment with 39.7% share, supported by rising demand for methanol-based routes to olefins and propylene. These processes allow methanol to be converted into important petrochemical building blocks used in plastics, packaging, fibers, automotive parts, and consumer goods.
The segment is gaining importance because it provides an alternative route to olefin production, especially in regions with strong methanol supply and high petrochemical demand. MTO and MTP plants are expected to remain important where producers aim to strengthen feedstock flexibility and reduce dependence on traditional naphtha-based production routes.
Sub-Derivatives Analysis
Olefins accounted for 25.5% share in the Methanol Market sub-derivatives segment, supported by their broad use in plastics, synthetic rubber, packaging materials, fibers, solvents, and industrial chemicals. Ethylene and propylene are key olefins produced through methanol-based conversion routes.
The growth of this segment is linked to strong demand from packaging, construction, automotive, textiles, and consumer goods industries. Olefins remain essential building blocks for many downstream products, which supports steady demand for methanol as an upstream chemical input.
Application Analysis
Construction led the application segment with 45.6% share, supported by the use of methanol derivatives in resins, adhesives, paints, coatings, insulation materials, plastics, laminates, and engineered wood products. Methanol-derived formaldehyde is especially important in construction-related materials such as plywood, particle board, and fiberboard resins.
The segment is supported by infrastructure development, residential construction, commercial building activity, and demand for durable building materials. Methanol-based chemicals help improve bonding strength, surface protection, product durability, and material performance across several construction applications.
 iThe graph shows projected market growth until 2035 based on CAGR analysis. Actual outcomes may vary depending on changing demand, competition, and economic factors.To gain greater insights - request a sample report PDF
Regional Analysis
Asia Pacific held the leading regional share of 70.8%, supported by strong chemical manufacturing activity, large petrochemical demand, and high methanol consumption across China, India, Japan, South Korea, and Southeast Asia. The region has a large base of downstream industries, including plastics, construction materials, textiles, automotive components, and packaging.
The region is expected to remain dominant because of its strong industrial base and large-scale methanol-to-olefins activity. China remains a major center for methanol-based chemical production, while broader Asia Pacific demand is supported by construction growth, manufacturing expansion, and rising consumption of methanol-derived products.
 iThe graph shows projected market growth until 2035 based on CAGR analysis. Actual outcomes may vary depending on changing demand, competition, and economic factors.To gain greater insights - request a sample report PDF
Regional Impact Analysis
Impact Factor | Estimated CAGR Impact | Regional Relevance | Market Impact |
|---|---|---|---|
Asia Pacific market leadership | +2.0% | Asia Pacific, 70.8% share in 2025 | Leads production and demand. |
China MTO demand strength | +1.4% | China | Drives regional consumption. |
North America natural gas-based production | +0.7% | U.S. and Canada | Supports feedstock advantage. |
Europe green methanol adoption | +0.6% | Germany, Netherlands, Nordics | Supports cleaner supply. |
Middle East export capacity growth | +0.5% | Saudi Arabia, Qatar, Oman, UAE | Strengthens global supply. |
Market Trend Analysis
Impact Factor | Estimated CAGR Impact | Regional Relevance | Market Impact |
|---|---|---|---|
Methanol-to-olefins growth | +1.2% | Asia Pacific, especially China | Drives major consumption. |
Shift toward low-carbon methanol | +0.9% | Europe, Japan, South Korea, China | Supports cleaner supply. |
Marine methanol fuel adoption | +0.8% | Global shipping routes | Expands fuel applications. |
Coal-to-methanol production strength | +0.7% | China and Asia Pacific | Supports regional supply. |
Downstream derivative expansion | +0.6% | Global | Increases chemical demand. |
Investor Type Impact Matrix
Investor Type | Estimated CAGR Impact | Regional Relevance | Market Impact |
|---|---|---|---|
Chemical Producers | +1.2% | Global | Expands methanol capacity. |
Energy and Fuel Companies | +0.9% | Asia Pacific, Europe, Middle East | Supports fuel applications. |
Green Fuel Investors | +0.8% | Europe, North America, Japan, China | Funds low-carbon methanol. |
Private Equity Firms | +0.6% | Asia Pacific, Europe, North America | Supports asset scaling. |
Shipping and Port Investors | +0.5% | Global maritime hubs | Enables marine fuel use. |
Segment covered in the Report
By Feedstock
Natural Gas
Coal
Biomass and Renewables
By Derivative
Formaldehyde
Acetic Acid
MTBE
DME
Gasoline Blending
Biodiesel
MTO/MTP
Solvent
Others
By Sub-derivatives
Gasoline additives
Olefins
UF/PF resins
VAM
Polyacetals
MDI
PTA
Acetate Esters
Acetic anhydride
Fuels
Others
By Application
Construction
Automotive
Electronics
Others
By Region
Asia Pacific
North America
Europe
Middle East & Africa
Latin America
Drivers Impact Analysis
Impact Factor | Estimated CAGR Impact | Regional Relevance | Market Impact |
|---|---|---|---|
Rising demand from chemical production | +1.3% | Asia Pacific, North America, Europe | Drives core methanol use. |
Growth in methanol-to-olefins applications | +1.1% | China and broader Asia Pacific | Supports downstream demand. |
Increasing use in construction materials | +0.9% | Asia Pacific, Middle East, North America | Expands derivative consumption. |
Demand from automotive fuel blending | +0.7% | China, India, Europe | Supports alternative fuel use. |
Growth in formaldehyde and acetic acid production | +0.6% | Global | Strengthens industrial demand. |
Restraints Impact Analysis
Impact Factor | Estimated CAGR Impact | Regional Relevance | Market Impact |
|---|---|---|---|
Feedstock price volatility | -0.8% | Natural gas and coal-based regions | Pressures production margins. |
Carbon emission concerns | -0.7% | Europe, North America, China | Raises compliance pressure. |
Methanol price fluctuations | -0.6% | Global | Creates buyer uncertainty. |
Safety and toxicity handling risks | -0.5% | Global industrial users | Increases compliance needs. |
Competition from alternative chemicals | -0.4% | Developed markets | Limits substitution demand. |
Opportunities Impact Analysis
Impact Factor | Estimated CAGR Impact | Regional Relevance | Market Impact |
|---|---|---|---|
Growth in green methanol production | +1.1% | Europe, North America, China, Japan | Supports low-carbon demand. |
Expansion of marine fuel applications | +0.9% | Europe, Asia Pacific, global shipping hubs | Opens fuel market growth. |
Rising demand for olefins and polymers | +0.8% | Asia Pacific | Strengthens downstream use. |
Investment in renewable methanol projects | +0.7% | Europe, China, Middle East | Builds future supply. |
Use in hydrogen carrier applications | +0.6% | Japan, South Korea, Europe | Supports clean energy use. |
Challenges Impact Analysis
Impact Factor | Estimated CAGR Impact | Regional Relevance | Market Impact |
|---|---|---|---|
Managing carbon intensity | -0.7% | Global producers | Requires cleaner production. |
Dependence on fossil feedstocks | -0.6% | Asia Pacific, Middle East, North America | Raises transition risk. |
Supply-demand imbalance risk | -0.5% | Global | Affects pricing stability. |
High cost of green methanol | -0.5% | Europe, North America, Asia Pacific | Slows adoption speed. |
Regulatory pressure on chemical emissions | -0.4% | U.S., Europe, China | Increases operating burden. |
Recent Developments
In May 2026, the World Shipping Council reported that the global liner shipping sector had 1,204 dual-fuel container ships and vehicle carriers, up 28% year over year. Of these, 440 ships were already operating, rising from 267 in March 2025, while 764 additional ships were on order. The Council also noted that future container ship fuel demand is led by methane and methanol dual-fuel orders, which supports rising methanol bunker demand.
In March 2026, the Methanol Institute reported strong expansion in the renewable methanol project pipeline. Its database tracked 263 renewable methanol projects globally, with announced capacity of 48.5 million tonnes by 2031, including 23.8 million tonnes of e-methanol and 24.7 million tonnes of biomethanol capacity. Another 18 low-carbon methanol projects represented 11.2 million tonnes of capacity, taking the total renewable and low-carbon pipeline to 59.6 million tonnes by 2031.
Report Scope
Report Highlights | Details |
|---|---|
Market Revenue (2025) | USD 39.7 Billion |
Forecast Revenue (2035) | USD 64.1 Billion |
CAGR (2025-2035) | 4.9% |
Base Year for Estimation | 2025 |
Historic Data | 2020-2024 |
Forecast Period | 2025-2035 |
Report Coverage | AI market impact analysis, market surveys, trade analysis, Industry & competitive intelligence, Revenue projections, company positioning, competitive analysis, growth drivers, and emerging market trends, Strategic Consultation & Advisory Services |
Segments Covered | By Feedstock (Natural Gas, Coal, Biomass and Renewables), By Derivative (Formaldehyde, Acetic Acid, MTBE, DME, Gasoline Blending, Biodiesel, MTO/MTP, Solvent, Others), By Sub-derivatives (Gasoline additives, Olefins, UF/PF resins, VAM, Polyacetals, MDI, PTA, Acetate Esters, Acetic anhydride, Fuels, Others), By Application (Construction, Automotive, Electronics, Others) |
Regional Analysis | North America - US, Canada; Europe - Germany, France, The UK, Spain, Italy, Russia, Netherlands, Rest of Europe; Asia Pacific - China, Japan, South Korea, India, New Zealand, Singapore, Thailand, Vietnam, Rest of Latin America; Latin America - Brazil, Mexico, Rest of Latin America; Middle East & Africa - South Africa, Saudi Arabia, UAE, Rest of MEA |
Key companies profiled | Methanex Corporation, SABIC, Proman AG, Zagros Petrochemical Company, PETRONAS Chemicals Group Berhad, BASF SE, Mitsui & Co., Ltd., Celanese Corporation |
Customization Scope | Tailored insights for specific regions, countries, and market segments can be provided. Additional report customization is available upon request. |
Competitive Landscape
The market is characterized by intense competition among established players and emerging companies. Strategic partnerships, mergers and acquisitions, and product innovation are key strategies employed by market participants.
Key Market Players
Methanex Corporation
SABIC
Proman AG
Zagros Petrochemical Company
PETRONAS Chemicals Group Berhad
BASF SE
Mitsui & Co., Ltd.
Celanese Corporation
Meet the Team
This report was prepared by our expert analysts with deep industry knowledge and research experience.
Pratiksha is market research analyst with strong experience in industry research, market forecasting, and competitive analysis. She specializes in identifying market trends, evaluating growth opportunities, and preparing data-driven insights across global industries. Her work supports businesses in understanding market dynamics, customer demand, regional opportunities, and strategic investment areas.
Sayali brings more than 5 years of experience to Globe Market Research, supporting the accuracy, clarity, and relevance of research content across multiple industries. She reviews market data, segment analysis, competitive insights, and industry trends to ensure each report meets strong quality standards and provides practical value to business decision-makers. Her expertise spans healthcare, information technology, consumer goods, and diverse cross-industry domains. With a strong focus on data reliability, structured analysis, and clear presentation, Sayali helps ensure that each research output delivers well-reviewed insights for clients, investors, consultants, and industry stakeholders.
Frequently Asked Questions
Related Reports
More in Chemical and Material
Oxygen Market to Exceed USD 171.1 Billion by 2035
Global Oxygen Market Size, Share Analysis By Form (Gas, Liquid, Solid), By Type (Industrial, Medical), By Application (Metals and Mining, Chemical Industry, Oil and Gas, Healthcare, Pharmaceutical, Other Applications), By Regional Insights, Business plan and Project Report, Investment Opportunities, Profitability, Industry Trends, Leading Companies and Growth Forecasts by 2025-2035
Tannin Market to Hit USD 9.8 Billion by 2035
Global Tannin Market Size, Share and Go-to-Market Strategy Analysis By Source (Plant, Brown Algae), By Product Type (Hydrolysable Tannins, Condensed Tannins, Phlorotannins, Others), By Application (Food and Beverage, Pharmaceutical and Nutraceutical, Leather Industry, Wood Industry, Others), By Regional Insights, Business plan and Project Report, Investment Opportunities, Profitability, Industry Trends, Leading Companies and Growth Forecasts by 2025-2035
Printing Ink Market to Hit USD 30.6 Billion by 2035
Global Printing Ink Market Size, Go-to-Market Strategy Analysis By Type (Solvent-Based, Water-Based, Oil-Based, UV, UV-LED, Others), By Process (Lithographic Printing, Flexographic Printing, Gravure Printing, Digital Printing, Others), By Application (Packaging, Commercial and Publication, Textiles, Others), By Regional Insights, Business plan and Project Report, Investment Opportunities, Profitability, Industry Trends, Leading Companies and Growth Forecasts by 2025-2035
Xylose Market to hit USD 7.0 Billion by 2035
Global Xylose Market Size By Type (D-Xylose, L-Xylose, DL-Xylose), By Form (Powder, Liquid, Granules), By Source (Wood, Corncobs, Sugarcane Bagasse, Others), By Application (Food and Beverage, Cosmetics and Personal Care, Animal Feed, Pharmaceuticals, Biofuel Industry, Others) , By Regional Insights, Business plan and Project Report, Investment Opportunities, Profitability, Industry Trends, Leading Companies and Growth Forecasts by 2025-2035