

Revenue, 2025
USD 2.3 Bn
Forecast, 2035
USD 55.2 Bn
CAGR, 2025-2035
37.4%
Report Coverage
Global
Market Size and Forecast
The Global Recycling Chemicals Market was worth USD 2.3 billion in 2025 and is expected to reach USD 55.2 billion by 2035, growing at a CAGR of 37.4% from 2025 to 2035. Based on this growth rate, the market is estimated to reach around USD 7.6 billion in 2026. North America held the largest regional share of 37.1% in 2025, valued at around USD 0.8 billion, supported by advanced recycling infrastructure, plastic waste reduction policies, circular economy investment, and growing demand for recycled polymers.
The Recycling Chemicals Market includes specialty chemicals, solvents, catalysts, additives, depolymerization agents, purification chemicals, and process aids used to recover value from plastic, rubber, textile, metal, and electronic waste streams. These chemicals help improve material separation, polymer breakdown, contaminant removal, and recycled material quality. The market is closely linked with chemical recycling, plastic circularity, sustainable packaging, and industrial waste recovery.
Key Parameter | Report Details |
|---|---|
Market Revenue, 2025 | USD 2.3 Billion |
Projected Revenue, 2035 | USD 55.2 Billion |
CAGR (2025-2035) | 37.4% |
Largest Region | North America (37.1%, USD 0.8 Bn) |
Fastest Growing Region | Asia Pacific |
Market Concentration | Medium |
Base Year | 2024 |
Forecast Period | 2025-2035 |
The market outlook remains strong as companies shift from mechanical recycling alone toward advanced chemical recycling technologies. Growth can be attributed to rising plastic waste volumes, stronger brand commitments for recycled content, and increasing investment in technologies that convert waste into reusable feedstocks. North America’s strong packaging sector, recycling innovation ecosystem, and regulatory push for circular materials are expected to support long-term market growth.
Demand is also rising as manufacturers look for reliable ways to improve recycled material performance and meet sustainability targets. Recycling chemicals help support higher-quality recycled plastics, better processing efficiency, and reduced dependence on virgin fossil-based raw materials. This makes the market important for chemical producers, recyclers, packaging companies, consumer brands, and investors focused on circular economy solutions.
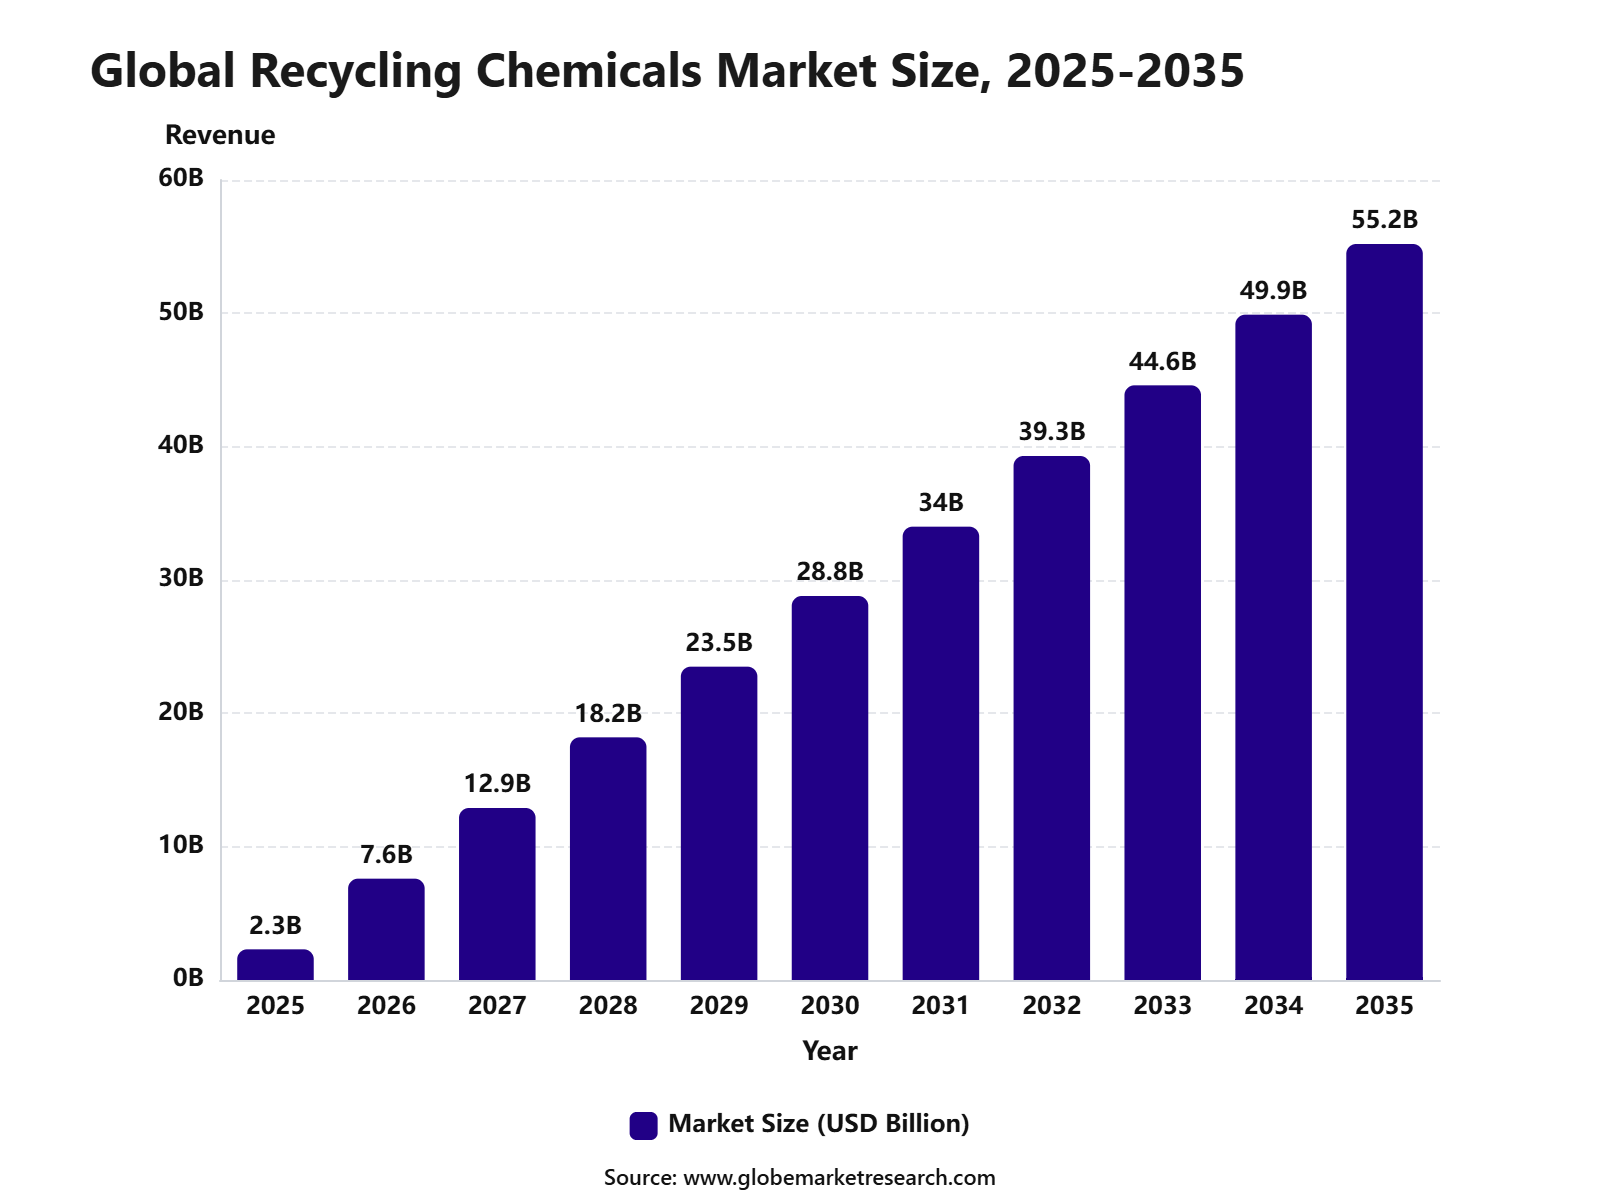 iThe graph shows projected market growth until 2035 based on CAGR analysis. Actual outcomes may vary depending on changing demand, competition, and economic factors.To gain greater insights - request a sample report PDF
Key Market Insights
Pyrolysis led the recycling technology segment with 39.1% share, supported by its ability to process mixed plastic waste and convert it into reusable chemical feedstocks, oils, and fuels.
Polyethylene accounted for 32.3% share by feedstock type, driven by its high use in packaging films, containers, bags, and other plastic products that generate large recycling volumes.
Packaging held 39.7% share by end-use application, supported by rising demand for recycled chemical inputs in flexible packaging, rigid packaging, films, bottles, and consumer goods packaging.
Large-scale operations captured 61.9% share, driven by higher processing capacity, better cost efficiency, stronger feedstock handling, and growing investment in commercial recycling plants.
North America led the recycling chemicals market with 37.1% share, valued at USD 0.8 billion, supported by advanced recycling infrastructure, rising plastic waste management needs, and growing demand for circular chemical production.
Top Funding and Investment
Top Investments
Loop Industries and Ester Industries advanced detailed engineering for their Infinite Loop manufacturing facility in Gujarat. The chemical recycling project has a capital expenditure budget of approximately USD 176 million, although engineering progress indicated that final spending could be lower. The facility will depolymerize waste PET and polyester textiles into virgin-quality recycled chemicals and polymer feedstocks.
Neste commissioned a EUR 111 million liquefied waste plastic upgrading facility at its Porvoo refinery. The unit can process up to 150,000 tonnes of liquefied plastic waste annually, removing contaminants and upgrading the material into high-quality feedstock for new chemicals and plastics. Commercial production will be increased progressively following commissioning.
Indaver started delivering recycled chemical raw materials from its Plastics2Chemicals facility in Antwerp after a total investment of EUR 105 million. The plant converts end-of-life polystyrene and mixed polyolefin packaging into virgin-quality chemical building blocks suitable for new plastic products, including sensitive food-packaging applications.
Xycle secured equity and debt financing from Dow, ING, Invest-NL, Vopak, and Polestar Capital for its first commercial chemical recycling plant in Rotterdam. Invest-NL provided a confirmed EUR 10 million equity investment. The facility is designed to process 21,000 tonnes of difficult-to-recycle plastic annually into pyrolysis oil for new chemical and polymer production.
OMV inaugurated its ReOil facility at the Schwechat refinery to convert mixed end-of-life plastics into circular hydrocarbon feedstocks. The integrated plant can process approximately 16,000 tonnes of plastic waste annually, equivalent to around 2,000 kilograms per hour. The recycled output can be used within refinery and chemical operations to produce virgin-quality plastics and other chemical products.
Top Funding Transactions
DePoly secured total seed financing of USD 23 million to commission a chemical recycling showcase plant in Monthey. The facility is designed to process approximately 500 tonnes of PET and polyester waste annually. Its low-temperature depolymerization technology separates contaminated and mixed waste into purified monomers without requiring extensive washing or feedstock sorting.
Novoloop raised USD 21 million in a Series B round led by Taranis, bringing its total capital raised to more than USD 50 million. The financing supports commercial-scale deployment of its Lifecycling technology, which chemically transforms post-consumer polyethylene into recycled polyols and high-performance polyurethane materials.
Resynergi raised USD 18 million in Series B extension funding led by Taranis, with participation from Lummus Technology, Transitions First, and existing investors. The proceeds are being used to commission its first commercial site and expand modular microwave-assisted pyrolysis systems that convert plastic waste into reusable liquid hydrocarbons and chemical feedstocks.
Top Acquisitions
Agilyx, Europe, October 2025: Acquisition of a 44% Stake in GreenDot Global
Agilyx completed the acquisition of approximately 44% of GreenDot Global, creating a larger European platform for sourcing and processing waste-plastic feedstock. The transaction represented an investment of approximately EUR 52 million, including a EUR 7 million contribution to GreenDot’s EUR 27 million capital increase.
The acquisition gave Agilyx access to GreenDot’s collection, sorting, mechanical recycling, and advanced recycling feedstock operations across Germany, Austria, and Italy. GreenDot processes more than one million tonnes of packaging waste annually and supplies prepared plastic feedstock to chemical recycling facilities.
Nextchem, Italy, June 2026: Acquisition of ETEK and SISEMTEK Technologies
Nextchem acquired a 70% stake in ETEK, which owns 100% of SISEMTEK, for total consideration of EUR 11.1 million. The enterprise value of the two companies was reported at EUR 17.5 million, with EUR 5 million paid upfront and the remaining consideration linked to performance-based earn-outs.
The acquisition included hydrometallurgical and pyrometallurgical recycling technologies, engineering expertise, and proprietary Top Blown Rotary Converter furnaces. These systems recover copper, gold, silver, platinum, palladium, and other strategic materials from electronic waste, spent catalysts, batteries, photovoltaic panels, mining residues, and industrial waste.
By Recycling Technology
Pyrolysis accounted for 39.1% share of the Recycling Chemicals Market. This leading position is supported by its ability to break down plastic waste into useful outputs such as pyrolysis oil, gases, waxes, and chemical feedstocks.
The technology is widely used for hard-to-recycle plastics that cannot be processed efficiently through mechanical recycling. Pyrolysis is especially important for mixed plastic waste, multilayer packaging, contaminated plastics, and polyolefin-rich waste streams.
Demand for pyrolysis is expected to remain strong as chemical producers and recyclers invest in advanced recycling routes. Its ability to convert plastic waste into feedstock for new chemicals, fuels, and polymers supports its dominant role in the market.
By Feedstock Type
Polyethylene accounted for 32.3% share of the Recycling Chemicals Market. This dominance is driven by its high use in packaging films, bags, containers, bottles, pipes, industrial liners, and consumer products.
The segment is widely preferred as a recycling feedstock because polyethylene waste is available in large volumes across municipal, commercial, and industrial waste streams. It can be processed through pyrolysis and other chemical recycling technologies to recover valuable hydrocarbon-based outputs.
Demand for polyethylene feedstock is expected to remain strong as packaging waste recovery and circular plastics initiatives expand. Its large waste volume, broad application base, and strong compatibility with chemical recycling processes will continue to support segment growth.
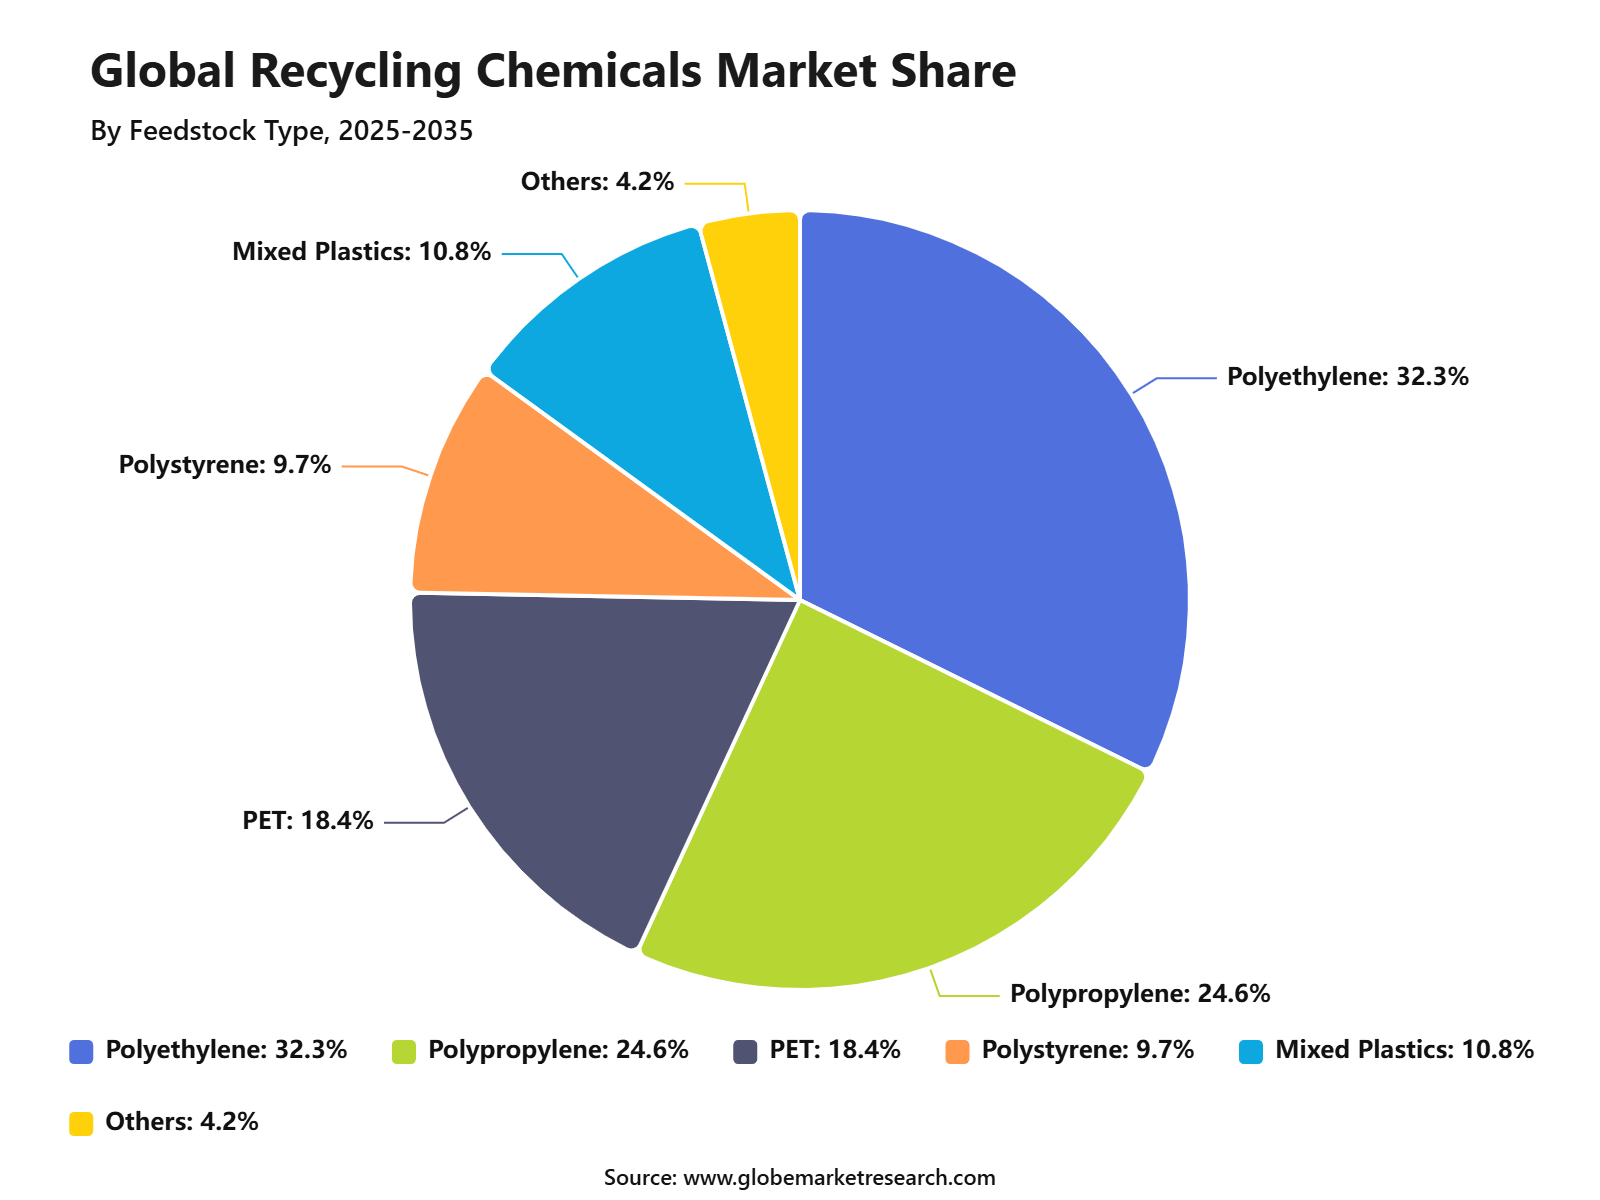 iThe graph shows projected market growth until 2035 based on CAGR analysis. Actual outcomes may vary depending on changing demand, competition, and economic factors.To gain greater insights - request a sample report PDF
By End-Use Application
Packaging accounted for 39.7% share of the Recycling Chemicals Market. This leading share is supported by the high volume of plastic packaging waste generated from food, beverages, personal care, household products, e-commerce, and industrial packaging.
Chemical recycling is gaining importance in packaging because many flexible films, multilayer packs, and contaminated plastic formats are difficult to recycle mechanically. Recycling chemicals and advanced processing routes help recover value from these waste streams and support circular packaging goals.
The segment is expected to remain the largest application area as brands, retailers, and packaging producers increase focus on recycled content and plastic waste reduction. Demand will remain supported by packaging regulations, sustainability commitments, and investment in advanced recycling infrastructure.
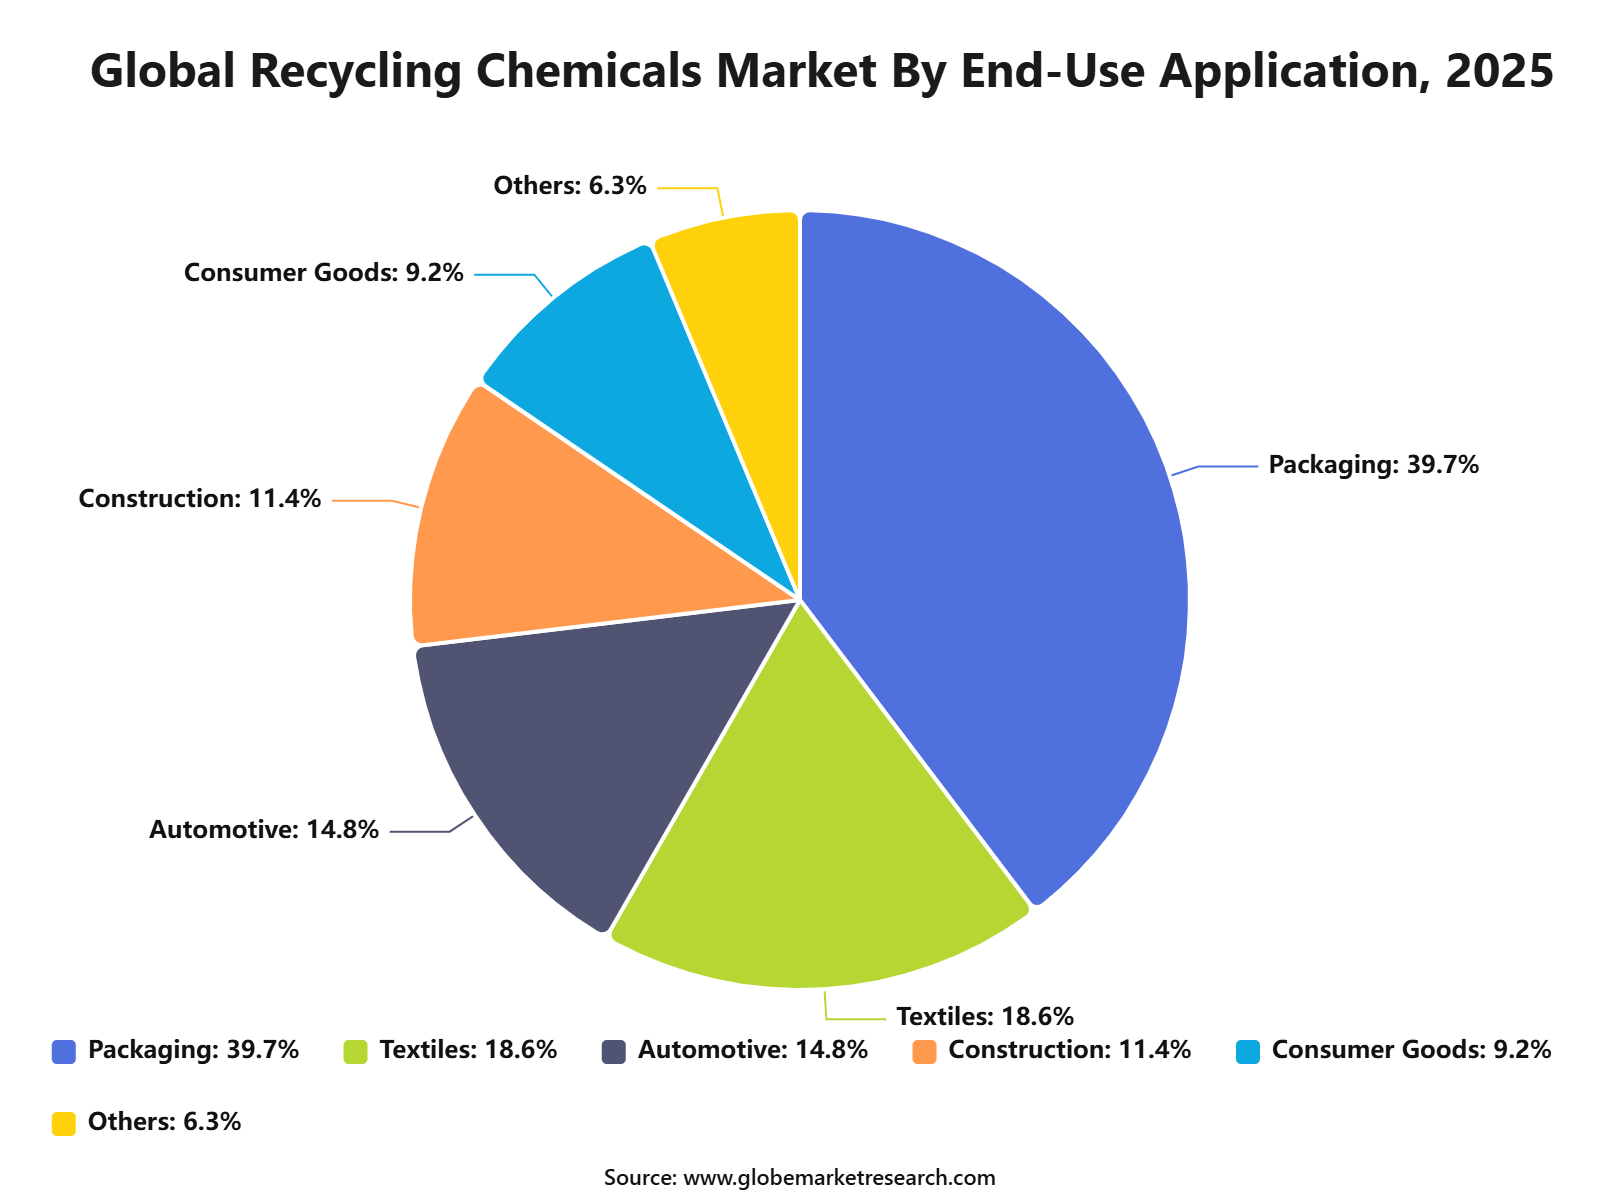 iThe graph shows projected market growth until 2035 based on CAGR analysis. Actual outcomes may vary depending on changing demand, competition, and economic factors.To gain greater insights - request a sample report PDF
By Scale of Operation
Large-scale operations accounted for 61.9% share of the Recycling Chemicals Market. This leadership is supported by the need for high processing capacity, better operating efficiency, and reliable feedstock handling in chemical recycling facilities.
Large-scale recycling plants are preferred because they can process higher plastic waste volumes and supply recycled outputs to chemical producers, polymer manufacturers, fuel producers, and packaging companies. These facilities also support better integration with petrochemical and refinery infrastructure.
Demand for large-scale operations is expected to remain strong as companies move from pilot projects to commercial recycling capacity. The segment will benefit from long-term supply agreements, industrial partnerships, and rising demand for circular chemical feedstocks.
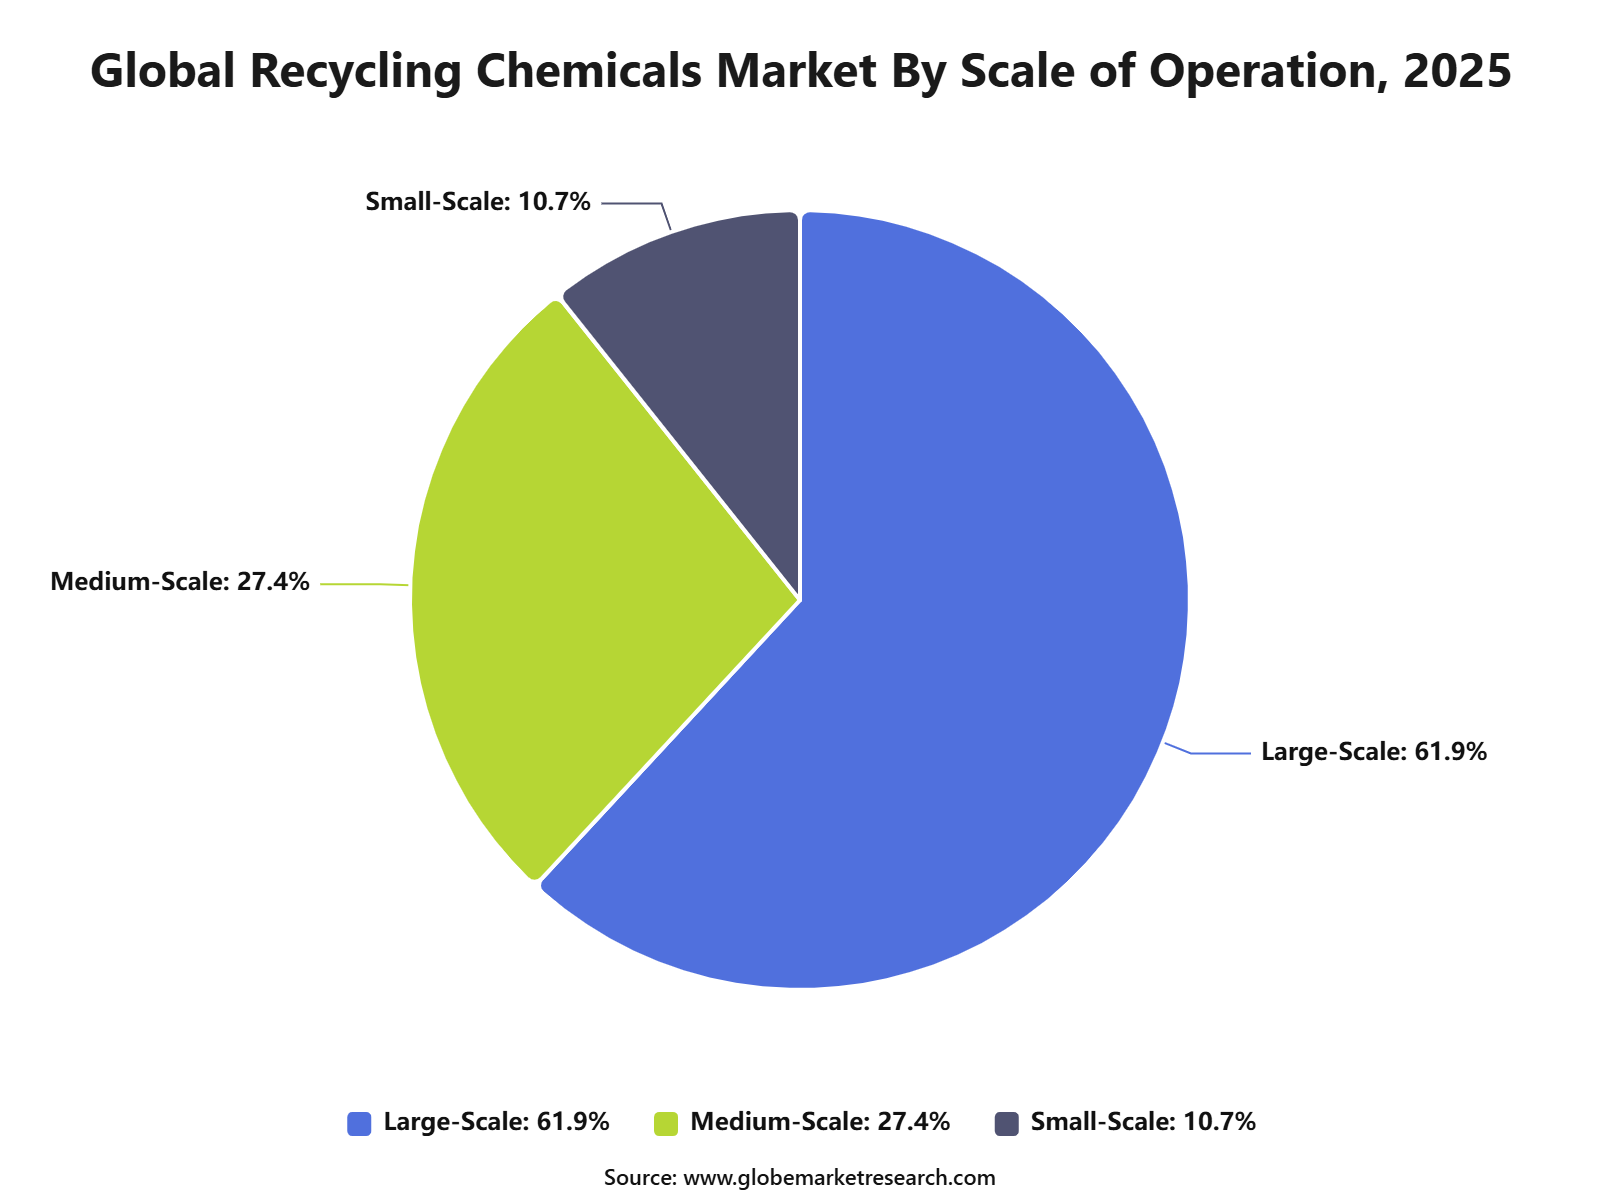 iThe graph shows projected market growth until 2035 based on CAGR analysis. Actual outcomes may vary depending on changing demand, competition, and economic factors.To gain greater insights - request a sample report PDF
By Region
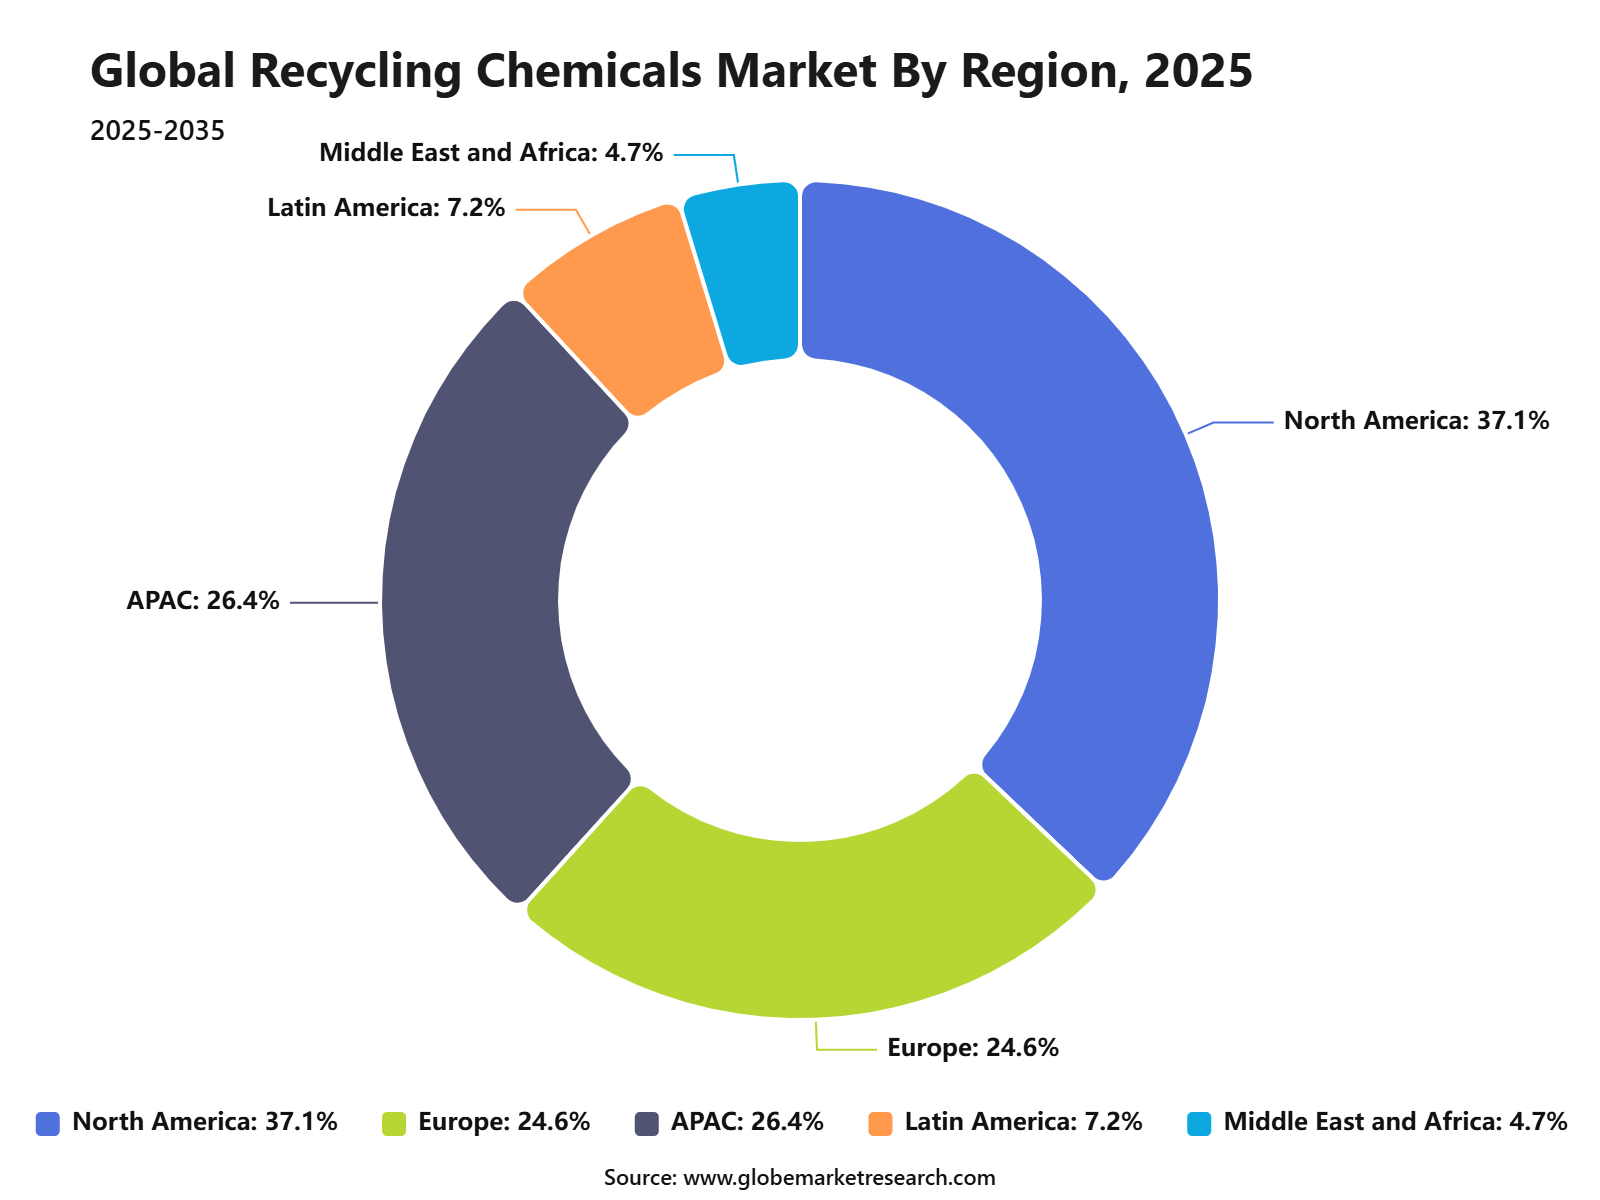
North America accounted for 37.1% share of the Recycling Chemicals Market, reaching USD 0.8 billion. The region’s leadership is supported by strong investment in advanced recycling, high plastic waste generation, and rising demand for recycled chemical feedstocks.
The United States and Canada are key contributors due to growing activity in pyrolysis, plastic-to-chemical technologies, and circular packaging initiatives. Demand is also supported by chemical companies, packaging producers, waste management firms, and consumer brands seeking higher recycled content.
North America is expected to maintain a strong position as commercial-scale recycling projects increase across the region. Demand will remain supported by polyethylene-rich packaging waste, large-scale recycling infrastructure, and stronger focus on circular plastic supply chains.
 iThe graph shows projected market growth until 2035 based on CAGR analysis. Actual outcomes may vary depending on changing demand, competition, and economic factors.To gain greater insights - request a sample report PDF
Regional Impact Analysis
North America leads the Recycling Chemicals Market with 37.1% share in 2025, valued at around USD 0.9 billion, supported by advanced recycling investment, packaging waste recovery, battery recycling growth, and strong demand for circular polymers. The U.S. remains the main regional driver due to its large plastics, packaging, electronics, and EV battery ecosystem.
Europe remains important because of strict recycling rules, circular economy policies, and strong demand for recycled content in packaging and consumer goods. Asia Pacific supports future growth through large waste generation, manufacturing scale, plastic recycling expansion, and growing battery material recovery in China, Japan, South Korea, and India.
Impact Factor | Estimated CAGR Impact | Regional Relevance | Market Impact |
|---|---|---|---|
North America market leadership | +10.4% | North America, 37.1% share in 2025 | Leads global value demand. |
U.S. advanced recycling projects | +7.6% | U.S. | Drives regional chemical demand. |
Canada circular plastics initiatives | +5.8% | Canada | Supports steady adoption. |
Europe recycling regulation strength | +5.2% | Germany, France, UK, Netherlands | Adds compliance-led demand. |
Asia Pacific waste recovery expansion | +4.8% | China, India, Japan, South Korea | Supports future scale. |
Go-To-Market and Sales Economics
Recycling chemical suppliers should prioritise packaging converters, polymer recyclers, municipal recovery operators, and brand owners preparing for stricter circularity rules. The EU Packaging and Packaging Waste Regulation will generally apply from 12 August 2026 and requires all packaging to become recyclable by 2030. Direct technical selling should focus on washing agents, compatibilisers, deinking chemicals, solvents, and purification additives.
Battery and electronics recycling require a specification-led commercial model because recovery performance depends on feedstock chemistry and process control. The IEA reported in April 2026 that about 1.2 million electric-vehicle batteries could reach end-of-life by 2030, while battery-circularity patenting grew 42% annually from 2017 to 2023. Suppliers should combine reagents with laboratory testing and recovery guarantees.
Regional sales networks should be built around high-volume waste processors, hazardous-waste operators, and industrial recycling clusters. Veolia reported in February 2026 that it treated 64 million tonnes of waste during 2025. Such processing scale supports multi-year demand for neutralising agents, flotation chemicals, odour control, metal-recovery reagents, and wastewater-treatment formulations supplied under volume-based contracts.
Risk Factors & Market Barriers
Feedstock inconsistency creates technical and commercial risk because mixed waste changes reagent consumption, recovery yields, and product quality. The European Commission’s Joint Research Centre reported in May 2026 that 46% of strategic and critical raw materials contained in small electrical and electronic equipment is lost during collection. Better sorting, sampling, and pre-treatment are therefore required before chemical processing begins.
Secondary-material price volatility can weaken recycler purchasing power and delay chemical orders. Eurostat reported in March 2026 that average 2025 prices were EUR 308 per tonne for plastic, EUR 154 for paper and cardboard, and EUR 88 for glass. Plastic and paper prices fell nearly 2%, while glass declined 8%, increasing pressure on operating margins.
Capacity utilisation is another barrier because low recycling volumes spread fixed chemical, labour, and energy costs across fewer tonnes. TOMRA reported that first-quarter 2026 Recycling revenue declined 19% to EUR 37 million, while gross margin fell from 44.7% to 40.5%. Suppliers should use minimum-volume agreements, flexible packaging sizes, and service contracts to protect sales stability.
Revenue Potential Analysis
Revenue Landscape Across
Packaging recycling offers broad revenue across plastic, paper, metal, and glass processing. EU rules require PET beverage bottles to contain 25% recycled plastic from 2025, rising to 30% for all plastic beverage bottles by 2030. This supports demand for bottle-washing chemicals, label-removal agents, decontamination systems, polymer stabilisers, colour correction, and food-contact purification technologies.
Battery recycling provides higher-value demand for acids, alkalis, extractants, precipitants, solvents, and water-treatment chemicals. EU recovery targets due by 31 December 2027 require 90% recovery of cobalt, copper, lead, and nickel, alongside 50% recovery of lithium. Chemical suppliers can increase contract value through closed-loop reagent management, impurity control, and metal-specific process optimisation.
Critical-material recovery from electronics, vehicles, and wind equipment is creating specialised opportunities. The Joint Research Centre expects annual losses of permanent-magnet materials from wind turbines to rise from 1,900 tonnes in 2022 to about 45,000 tonnes by 2030. Selective leaching, solvent extraction, precipitation, and separation chemicals will be required to recover rare-earth materials economically.
Financial Impact
Large environmental-service platforms show that operational scale can support recurring chemical consumption and stronger cash generation. Veolia reported first-quarter 2026 revenue of EUR 11.43 billion and EBITDA of EUR 1.77 billion, representing 5.1% organic growth. Chemical vendors can improve financial visibility through indexed supply agreements, automated dosing systems, inventory management, and performance-linked service fees.
Weak equipment ordering demonstrates why recycling chemical suppliers should not rely only on new processing plants. TOMRA’s first-quarter 2026 recycling order intake fell to EUR 41 million from EUR 61 million, prompting a EUR 16 million cost-reduction programme. Recurring consumables, reagent regeneration, wastewater treatment, and optimisation services can provide steadier revenue when capital investment cycles slow.
Chemical producers must balance circular-product investment with pricing pressure and working-capital discipline. BASF reported first-quarter 2026 sales of EUR 16.02 billion and an EBITDA-before-special-items margin of 14.7%, while maintaining full-year free-cash-flow guidance of EUR 1.5 billion to EUR 2.3 billion. Recycling chemical projects should therefore be phased against secured feedstock, offtake, and utilisation commitments.
Drivers Impact Analysis
The Recycling Chemicals Market is driven by rising plastic waste volumes, stricter recycling rules, demand for circular materials, corporate sustainability targets, and growth in chemical recycling technologies. Recycling chemicals are used in depolymerization, solvent-based purification, deinking, washing, separation, catalysts, additives, and material recovery processes.
North America leads the market due to strong investment in advanced recycling, large packaging waste generation, brand commitments for recycled content, and growing demand from plastics, packaging, textiles, electronics, and battery recycling. The U.S. remains the main regional contributor because of its large polymer consumption base and rising circular economy investment.
Impact Factor | Estimated CAGR Impact | Regional Relevance | Market Impact |
|---|---|---|---|
Rising plastic waste and recycling demand | +10.5% | North America, Europe, Asia Pacific | Drives core chemical usage. |
Growth in chemical recycling facilities | +9.2% | U.S., Canada, Europe, Japan | Supports catalyst and solvent demand. |
Recycled content targets from brands | +7.8% | Packaging and consumer goods markets | Improves recycled material demand. |
Government pressure on landfill reduction | +6.5% | North America and Europe | Encourages recycling infrastructure. |
Demand for circular polymers | +5.4% | Plastics, textiles, automotive, packaging | Builds long-term market pull. |
Restraints Impact Analysis
The market faces restraints from high recycling plant setup cost, uncertain feedstock quality, chemical handling risks, and limited commercial-scale adoption of advanced recycling. Many recycling chemicals need controlled process conditions, quality testing, and compatibility with mixed waste streams.
Another restraint is economic competition from virgin materials. When virgin plastic or metal prices are low, recycled output can face pricing pressure, which affects chemical usage, plant utilization, and investment confidence.
Impact Factor | Estimated CAGR Impact | Regional Relevance | Market Impact |
|---|---|---|---|
High advanced recycling cost | -5.8% | Global recycling operators | Slows commercial expansion. |
Mixed waste feedstock quality issues | -5.0% | Municipal and industrial waste streams | Reduces process efficiency. |
Competition from virgin materials | -4.3% | Plastics and packaging markets | Affects recycled material margins. |
Chemical safety and handling concerns | -3.6% | Recycling plants and regulators | Increases compliance burden. |
Limited large-scale processing capacity | -3.0% | Emerging recycling markets | Restricts faster demand growth. |
Opportunities Impact Analysis
Opportunities are strong in plastic recycling chemicals, solvent purification, PET depolymerization, polyolefin recycling, textile recycling, battery recycling chemicals, e-waste recovery chemicals, deinking chemicals, and metal recovery reagents. These areas benefit from rising demand for higher-quality recovered materials.
Higher-value opportunities are emerging in catalysts for advanced recycling, selective solvents, enzyme-based recycling, purification additives, battery black mass processing, and specialty chemicals for circular polymers. Suppliers that improve yield, purity, and process economics can capture stronger long-term demand.
Impact Factor | Estimated CAGR Impact | Regional Relevance | Market Impact |
|---|---|---|---|
Plastic chemical recycling expansion | +10.2% | North America, Europe, Asia Pacific | Builds largest opportunity base. |
PET and polyester depolymerization | +8.6% | Packaging and textile markets | Supports closed-loop recycling. |
Battery recycling chemicals | +7.2% | U.S., Canada, Europe, Asia Pacific | Adds high-value recovery demand. |
Solvent-based polymer purification | +6.0% | Advanced recycling facilities | Improves recycled material quality. |
E-waste and metal recovery chemicals | +5.0% | Electronics recycling markets | Expands material recovery value. |
Challenges Impact Analysis
The main challenge is achieving consistent recycled output from highly variable waste streams. Recycling facilities must manage contamination, mixed polymers, additives, labels, inks, fillers, and degraded materials while maintaining product quality.
Another challenge is proving commercial economics. Advanced recycling chemical processes must show strong yield, lower energy use, safe operation, stable feedstock supply, and reliable offtake agreements to support large-scale investment.
Impact Factor | Estimated CAGR Impact | Regional Relevance | Market Impact |
|---|---|---|---|
Managing contaminated waste streams | -5.5% | Municipal and packaging recycling | Affects output quality. |
Proving commercial-scale economics | -4.8% | Advanced recycling projects | Influences investor confidence. |
Maintaining chemical process efficiency | -4.0% | Recycling chemical users | Impacts operating cost. |
Securing steady feedstock supply | -3.4% | Recycling plant operators | Affects utilization rate. |
Meeting recycled material specifications | -2.8% | Packaging, automotive, textiles | Requires strong quality control. |
Segment Covered in the Report
By Recycling Technology
Pyrolysis
Depolymerization
Gasification
Dissolution
Purification
By Feedstock Type
Polyethylene
Polypropylene
PET
Polystyrene
Mixed Plastics
Others
By End-Use Application
Packaging
Textiles
Automotive
Construction
Consumer Goods
Others
By Scale of Operation
Large-Scale
Medium-Scale
Small-Scale
By Region
North America
Europe
Asia Pacific
Latin America
Middle East and Africa
Market Trend Analysis
The market trend is moving toward advanced plastic recycling, catalytic depolymerization, solvent-based purification, battery material recovery, enzyme-assisted recycling, and cleaner washing and separation chemicals. Companies are shifting from low-value recycling toward high-purity recycled feedstocks for industrial reuse.
North America remains the largest value region because of strong investment in circular plastics, packaging recovery, battery recycling, and advanced recycling plants. Europe supports growth through regulation-led recycling demand, while Asia Pacific expands through large waste volumes and manufacturing-linked material recovery.
Impact Factor | Estimated CAGR Impact | Regional Relevance | Market Impact |
|---|---|---|---|
Advanced plastic recycling gains scale | +9.8% | North America, Europe, Asia Pacific | Leads market transformation. |
Battery recycling chemistry rises | +8.0% | U.S., Canada, Europe, South Korea | Adds high-value chemical demand. |
Solvent purification technologies expand | +6.7% | Packaging and polymer markets | Improves recycled material quality. |
Enzyme-based recycling attracts interest | +5.5% | PET and textile recycling markets | Supports cleaner processing. |
Circular polymer supply chains grow | +4.6% | Consumer goods and packaging | Improves offtake demand. |
Investor Type Impact Matrix
Investors should focus on companies with strong chemical recycling expertise, patented solvent or catalyst systems, feedstock partnerships, offtake agreements, and proven process economics. Purity improvement, yield performance, safety compliance, and cost efficiency are key success factors.
Strategic investors can also target plastic recycling chemical suppliers, battery recycling reagent providers, e-waste recovery firms, solvent recovery technology companies, catalyst developers, and circular materials platforms. Companies that convert difficult waste into high-quality reusable materials are better positioned for long-term growth.
Investor Type | Estimated CAGR Impact | Regional Relevance | Market Impact |
|---|---|---|---|
Recycling Chemical Manufacturers | +8.6% | Global | Expands chemical supply for circular materials. |
Catalyst and Solvent Technology Providers | +7.2% | North America, Europe, Asia Pacific | Improves recycling process economics. |
Battery Recycling Chemical Firms | +6.0% | EV and energy storage markets | Supports critical material recovery. |
E-waste Recovery Chemical Suppliers | +5.0% | Electronics recycling markets | Adds high-value metal recovery. |
Strategic Circular Economy Investors | +4.2% | Global recycling markets | Funds scale and commercial deployment. |
Recent Developments
In June 2026, Quantafuel owner Viridor decided to close European chemical-recycling operations in Skive, Malmö and Oslo after concluding that weak demand, regulatory uncertainty and low-cost virgin imports made continued investment commercially unviable.
In May 2026, Eastman’s Kingsport methanolysis operation received ISO 59014 certification, confirming traceable secondary-material recovery and supporting production of recycled-content polymers from difficult polyester waste through its molecular recycling platform.
In March 2026, Plastic Energy’s technology supported start-up of the advanced recycling plant at TotalEnergies’ Grandpuits site, converting difficult plastic waste into recycled hydrocarbon feedstock for new commercial polymer production.
In February 2026, LyondellBasell updated its circularity strategy, targeting production and marketing of 800,000 metric tons of recycled and renewable-based polymers annually by 2030 through mechanical, solvent-based and chemical recycling platforms.
Competitive Landscape
The market is characterized by intense competition among established players and emerging companies. Strategic partnerships, mergers and acquisitions, and product innovation are key strategies employed by market participants.
Key Market Players
Eastman Chemical Company
ExxonMobil Corporation
BASF SE
SABIC
LyondellBasell Industries
Dow Inc.
Agilyx ASA
Plastic Energy
Loop Industries
Brightmark
Carbios
INEOS
Quantafuel
Mura Technology
PureCycle Technologies
Other Key Players
Research Methodology
This market study is prepared using a combination of primary and secondary research. Primary research includes discussions with manufacturers, suppliers, distributors, consultants, industry experts, and end users. Secondary research covers company reports, government databases, trade associations, technical publications, regulatory sources, and trusted industry documents. The collected information is used to assess market demand, pricing trends, technology adoption, competitive activity, and regional performance.
AI language models are not used as primary data sources, and publicly available AI-generated content is not treated as market evidence. Computational tools may be used to support data processing, translation, data classification, and pattern identification. However, every published assessment is supported by verified sources, human review, and primary market discussions.
Market estimates are developed through top-down and bottom-up approaches and validated using data triangulation. Revenue, production, shipment, pricing, and application-level data are compared across multiple sources. Forecasts consider economic conditions, regulatory changes, investment activity, innovation, supply chain developments, and industry risks. All findings are reviewed through source verification and internal quality checks before publication.
Part I
Source Management & Input Data Standards
Who provides data, how sources are qualified, and what types of evidence are admissible.
Part II
Research Scope & Market Coverage
How we define the markets we assess and the parameters that govern each product.
Part III
Data Collection, Verification & Submission
The mechanics of gathering, cross-checking, and hierarchically ranking evidence.
Part IV
Assessment Determination & Quality Controls
How raw data becomes a published assessment — normalisation, expert judgement, and outlier exclusion.
Part V
Publication, Corrections & Revision
Our publication schedule, corrections policy, and methodology review cycle.
Part VI
Independence, Ethics & Complaints
Conflict-of-interest policies, editorial independence, and how clients raise concerns.
Google · Preferred Sources
Don't miss the latest market research insights and industry updates on Google.
Add Globe Market Research as a preferred source in the Google app to see our reports, analysis, and market stories in your news suggestions.
Meet the Team
This report was prepared by our expert analysts with deep industry knowledge and research experience.
Pratiksha K. is a Senior Research Analyst with more than five years of experience in market research, industry analysis, competitive intelligence, and business strategy. She has contributed to detailed market reports, customized research studies, company profiling, market sizing, trend analysis, and strategic consulting projects for clients across different regions. Her industry expertise covers Chemical and Material, Consumer Goods, Food & Beverages and Energy & Power. She closely evaluates changing customer requirements, technology developments, regulatory conditions, supply chain structures, investment activity, and competitive strategies to provide clear and practical market insights.
Sayali brings more than 7 years of experience to Globe Market Research, supporting the accuracy, clarity, and relevance of research content across multiple industries. She reviews market data, segment analysis, competitive insights, and industry trends to ensure each report meets strong quality standards and provides practical value to business decision-makers. Her expertise spans healthcare, information technology, consumer goods, and diverse cross-industry domains. With a strong focus on data reliability, structured analysis, and clear presentation, Sayali helps ensure that each research output delivers well-reviewed insights for clients, investors, consultants, and industry stakeholders.
Frequently Asked Questions
Related Reports
More in Chemical and Material
Sulfuric Acid Market to Hit USD 61.5 Billion by 2035
Sulfuric Acid Market Size, Share, Analysis By Raw Material (Elemental Sulfur, Base Metal Smelters, Pyrite Ore, Others), By Application (Fertilizers, Chemical Manufacturing, Metal Processing, Petroleum Refining, Textile, Automotive, Pulp and Paper, Others), By Distribution Channel (Direct Sales, Distributors), By Regional Insights, Business plan and Project Report, Investment Opportunities, Profitability, Industry Trends, Leading Companies and Growth Forecasts by 2026-2035
Powder Metallurgy Market to Hit USD 17.0 Billion by 2035
Powder Metallurgy Market Size, Share, Analysis By Material (Ferrous Metals, Non-Ferrous Metals, Others), By Process (Additive Manufacturing, Powder Metal Hot Isostatic Pressing, Conventional Powder Metallurgy), By Application (Automotive, Aerospace and Defense, Healthcare, Electrical and Electronics, Industrial Machinery, Others) , By Regional Insights, Business plan and Project Report, Investment Opportunities, Profitability, Industry Trends, Leading Companies and Growth Forecasts by 2026-2035
Bromine Market to Hit USD 1.5 Billion by 2035
Bromine Market Size, Share, Analysis By Derivative (Organobromine, Clear Brine Fluids, Hydrogen Bromide, Others), By Application (Flame Retardants, Oil and Gas Drilling, Biocides, PTA Synthesis, Plasma Etching, Pharmaceuticals, Energy Storage, Others), By End-Use Industry (Chemicals, Oil and Gas, Pharmaceuticals, Electrical and Electronics, Automotive, Agriculture, Others), By Regional Insights, Business plan and Project Report, Investment Opportunities, Profitability, Industry Trends, Leading Companies and Growth Forecasts by 2026-2035
Hydrogen Cyanide Market to Hit USD 5.95 Billion by 2035
Hydrogen Cyanide Market Size, Share, Analysis By Product Form (Hydrogen Cyanide Liquid, Hydrogen Cyanide Gas), By Application (Adiponitrile, Acetone Cyanohydrin, Sodium Cyanide and Potassium Cyanide, Methionine, Cyanuric Chloride, Others), By End-Use Industry (Chemicals, Mining and Metallurgy, Pharmaceuticals, Agriculture, Textiles, Others), By Regional Insights, Business plan and Project Report, Investment Opportunities, Profitability, Industry Trends, Leading Companies and Growth Forecasts by 2026-2035