

Revenue, 2025
$ 1,198.3 Bn
Forecast, 2035
$ 2,539.5 Bn
CAGR, 2025-2035
7.8%
Report Coverage
Global
Market Size and Forecast
The Global Power Generation Market was worth USD 1,198.3 billion in 2025 and is expected to reach USD 2,539.5 billion by 2035, growing at a CAGR of 7.8% from 2025 to 2035. Based on this growth rate, the market is estimated to reach around USD 1,332.4 billion in 2026. Asia Pacific held the largest regional share of 53.8% in 2025, valued at around USD 644.6 billion, supported by rising electricity demand, industrial expansion, urbanization, and large-scale energy infrastructure investment.
The Power Generation Market includes the production of electricity from thermal, hydro, nuclear, solar, wind, biomass, gas-fired, and other energy sources. It covers power plants, distributed generation systems, renewable energy projects, grid-connected generation assets, and supporting equipment. The market is closely linked with energy security, industrial growth, electrification, clean energy transition, and national power infrastructure planning.
Key Parameter | Report Details |
|---|---|
Market Revenue, 2025 | USD 1,198.3 Billion |
Projected Revenue, 2035 | USD 2,539.5 Billion |
CAGR (2025-2035) | 7.8% |
Largest Region | Asia Pacific: 53.8%, USD 644.6 Bn |
Market Concentration | Medium |
Base Year | 2025 |
Forecast Period | 2025-2035 |
The market outlook remains strong as countries continue expanding electricity supply to support homes, industries, transport, and digital infrastructure. Growth can be attributed to rising power consumption, renewable energy deployment, grid modernization, and investment in cleaner generation technologies. The expansion of Asia Pacific power capacity, energy storage integration, and hybrid generation systems is expected to support long-term market demand.
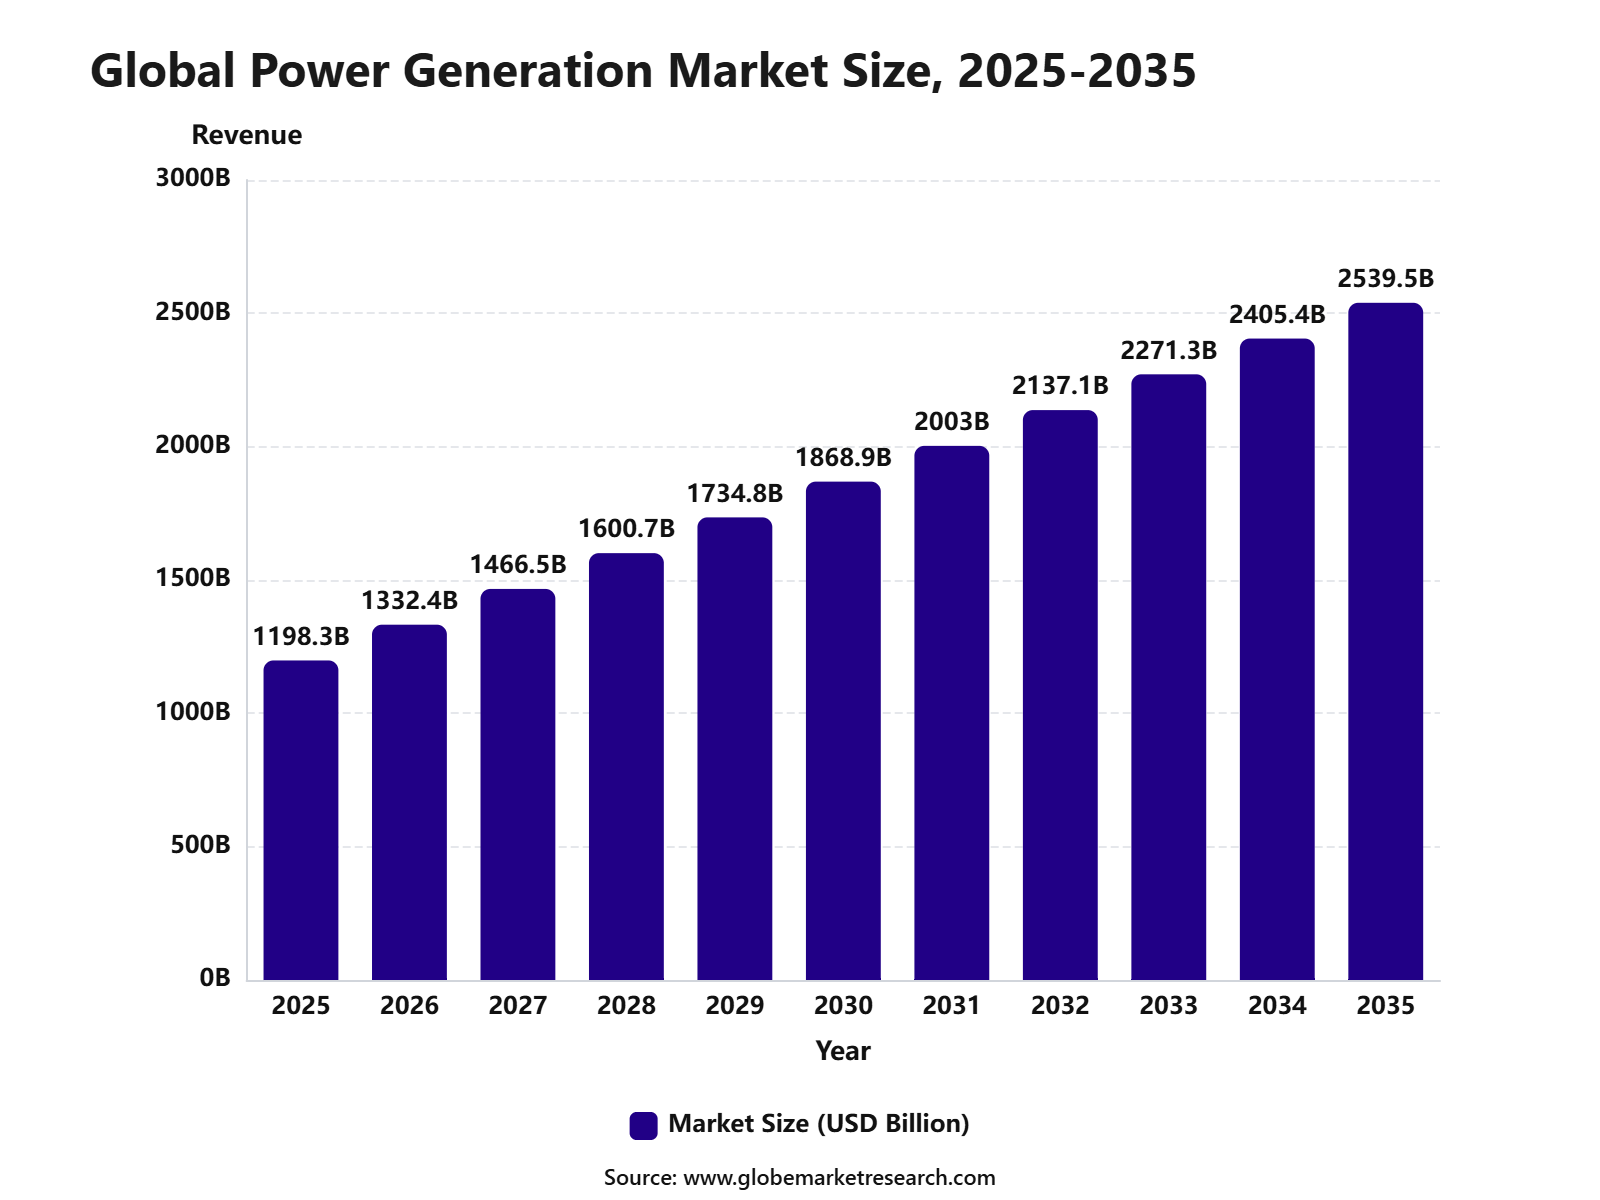 iThe graph shows projected market growth until 2035 based on CAGR analysis. Actual outcomes may vary depending on changing demand, competition, and economic factors.To gain greater insights - request a sample report PDF
Key Market Insights
Non-conventional and renewable power led the type segment with 66.3% share, supported by rising investment in solar, wind, hydro, biomass, and other cleaner electricity generation sources.
Industrial end users accounted for 45.8% share, driven by high electricity demand from manufacturing plants, processing facilities, data centers, mining operations, and heavy industries.
Asia Pacific led the power generation market with 53.8% share, valued at USD 644.6 billion, supported by rapid industrialization, rising electricity consumption, expanding renewable capacity, and large-scale power infrastructure development across China, India, Japan, and Southeast Asia.
Top Funding and Investment
Top Investments
Sizewell C secured final investment decision for the U.K. nuclear power project. The project is estimated to cost around £38 billion and is planned to supply electricity for the equivalent of 6 million homes for at least 60 years. The U.K. government became the largest shareholder with an initial 44.9% stake, alongside EDF, Centrica, La Caisse, and Amber Infrastructure.
Brookfield expanded its financing framework with Bloom Energy from USD 5 billion to USD 25 billion to build and finance rapid power projects for AI infrastructure. The partnership supports Bloom’s onsite fuel-cell power systems and is aimed at fast, reliable electricity supply for large AI and data center facilities.
Canada’s Darlington New Nuclear Project advanced with a total expected budget of CAD 20.9 billion for four small modular reactor units. The first SMR is expected to cost CAD 7.7 billion, including common infrastructure. Once completed, all four units are expected to generate enough clean electricity for about 1.2 million homes.
ACWA Power, Badeel, and Saudi Aramco Power Company signed agreements to invest approximately USD 8.3 billion in 15,000 MW of renewable power projects in Saudi Arabia. The portfolio includes five solar PV plants and two wind power plants, with 12,000 MW solar and 3,000 MW wind capacity planned for the national grid.
ReNew announced an investment of about INR 22,000 crore, around USD 2.5 billion, to build a hybrid renewable energy project in Andhra Pradesh, India. The project includes 2.8 GW of generation capacity, with 1.8 GWp solar, 1 GW wind, and 2 GWh battery storage for peak power supply.
Top Funding
X-energy closed an oversubscribed USD 700 million Series D financing round. The funds will support expansion of its supply chain and commercial pipeline for its Xe-100 advanced small modular reactor and TRISO-X fuel. The company reported an orderbook of more than 11 GW, equal to about 144 advanced SMRs.
TerraPower closed a USD 650 million fundraise, with participation from investors including NVentures, NVIDIA’s venture capital arm, Bill Gates, and HD Hyundai. The funding supports TerraPower’s Natrium technology, which combines an advanced nuclear reactor with a gigawatt-scale energy storage system.
Fervo Energy raised USD 462 million in Series E funding led by B Capital. The funding will support the buildout of Cape Station in Utah, which is expected to deliver 100 MW of firm clean power in 2026 and add 400 MW by 2028, reaching 500 MW total capacity.
Top Acquisitions
Constellation completed the acquisition of Calpine Corporation from Energy Capital Partners. The deal was announced at an equity purchase price of about USD 16.4 billion, plus the assumption of about USD 12.7 billion of Calpine net debt. What it acquired was Calpine’s large natural gas generation platform, renewable assets, and the largest geothermal generation operation in the U.S., creating the nation’s largest producer of electricity.
NRG Energy completed the acquisition of 13 GW of power generation assets and CPower from LS Power. What it acquired included 18 natural gas-fired generation facilities and a commercial and industrial virtual power plant platform. LS Power stated that the transaction was valued at about USD 13 billion in cash and NRG common stock.
By Type
Non-conventional and renewable power generation accounted for 66.3% share of the Power Generation Market. This leading position is supported by rising investment in solar, wind, hydro, biomass, geothermal, and other cleaner power sources.
The segment is gaining strong demand as governments, utilities, and industries focus on reducing fossil fuel dependence and improving energy security. Renewable power systems are also being adopted to support lower emissions, long-term cost savings, and distributed electricity generation.
Demand is expected to remain strong as grid modernization, battery storage, and clean energy policies continue to expand. Solar and wind capacity additions will remain major contributors, while hydropower and biomass will support stable renewable power supply.
By End User
The industrial segment held 45.8% share of the Power Generation Market. This dominance is driven by high electricity consumption across manufacturing, mining, oil and gas, chemicals, metals, data centers, cement, and heavy processing industries.
Industrial users require reliable power for continuous operations, machinery, automation systems, heating, cooling, and process control. Many companies are also investing in captive power, renewable power purchase agreements, and hybrid energy systems to reduce power disruption and manage energy costs.
The segment is expected to remain the largest end-user category as industrial production and electrification continue to increase. Growth will be supported by energy-intensive manufacturing, digital infrastructure expansion, and stronger demand for clean and stable power supply.
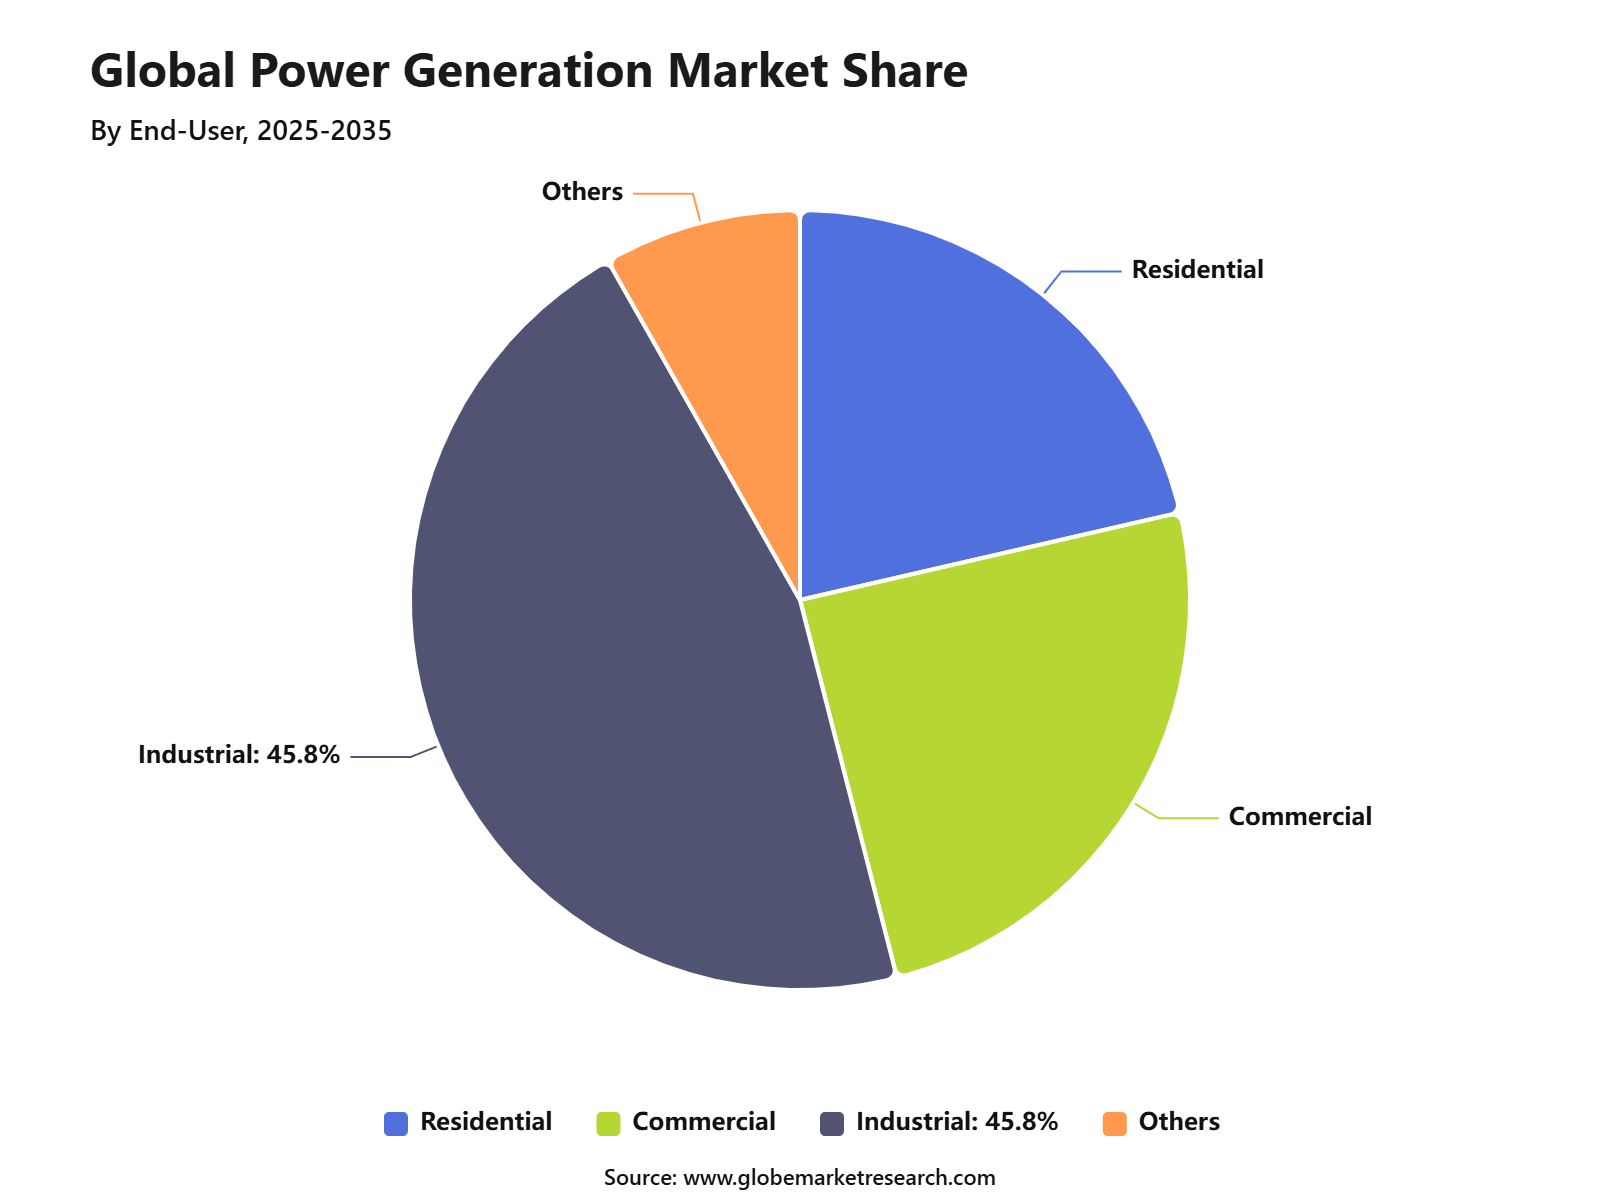 iThe graph shows projected market growth until 2035 based on CAGR analysis. Actual outcomes may vary depending on changing demand, competition, and economic factors.To gain greater insights - request a sample report PDF
By Region
Asia Pacific accounted for 53.8% share of the Power Generation Market, reaching USD 644.6 billion. The region’s leadership is supported by rising electricity demand, rapid industrialization, urban growth, and large-scale investment in power infrastructure.
China, India, Japan, South Korea, Australia, and Southeast Asian countries are key contributors to regional power generation demand. The region has strong activity in renewable power, thermal power, hydropower, nuclear energy, and grid expansion to support residential, commercial, and industrial electricity needs.
Asia Pacific is expected to maintain its leading position as energy demand continues to rise across fast-growing economies. Investment in renewable capacity, grid reliability, energy storage, and industrial power supply will continue to support regional market growth.
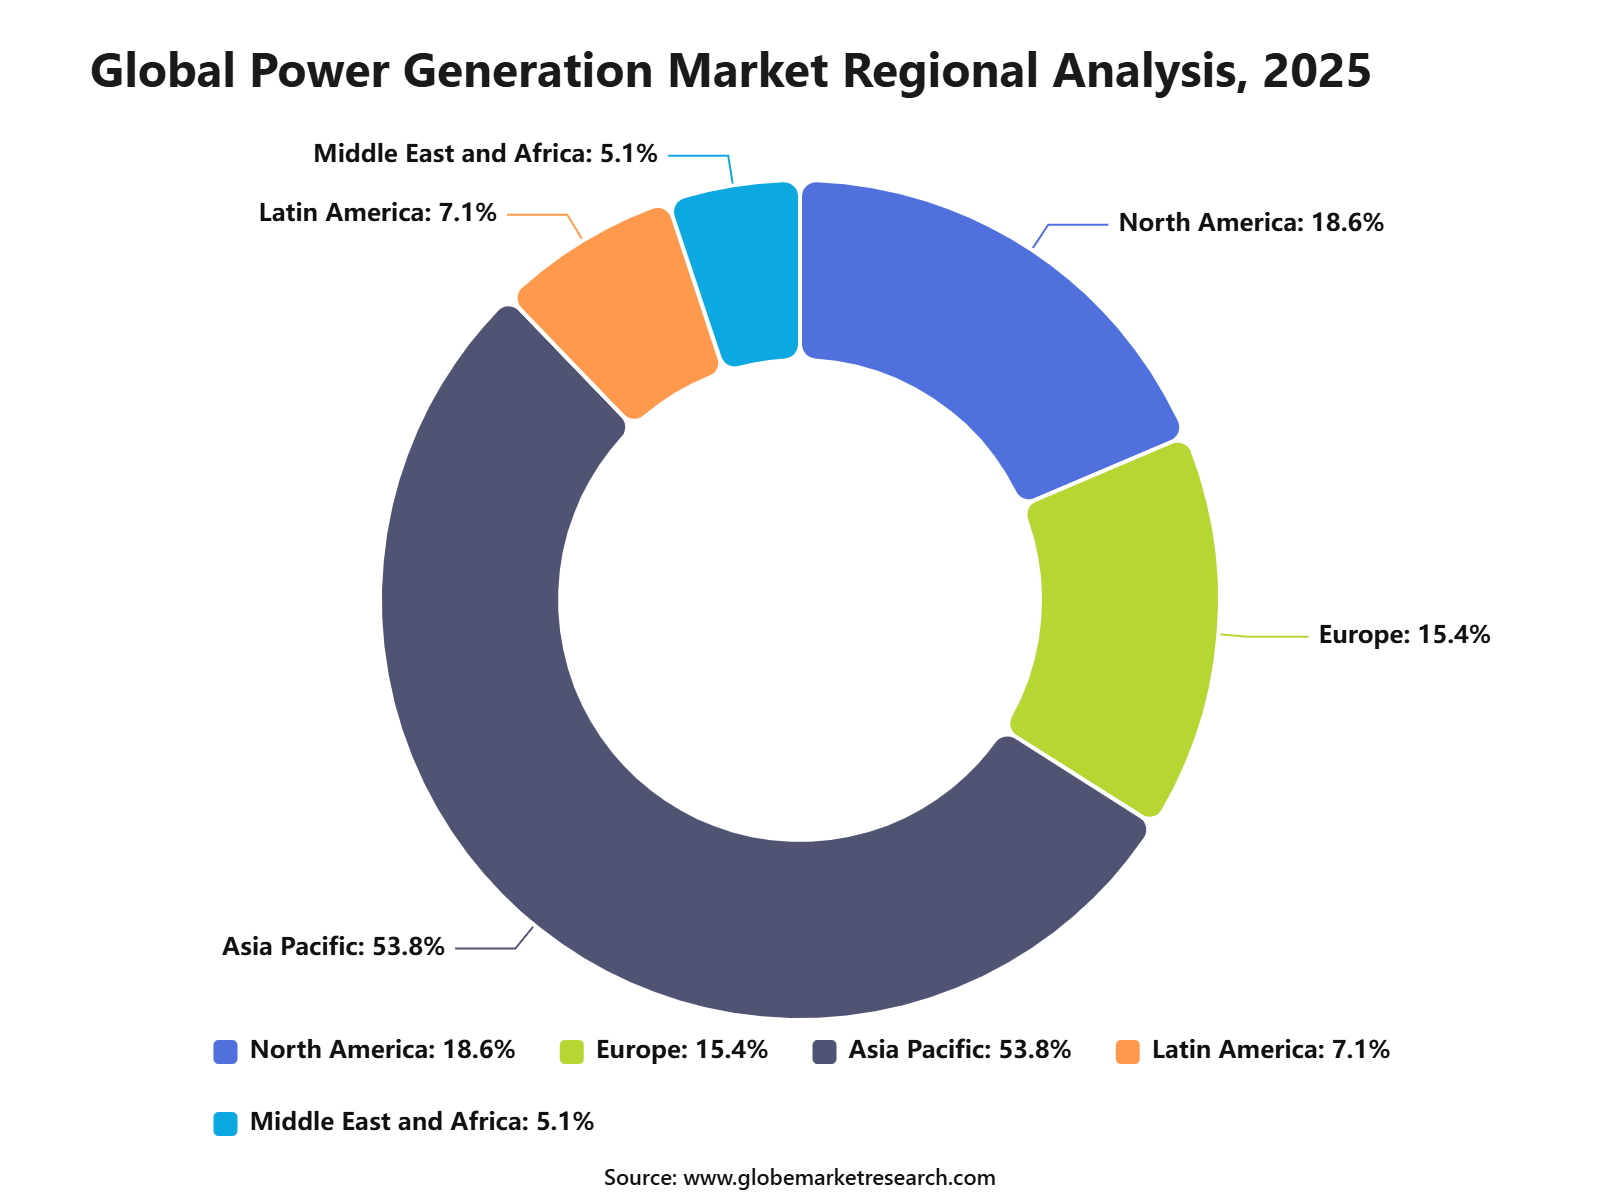 iThe graph shows projected market growth until 2035 based on CAGR analysis. Actual outcomes may vary depending on changing demand, competition, and economic factors.To gain greater insights - request a sample report PDF
Regional Impact Analysis
Asia Pacific leads the Power Generation Market with 53.8% share in 2025, valued at around USD 644.7 billion, supported by large electricity demand, industrial expansion, urban growth, and major investments in thermal, renewable, hydro, and nuclear generation. China and India remain the largest regional growth engines due to rising power consumption and capacity expansion.
North America remains important because of grid modernization, renewable energy deployment, gas-fired generation, nuclear capacity, and fast-growing data center power demand. Europe supports value growth through renewable power, offshore wind, nuclear life extension, energy security planning, and storage deployment.
Impact Factor | Estimated CAGR Impact | Regional Relevance | Market Impact |
|---|---|---|---|
Asia Pacific market leadership | +2.8% | Asia Pacific, 53.8% share in 2025 | Leads global value demand. |
China power capacity expansion | +1.8% | China | Drives regional scale. |
India electricity demand growth | +1.5% | India | Supports future expansion. |
North America grid and data center demand | +1.0% | U.S. and Canada | Adds high-value demand. |
Europe renewable and energy security investment | +0.9% | Germany, France, UK, Italy | Builds clean power growth. |
Go-To-Market and Sales Economics
Power generation is commercialized through utility procurement, independent power producer contracts, EPC partnerships, equipment OEMs, grid operators, and corporate power purchase agreements. Demand is being supported by electrification, data centers, cooling, EVs, and industrial loads. IEA expects global electricity demand to grow 3.6% annually during 2026 to 2030.
Sales economics are shifting from fuel-only generation to capacity, flexibility, storage, and grid-support value. Solar PV generation is forecast to rise by 320 to 360 TWh every year through 2030, meeting around 60% of average annual electricity demand growth. This supports equipment sales, project development, and service revenue.
Large equipment suppliers are seeing strong order momentum. GE Vernova reported Q1 2026 orders of USD 18.3 billion, up 71% organically, while gas power equipment backlog and slot reservations increased from 83 GW to 100 GW. This shows demand for both new generation and reliable dispatchable capacity.
Risk Factors & Market Barriers
The main barrier is grid readiness. Power generation projects need transmission access, interconnection approval, transformers, substations, permits, and skilled labor before revenue can start. IEA stated that annual grid investment must rise by about 50% by 2030 from today’s USD 400 billion to meet electricity demand growth.
Fuel and technology balance is another risk because solar, wind, gas, coal, hydro, nuclear, and storage are moving at different speeds across regions. In the U.S., EIA forecast summer 2026 electricity generation to rise 3%, with solar up 19%, wind up 10%, coal down 2%, and natural gas broadly stable.
Demand concentration can create planning risk. IEA projects data center electricity generation needs to rise from 460 TWh in 2024 to over 1,000 TWh in 2030 and 1,300 TWh in 2035. Power suppliers must manage location-specific load growth, grid congestion, and firm-capacity requirements.
Revenue Potential Analysis
Revenue Landscape Across
Revenue is spread across solar, wind, gas, coal, hydro, nuclear, battery storage, grid equipment, power services, and power purchase contracts. Renewable capacity additions reached a record 800 GW in 2025, with solar contributing about 75%. Battery storage additions rose around 40% to almost 110 GW.
Regional revenue is strongest where demand growth and investment pipelines are aligned. China is expected to account for nearly 50% of global electricity demand growth through 2030, while India is forecast to grow 6.4% annually and add over 570 TWh of annual consumption in five years.
Equipment and service revenue is expanding with thermal reliability and grid modernization. Siemens Energy reported Q2 FY2026 orders of EUR 17.7 billion, a book-to-bill ratio of 1.72, and backlog of EUR 154 billion. Strong orders from Gas Services and Grid Technologies show broad power-sector spending.
Financial Impact
Power generation creates financial value through electricity sales, capacity payments, ancillary services, long-term PPAs, grid reliability, and industrial power security. IEA expects global electricity consumption to reach 33,600 TWh by 2030, up from 28,200 TWh in 2025. This expands the revenue base for generation owners and service providers.
Financial returns depend on dispatch profile, fuel cost, equipment availability, transmission access, and project financing. In the EU, renewable generation is expected to exceed combined non-renewable generation by 2026, while renewables are forecast to reach 63% of electricity generation by 2030. This shifts returns toward low-emission assets.
The strongest financial impact is expected from solar-plus-storage, gas flexibility, nuclear life extension, grid-connected renewables, and data-center power supply. GE Vernova’s Q1 2026 adjusted EBITDA margin increased to 9.6%, while free cash flow rose to USD 4.8 billion, showing stronger cash conversion from power-sector demand.
Drivers Impact Analysis
The Power Generation Market is driven by rising electricity demand, industrial growth, urbanization, renewable energy deployment, grid modernization, and expanding electrification across transport, buildings, and manufacturing. Demand is increasing as countries need reliable power for data centers, factories, homes, electric vehicles, and digital infrastructure.
Asia Pacific leads the market due to large population, fast industrial expansion, rising urban electricity use, and strong investment in coal, gas, solar, wind, hydro, and nuclear power assets. China, India, Japan, South Korea, and Southeast Asia remain major contributors because of growing power consumption and large-scale generation capacity additions.
Impact Factor | Estimated CAGR Impact | Regional Relevance | Market Impact |
|---|---|---|---|
Rising electricity consumption | +2.3% | Asia Pacific, North America, Europe | Drives core generation demand. |
Industrial and manufacturing expansion | +2.0% | China, India, Southeast Asia | Supports baseload power needs. |
Renewable energy capacity growth | +1.8% | Global power markets | Adds clean generation capacity. |
Electrification of transport and buildings | +1.4% | Developed and emerging markets | Increases long-term demand. |
Grid modernization and storage integration | +1.1% | Asia Pacific, Europe, North America | Improves power reliability. |
Restraints Impact Analysis
The market faces restraints from high capital investment, fuel price volatility, regulatory delays, grid connection constraints, and environmental compliance costs. Power projects require long planning cycles, large financing, land access, permits, and strong transmission links.
Another restraint is the transition pressure on fossil fuel-based generation. Coal and gas plants remain important for reliability in many regions, but operators face stricter emission rules, carbon costs, and pressure to improve efficiency or shift toward cleaner power sources.
Impact Factor | Estimated CAGR Impact | Regional Relevance | Market Impact |
|---|---|---|---|
High project capital cost | -1.1% | Global power developers | Slows project execution. |
Fuel price volatility | -0.9% | Gas and coal-based markets | Pressures generation economics. |
Grid connection bottlenecks | -0.8% | Renewable-heavy markets | Delays capacity addition. |
Environmental compliance cost | -0.7% | Coal and gas power regions | Raises operating pressure. |
Policy and permitting uncertainty | -0.6% | Large infrastructure projects | Affects investor confidence. |
Opportunities Impact Analysis
Opportunities are strong in solar power, wind power, hydro upgrades, nuclear power, gas-fired flexible generation, energy storage, distributed power, and hybrid renewable systems. These areas benefit from rising power demand and the need for cleaner, more flexible electricity systems.
Higher-value opportunities are emerging in grid-scale batteries, green hydrogen-linked power, offshore wind, small modular reactors, carbon capture for thermal plants, and AI-supported power plant management. Companies that provide reliable, lower-emission, and flexible generation assets can capture stronger long-term demand.
Impact Factor | Estimated CAGR Impact | Regional Relevance | Market Impact |
|---|---|---|---|
Solar and wind capacity expansion | +2.2% | Asia Pacific, Europe, North America | Builds clean power supply. |
Grid-scale energy storage | +1.8% | Renewable-heavy markets | Supports power stability. |
Flexible gas-fired generation | +1.4% | Asia Pacific, North America, Middle East | Balances intermittent renewables. |
Nuclear and SMR development | +1.2% | Europe, U.S., China, Japan | Adds firm low-carbon power. |
Hybrid renewable power projects | +1.0% | India, China, Australia, U.S. | Improves utilization and reliability. |
Challenges Impact Analysis
The main challenge is balancing reliability, affordability, and decarbonization. Power systems must meet rising demand while reducing emissions, keeping electricity prices manageable, and avoiding supply shortages.
Another challenge is transmission capacity. Many renewable power projects are located far from demand centers, so weak grid infrastructure can reduce project value and delay commercial operation.
Impact Factor | Estimated CAGR Impact | Regional Relevance | Market Impact |
|---|---|---|---|
Balancing reliability with decarbonization | -1.0% | Global power markets | Increases planning complexity. |
Transmission infrastructure limitations | -0.9% | Asia Pacific, Europe, North America | Delays new capacity use. |
Managing renewable intermittency | -0.8% | Solar and wind-heavy grids | Requires storage and backup. |
Financing large-scale power assets | -0.7% | Emerging and capital-intensive markets | Slows expansion. |
Aging power plant and grid assets | -0.6% | Developed markets | Raises replacement needs. |
Segment Covered in the Report
By Type
Conventional/Non-Renewable (Nuclear and Fossil Fuels)
Non-Conventional/Renewable (Solar, Wind, Hydro, and Others)
By End-User
Residential
Commercial
Industrial
Others
By Region
North America
Europe
Asia Pacific
Latin America
Middle East and Africa
Market Trend Analysis
The market trend is moving toward renewable power, flexible generation, distributed energy, battery storage, nuclear revival, digital power plants, and lower-emission thermal generation. Utilities and independent power producers are shifting portfolios toward cleaner and more flexible assets.
Asia Pacific remains the largest value region because electricity demand is still expanding quickly across industrial, commercial, and residential users. North America and Europe support value growth through renewable integration, grid upgrades, nuclear life extensions, and digital energy infrastructure.
Impact Factor | Estimated CAGR Impact | Regional Relevance | Market Impact |
|---|---|---|---|
Renewable power generation expands | +2.1% | Asia Pacific, Europe, North America | Leads new capacity growth. |
Battery storage integration increases | +1.7% | Solar and wind-heavy markets | Improves grid flexibility. |
Digital power plant management grows | +1.3% | Developed and large utility markets | Improves efficiency. |
Nuclear power gains renewed interest | +1.1% | Europe, China, Japan, U.S. | Supports firm clean energy. |
Distributed generation adoption rises | +0.9% | Urban and industrial users | Adds localized supply. |
Investor Type Impact Matrix
Investors should focus on power generation companies with diversified assets, strong project pipelines, grid access, fuel security, renewable exposure, and storage integration capability. Reliability, permitting strength, capital discipline, and long-term power purchase agreements are key success factors.
Strategic investors can also target renewable developers, battery storage companies, gas power operators, nuclear technology firms, digital power plant providers, and transmission-linked generation platforms. Companies that combine clean generation with reliable dispatch and grid integration are better positioned for long-term growth.
Investor Type | Estimated CAGR Impact | Regional Relevance | Market Impact |
|---|---|---|---|
Renewable Power Developers | +1.9% | Global | Expands clean generation capacity. |
Utility and Independent Power Producers | +1.5% | Asia Pacific, Europe, North America | Supports large-scale electricity supply. |
Battery Storage Companies | +1.3% | Renewable-heavy markets | Improves grid flexibility. |
Gas and Flexible Power Operators | +1.0% | Global reliability markets | Balances variable generation. |
Strategic Energy Infrastructure Investors | +0.8% | Global power markets | Funds capacity and modernization. |
Recent Developments
May 2026: American Electric Power said it planned USD 78 billion of investment from 2026 to 2030, while maintaining roughly 32,000 MW of owned and contracted generating capacity across its regulated service territory.
March 2026: Listed Huaneng subsidiary Huaneng Power International added 11,924 MW of capacity in 2025, including 7,731 MW from new energy sources, expanding wind and solar generation within its low-carbon portfolio base.
February 2026: Its Norges Bank co-investment alliance reached 1,500 MW of operating renewable capacity in Spain, supported by Caparacena and Ciudad Rodrigo photovoltaic plants added to the joint portfolio during the renewable portfolio expansion cycle.
Research Methodology
Methodology Area | Coverage Details |
|---|---|
Primary Research | Interviews with manufacturers, suppliers, distributors, consultants, procurement teams, and industry experts. |
Secondary Research | Company filings, annual reports, regulatory databases, government publications, trade associations, and verified industry sources. |
Data Validation | Cross-verification through source triangulation, historical trend review, demand-side checks, and supply-side assessment. |
Market Estimation | Bottom-up and top-down analysis based on product demand, regional consumption, company presence, and application-level usage. |
Forecasting Approach | Forecasts based on regulatory shifts, infrastructure investment, technology adoption, pricing trends, industrial expansion, and end-use demand. |
Quality Review | Analyst review, peer validation, outlier checks, internal consistency review, and final publication approval. |
AI Policy | AI is not used as a primary data source. All published insights are reviewed against human-verified evidence. |
Competitive Landscape
The market is characterized by intense competition among established players and emerging companies. Strategic partnerships, mergers and acquisitions, and product innovation are key strategies employed by market participants.
Key Market Players
Reliance Power (India)
Iberdrola (Spain)
NextEra Energy Inc (U.S.)
American Electric Power (U.S.)
China Huaneng Group Co Ltd (China)
China Datang Corp (China)
Kansai Electric Power Company (Japan)
NTPC Limited (India)
China Energy Investment Corporation (China)
Engie (France)
State Grid Corporation of China (China)
Enel (Italy)
EDF Energy (France)
TEPCO (Japan)
KEPCO (South Korea)
Other Key Players
Meet the Team
This report was prepared by our expert analysts with deep industry knowledge and research experience.
Pratiksha is market research analyst with strong experience in industry research, market forecasting, and competitive analysis. She specializes in identifying market trends, evaluating growth opportunities, and preparing data-driven insights across global industries. Her work supports businesses in understanding market dynamics, customer demand, regional opportunities, and strategic investment areas.
Sayali brings more than 5 years of experience to Globe Market Research, supporting the accuracy, clarity, and relevance of research content across multiple industries. She reviews market data, segment analysis, competitive insights, and industry trends to ensure each report meets strong quality standards and provides practical value to business decision-makers. Her expertise spans healthcare, information technology, consumer goods, and diverse cross-industry domains. With a strong focus on data reliability, structured analysis, and clear presentation, Sayali helps ensure that each research output delivers well-reviewed insights for clients, investors, consultants, and industry stakeholders.
Frequently Asked Questions
Related Reports
More in Energy and Power
Small Wind Turbine Market to Hit USD 17.9 Billion by 2035
Small Wind Turbine Market Size, Share, Analysis By Axis Type (Horizontal Axis Wind Turbines and Vertical Axis Wind Turbines), By Capacity Rating (0 To 5 KW, 6 To 20 KW, and 21-100 KW), By Connectivity (Off-Grid, On-Grid, and Hybrid), By Installation Location (Rooftop/Building-Integrated and Freestanding Tower), By Application (Residential, Commercial, and Others), By Regional Insights, Business plan and Project Report, Investment Opportunities, Profitability, Industry Trends, Leading Companies and Growth Forecasts by 2025-2035
Hydropower Generation Market to Hit USD 560.9 Billion by 2035
Hydropower Generation Market Size, Share, Analysis By Plant Type (Large Hydropower Plant, Small Hydropower Plant, Pumped Storage Hydropower), By Application (Utility, Industrial, Rural Electrification), By Regional Insights, Business plan and Project Report, Investment Opportunities, Profitability, Industry Trends, Leading Companies and Growth Forecasts by 2025-2035
Single Phase String Inverters Market to Hit USD 5.1 Billion by 2035
Single Phase String Inverters Market Size, Share, Analysis By Connectivity (On-Grid, Off-Grid), By Power Rating (Below 1 kW, 1 kW to 3 kW, 3 kW to 5 kW, Above 5 kW), By Application (Residential, Commercial), By Regional Insights, Business plan and Project Report, Investment Opportunities, Profitability, Industry Trends, Leading Companies and Growth Forecasts by 2025-2035
Hydrogen Fuel Cells Market to Hit USD 70.2 Billion by 2035
Hydrogen Fuel Cells Market Size, Share, Analysis By Type (Air-Cooled Type, Water-Cooled Type), By Application (Stationary, Transport, Portable), By Regional Insights, Business plan and Project Report, Investment Opportunities, Profitability, Industry Trends, Leading Companies and Growth Forecasts by 2025-2035