

Revenue, 2025
$ 12.8 Bn
Forecast, 2035
$ 64.2 Bn
CAGR, 2025-2035
17.5%
Report Coverage
Global
Market Size and Forecast
The Global Solar Tracker Market reached USD 12.8 billion in 2025 and is expected to grow to USD 64.2 billion by 2035, registering a CAGR of 17.5% from 2025 to 2035. The growth of the market can be attributed to rising utility-scale solar installations, increasing demand for higher energy yield, and wider adoption of single-axis and dual-axis tracking systems that improve solar panel efficiency compared to fixed-tilt structures.
North America held the largest regional share of 39.7% in 2025, supported by strong solar project development, favorable clean energy policies, and large-scale investment in renewable power generation across the U.S. and Canada. The region’s growth is further driven by demand for grid-scale solar farms, declining solar technology costs, and growing use of advanced tracker systems with real-time monitoring, wind protection, and automated positioning features.
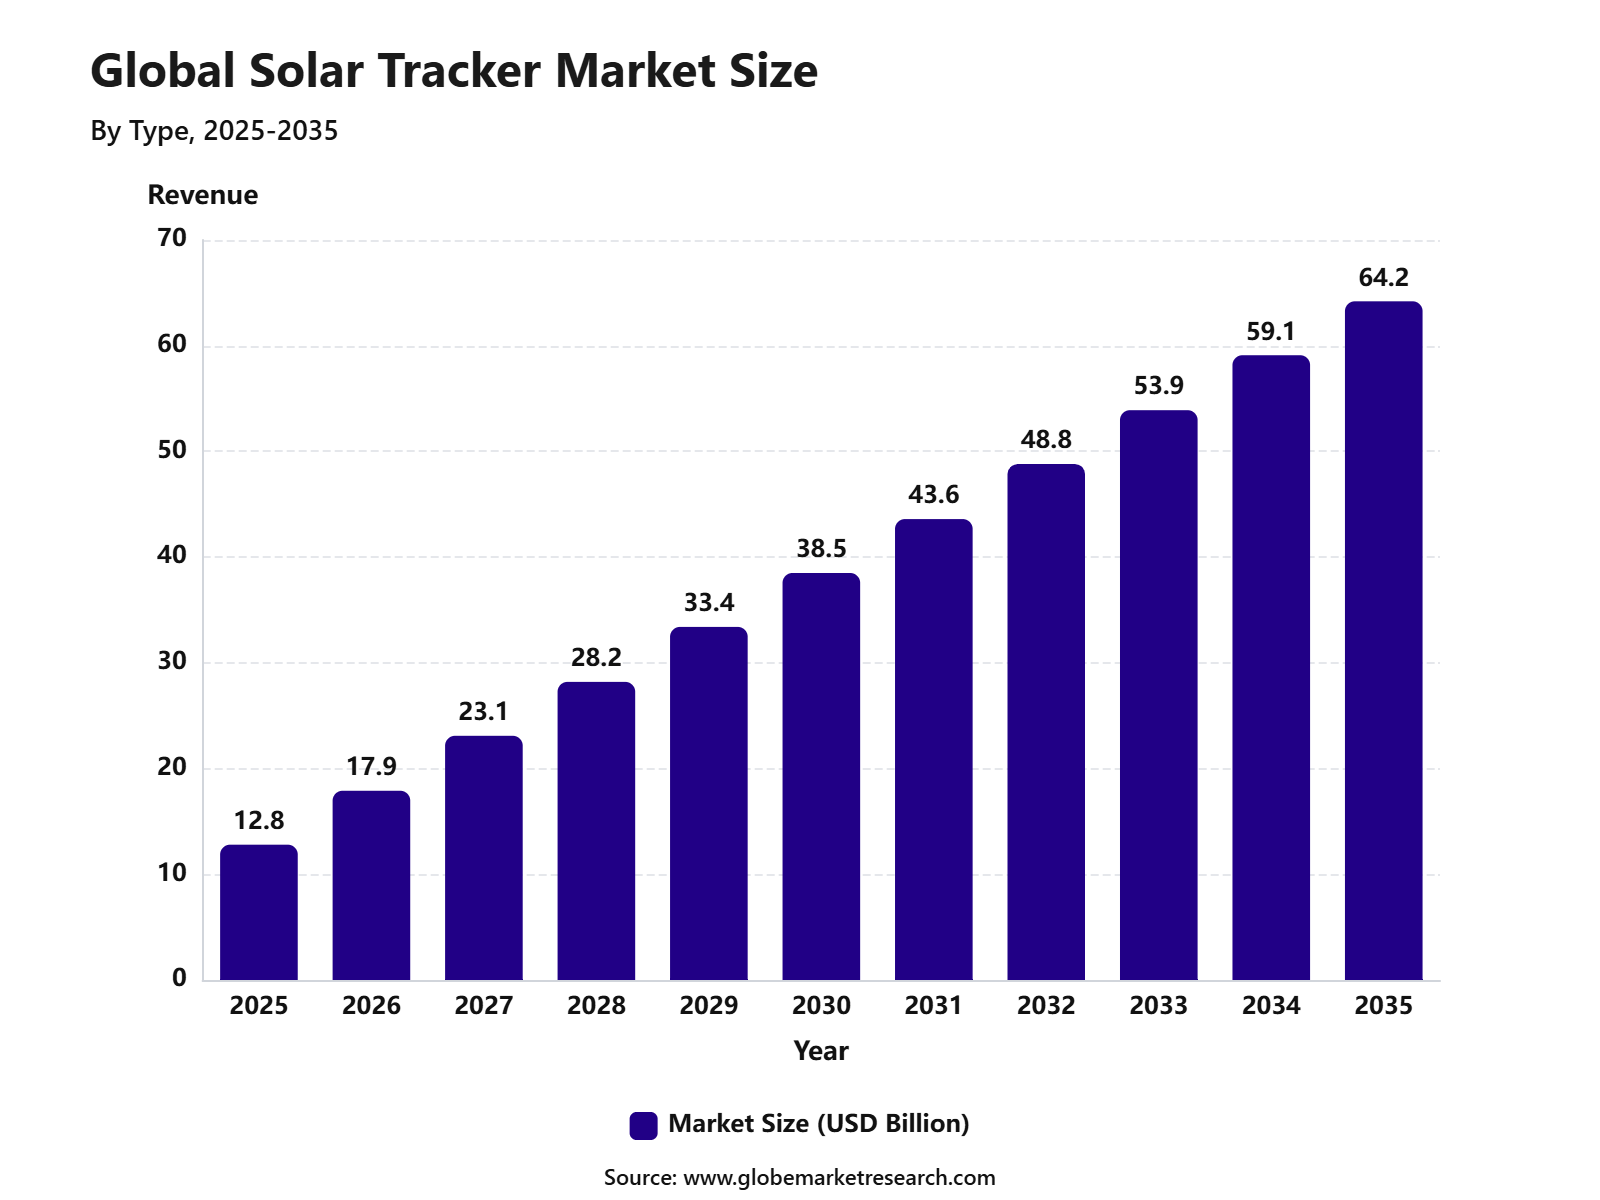 iThe graph shows projected market growth until 2035 based on CAGR analysis. Actual outcomes may vary depending on changing demand, competition, and economic factors.To gain greater insights - request a sample report PDF
The market outlook remains strong as solar project developers continue to focus on higher energy yield and better land-use efficiency. Growth can be attributed to rising solar capacity additions, declining solar equipment costs, and increasing preference for tracking systems that improve plant performance. The expansion of utility-scale solar farms, energy transition programs, and corporate renewable power procurement is expected to support long-term demand for solar trackers.
Key Market Insights
Single axis trackers led the type segment with 88.4% share, supported by lower installation complexity, cost efficiency, and strong use in large-scale solar projects.
Photovoltaic technology accounted for 92.1% share, driven by wide adoption of PV solar systems, rising utility-scale installations, and improving solar energy output.
Utility applications held 84.3% share, supported by large solar farms, grid-connected renewable power projects, and growing investment in clean energy generation.
North America held 39.7% share of the solar tracker market, supported by strong utility-scale solar deployment, favorable renewable energy policies, and rising demand for higher solar power efficiency.
Government Initiatives for the Solar Tracker Market
Government initiatives are supporting the solar tracker market through wider solar PV deployment targets, clean energy auctions, tax credits, domestic manufacturing programs, grid modernization, and faster project approvals. Solar trackers are not usually funded as a separate product category, but they gain direct demand when large ground-mounted solar projects are promoted. This is important because utility-scale solar represented 57% of global solar PV capacity additions in 2023, making it the strongest application base for tracker systems.
Renewable Energy Targets and Solar Capacity Expansion
Government renewable energy targets are one of the strongest indirect drivers for solar tracker adoption. As countries increase the share of solar power in their electricity mix, developers are pushed to improve generation output from each project site. Solar trackers help by increasing panel exposure to sunlight, improving plant yield, and supporting better land-use efficiency in large-scale solar farms.
The policy impact can be seen in global solar deployment. IRENA reported that renewable power capacity increased by 692 GW in 2025, while solar energy added 511 GW, representing the largest share of new renewable capacity. This scale of solar addition supports strong demand for tracker systems, especially in high-irradiance locations and utility-scale project pipelines.
Tax Credits and Investment Incentives
Tax credits and capital incentives improve the commercial case for solar trackers by reducing the cost burden of utility-scale solar projects. Investment tax credits, production tax credits, accelerated depreciation, and clean energy financing programs can make tracker-based solar plants more attractive than fixed-tilt systems in suitable locations. These incentives are especially useful when developers are focused on maximizing electricity output over the full project life.
In the U.S., clean energy tax policy includes incentives for solar and related components. The Advanced Manufacturing Production Tax Credit includes eligible clean energy components, while the Advanced Energy Project Credit can cover 30% of qualified investment costs for projects meeting labor requirements. These measures support solar project development and strengthen domestic supply chains for tracker-related equipment.
Type Analysis
Single axis trackers led the Solar Tracker Market with 88.4% share, supported by their strong use in utility-scale solar projects. These systems rotate solar panels along one axis to follow the sun’s movement during the day, improving energy output compared with fixed-tilt systems. The growth of this segment can be attributed to its balance of higher power generation, lower mechanical complexity, and better cost efficiency than dual-axis systems.
Single axis trackers are especially suitable for large solar farms where land availability, project economics, and energy yield are important. Single axis trackers are expected to remain the preferred technology for large ground-mounted projects. Demand will continue to be supported by utility-scale PV expansion, rising power demand, solar-plus-storage projects, and efforts to improve project-level energy generation.
Technology Analysis
Photovoltaic technology accounted for 92.1% share, making it the leading technology segment in the Solar Tracker Market. PV tracker systems are widely used because they can improve module exposure to sunlight and increase electricity generation across the operating day.
The dominance of PV technology is supported by rapid growth in solar module deployment and falling PV system costs. Solar PV has become one of the main sources of new renewable power capacity, and tracker systems help project developers improve generation from the same installed capacity.
Photovoltaic tracker demand is expected to remain strong as developers focus on project efficiency, power output, and return on investment. Growth will also be supported by bifacial modules, high-efficiency panels, utility-scale projects, and large renewable procurement by utilities and corporate buyers.
Application Analysis
Utility applications led the Solar Tracker Market with 84.3% share, supported by strong adoption in large-scale solar power plants. Utility projects require high energy yield, efficient land use, and predictable output, which makes tracker systems attractive for developers and power producers.
The growth of this segment can be linked to rising electricity demand, renewable energy targets, and grid-scale solar project development. Trackers are used in utility projects to increase generation, improve plant economics, and support long-term power purchase agreements.
Utility-scale demand is expected to remain the main growth driver for solar trackers. Opportunities are likely to remain strong in desert solar farms, large grid-connected PV plants, solar-plus-storage projects, and renewable projects serving data centers, industrial users, and public utilities.
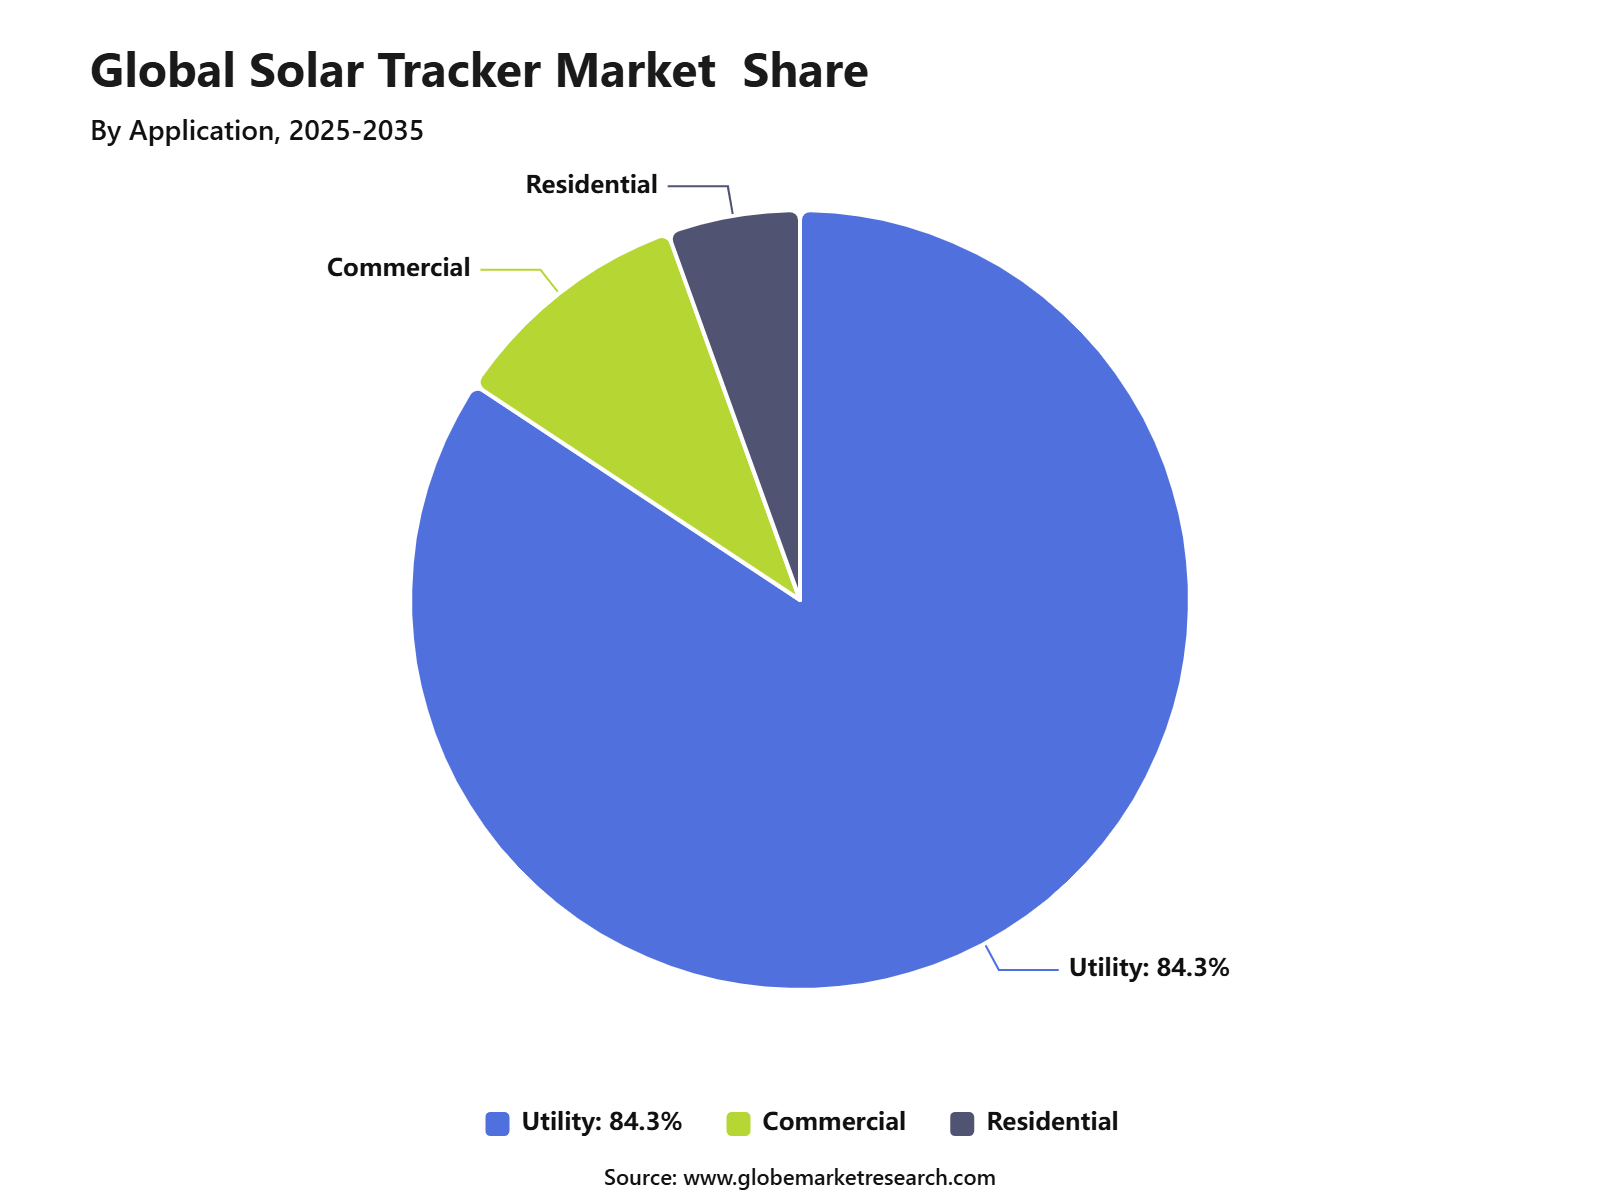 iThe graph shows projected market growth until 2035 based on CAGR analysis. Actual outcomes may vary depending on changing demand, competition, and economic factors.To gain greater insights - request a sample report PDF
Regional Analysis
North America led the Solar Tracker Market with 39.7% share, supported by strong utility-scale solar deployment, large land availability, advanced project development capability, and high adoption of tracking systems in ground-mounted solar projects. The region has a mature solar project ecosystem with strong participation from utilities, independent power producers, and corporate energy buyers. The growth of North America is supported by rising electricity demand, solar investment, and demand for higher project efficiency.
In the U.S., solar and storage continued to represent a major part of new power capacity additions in 2025, and tracker systems remained important for improving generation from utility-scale PV assets. North America is expected to remain a leading regional market as large solar projects continue to support clean power procurement and grid expansion. Future opportunities are likely to be seen in single axis trackers, PV tracking systems, utility solar farms, bifacial module integration, and solar-plus-storage projects.
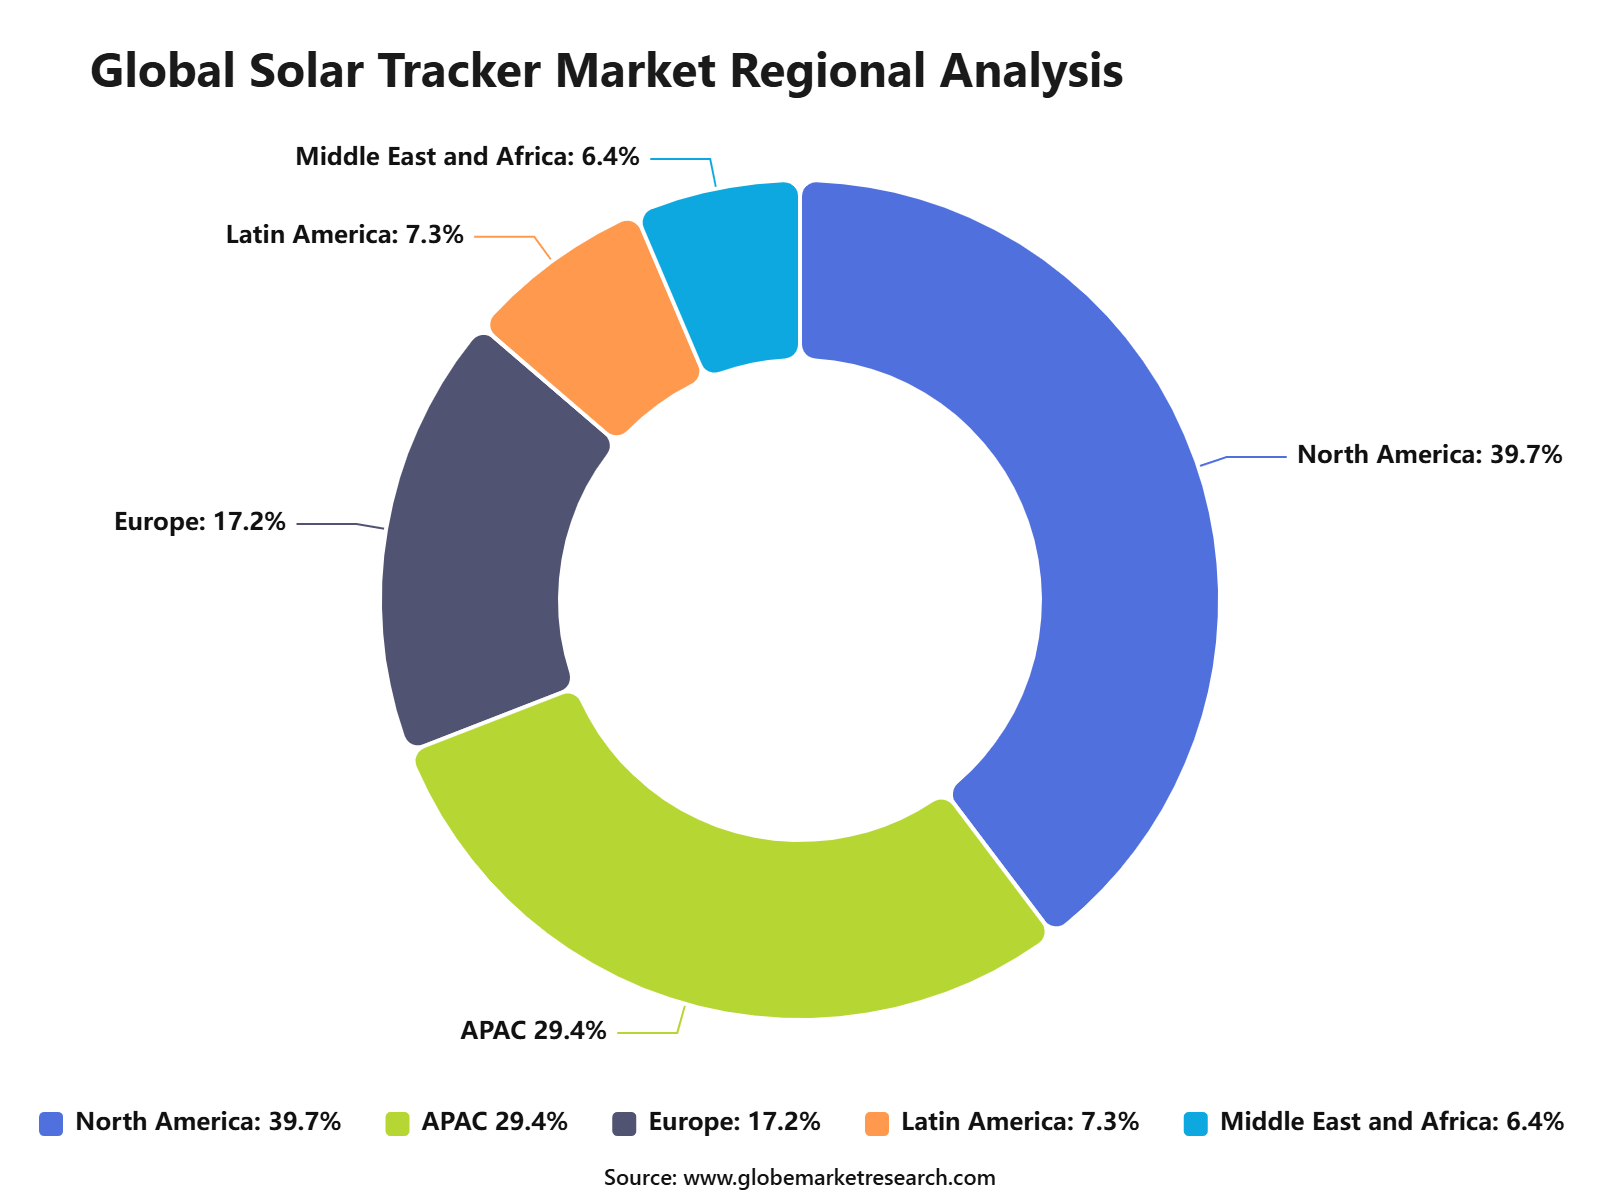 iThe graph shows projected market growth until 2035 based on CAGR analysis. Actual outcomes may vary depending on changing demand, competition, and economic factors.To gain greater insights - request a sample report PDF
Regional Impact Analysis
Impact Factor | Estimated CAGR Impact | Regional Relevance | Market Impact |
|---|---|---|---|
North America market leadership | +5.0% | North America, 39.7% share in 2025 | Leads utility deployment. |
U.S. solar project pipeline | +4.1% | United States | Drives tracker installations. |
Asia Pacific solar capacity growth | +3.5% | China, India, Australia, Japan | Builds future demand. |
Europe renewable transition | +2.8% | Germany, Spain, Italy, France | Supports solar adoption. |
Middle East high-irradiance projects | +2.1% | UAE, Saudi Arabia, Qatar | Improves tracker value. |
The U.S. solar tracker market is estimated at USD 2.9 billion in 2025 and, with a CAGR of 27.5%, is projected to reach approximately USD 32.9 billion by 2035. This strong growth is supported by rising utility-scale solar installations, higher demand for solar efficiency, and wider use of single-axis tracking systems. The market outlook remains positive as solar developers focus on improving power generation and reducing long-term energy costs.
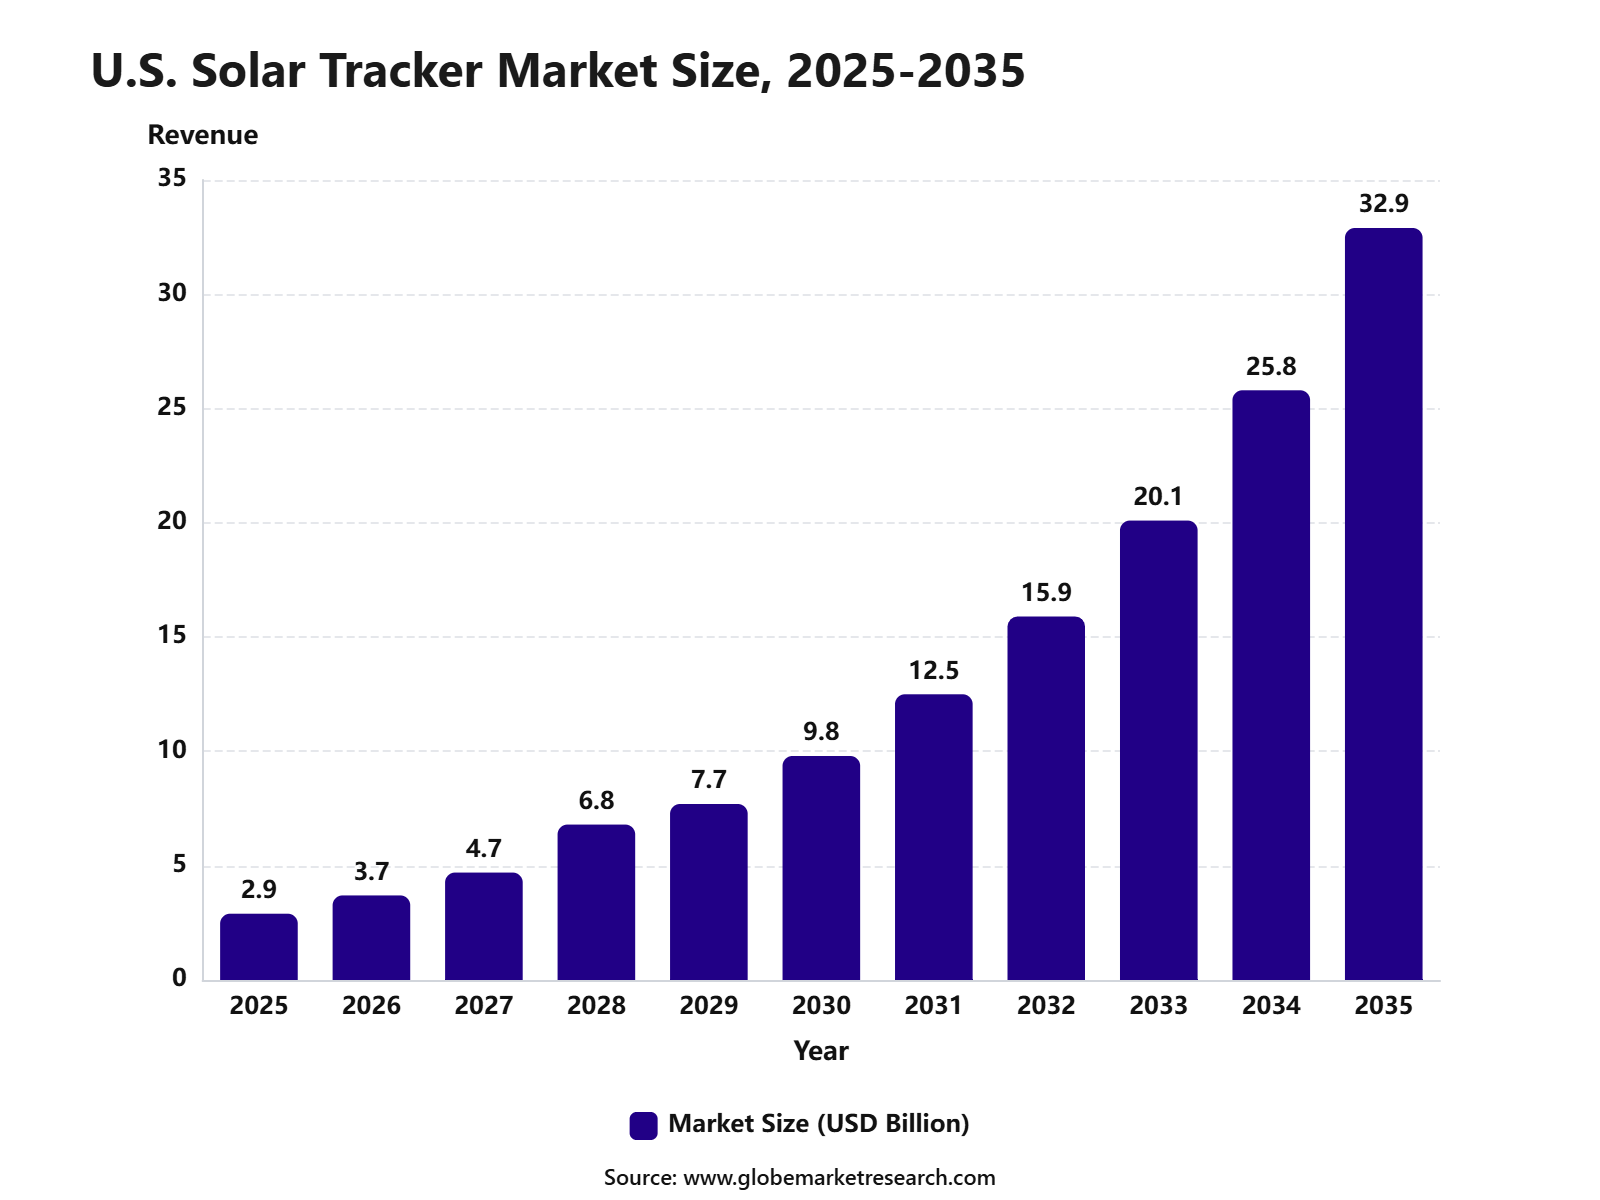 iThe graph shows projected market growth until 2035 based on CAGR analysis. Actual outcomes may vary depending on changing demand, competition, and economic factors.To gain greater insights - request a sample report PDF
Customer Acquisition Economics
Customer acquisition in the solar tracker market is mainly influenced by project bankability, energy yield improvement, field performance, warranty strength, and EPC relationships. Utility-scale solar developers do not select tracker suppliers only on equipment price, as the system must support long project life, high wind loads, terrain variation, module compatibility, and fast installation. This makes technical validation, reference projects, and owner-engineer approval important parts of the sales process.
The sales cycle is project-based and often starts before final investment approval. Tracker vendors must work with developers, EPC contractors, independent engineers, utilities, and financiers to prove that the system can improve energy output while controlling installation and maintenance costs. The U.S. solar industry installed 7.8 GWdc of new capacity in Q1 2026, and utility-scale solar accounted for 5.9 GWdc, showing that large ground-mounted projects remain the main customer base for tracker suppliers.
Customer acquisition costs can be high because suppliers must provide engineering support, layout optimization, wind studies, terrain analysis, logistics planning, and after-sales service. However, retention improves once a tracker platform is approved by major EPCs and developers. This is because repeat use reduces design risk, shortens procurement time, and allows contractors to standardize installation teams across multiple solar projects.
Revenue Potential Analysis
Revenue Landscape Across
Revenue potential is strongest in utility-scale photovoltaic projects, large commercial solar farms, solar-plus-storage projects, and high-irradiance regions where tracking can raise generation output. Developers in the U.S. plan to add 43.4 GW of utility-scale solar capacity in 2026, representing 51% of all planned new utility-scale power capacity additions. Texas alone accounts for 40% of planned new U.S. utility-scale solar capacity in 2026, creating a strong opportunity for tracker suppliers with proven wind-resilient and desert-ready systems.
The market opportunity is also supported by global solar growth. The IEA reported that renewable capacity additions reached a record 800 GW in 2025, with solar contributing 75% of that total. Solar PV generation increased by 600 TWh in 2025, the largest one-year electricity generation increase by any source outside post-crisis recovery periods. This supports tracker demand because utility-scale solar remains a central part of new power capacity planning.
Single-axis trackers are becoming the preferred system for large U.S. projects. Lawrence Berkeley National Laboratory data cited by Saur Energy indicated that 99% of new U.S. utility-scale solar capacity in 2024 used trackers, while single-axis tracking added more than five percentage points to capacity factors in regions with strong solar resources. This shows that tracker demand is tied to energy yield, land productivity, and project-level return rather than hardware adoption alone.
Financial Impact
The financial impact of solar trackers is mainly created through higher electricity generation per installed capacity. In utility-scale projects, a tracker can improve project economics by increasing output during morning and evening hours, supporting stronger power purchase agreement performance and better land use. This is important in markets where grid congestion and midday solar saturation make generation timing more valuable.
Tracker suppliers can also gain revenue from hardware, control systems, software, commissioning support, spare parts, preventive maintenance, and long-term service agreements. Projects with advanced control software, terrain-following design, and weather response systems can create higher-value sales than basic mechanical tracker systems. Vendors with strong service networks are better placed to capture recurring revenue after installation.
System cost trends remain mixed. SEIA reported that U.S. utility-scale system pricing fell 3% year over year for both fixed-tilt and single-axis tracking systems in Q1 2026, helped by lower module prices. At the same time, commercial equipment costs for electrical and structural balance-of-system rose 60% year over year, showing that steel, aluminum, and structural component pricing can still affect tracker economics.
Market Trend Analysis
Impact Factor | Estimated CAGR Impact | Regional Relevance | Market Impact |
|---|---|---|---|
Single-axis trackers dominate adoption | +4.5% | Global utility solar projects | Supports efficient generation. |
Photovoltaic technology remains core | +4.0% | North America, Asia Pacific, Europe | Drives tracker integration. |
Utility applications lead demand | +3.7% | U.S., China, India, Middle East | Expands project scale. |
Bifacial solar modules with trackers | +3.0% | High-sunlight regions | Increases energy yield. |
AI-enabled tracker optimization | +2.3% | Developed solar markets | Improves performance control. |
Investor Type Impact Matrix
Investor Type | Estimated CAGR Impact | Regional Relevance | Market Impact |
|---|---|---|---|
Solar Tracker Manufacturers | +4.1% | Global | Expands system capacity. |
Renewable Energy Developers | +3.8% | North America, Asia Pacific, Europe | Drives project adoption. |
Utility Companies | +3.2% | U.S., Europe, Asia Pacific | Supports grid-scale solar. |
Infrastructure Investors | +2.7% | Solar project markets | Funds long-term assets. |
Technology and Automation Providers | +2.3% | Developed solar markets | Improves tracker performance. |
Segment Covered in the Report
By Type
Single Axis
Dual Axis
By Technology
Photovoltaic
Concentrated Solar Power
By Application
Utility
Commercial
Residential
By Region
North America
Europe
Asia Pacific
Latin America
Middle East and Africa
Drivers Impact Analysis
Impact Factor | Estimated CAGR Impact | Regional Relevance | Market Impact |
|---|---|---|---|
Rising utility-scale solar installations | +4.6% | North America, Asia Pacific, Europe | Drives tracker demand. |
Higher energy yield from tracking systems | +4.0% | High-irradiance solar regions | Improves project returns. |
Growth in renewable energy targets | +3.5% | U.S., Europe, China, India | Supports solar expansion. |
Falling solar project costs | +3.0% | Global | Improves adoption feasibility. |
Increasing demand for grid-scale clean power | +2.6% | North America, Middle East, Asia Pacific | Expands large projects. |
Restraints Impact Analysis
Impact Factor | Estimated CAGR Impact | Regional Relevance | Market Impact |
|---|---|---|---|
Higher upfront cost than fixed-tilt systems | -2.1% | Emerging solar markets | Limits price-sensitive adoption. |
Maintenance needs for moving components | -1.7% | Utility and remote projects | Raises operating costs. |
Land and terrain limitations | -1.4% | Mountainous and dense regions | Restricts deployment. |
Supply chain volatility for steel and electronics | -1.2% | Global manufacturers | Pressures margins. |
Installation complexity in harsh climates | -1.0% | Desert, snow, and high-wind zones | Increases project risk. |
Opportunities Impact Analysis
Impact Factor | Estimated CAGR Impact | Regional Relevance | Market Impact |
|---|---|---|---|
Expansion of single-axis solar trackers | +4.3% | North America, Asia Pacific, Middle East | Leads large-scale adoption. |
Growth in utility solar projects | +3.9% | U.S., India, China, Brazil, GCC | Builds long-term demand. |
Demand for bifacial module compatibility | +3.3% | North America, Europe, Asia Pacific | Improves energy output. |
Solar-plus-storage project growth | +2.8% | U.S., Australia, Europe, Middle East | Strengthens project value. |
Digital tracker control systems | +2.4% | Developed solar markets | Improves performance accuracy. |
Challenges Impact Analysis
Impact Factor | Estimated CAGR Impact | Regional Relevance | Market Impact |
|---|---|---|---|
Managing wind and weather-related failures | -1.8% | North America, Middle East, coastal regions | Affects system reliability. |
Ensuring long-term tracker durability | -1.5% | Global utility projects | Impacts lifecycle returns. |
Project delays from permitting and grid connection | -1.3% | U.S., Europe, India | Slows installation schedules. |
Balancing cost with energy gain | -1.1% | Price-sensitive markets | Affects buyer decisions. |
Skilled installation workforce gaps | -0.9% | Emerging solar regions | Delays deployment quality. |
Recent Developments
In June 2026, Nextpower, formerly Nextracker, launched the reimagined NX Gemini 2P tracker and NX Anchor foundation system for Europe. NX Anchor targets up to 70.0% less embedment depth and 20% faster installation.
In March 2026, TrinaTracker signed an agreement with a Spanish EPC to supply 360 MW of solar tracking systems for two PV projects in Spain, deploying about 11,000 Vanguard 1P single-axis trackers.
In February 2026, PVH Australia developed a tracker supply chain with 95.0% Australian-made steel. Critical components, including piles, torque tubes, motor brackets, and splices, are produced locally for audit-ready utility-scale projects.
Report Scope
Report Highlights | Details |
|---|---|
Market Revenue (2025) | USD 12.8 Billion |
Forecast Revenue (2035) | USD 64.2 Billion |
CAGR (2025-2035) | 17.5% |
Base Year for Estimation | 2025 |
Historic Data | 2020-2024 |
Forecast Period | 2025-2035 |
Report Coverage | AI market impact analysis, market surveys, trade analysis, Industry & competitive intelligence, Revenue projections, company positioning, competitive analysis, growth drivers, and emerging market trends, Strategic Consultation & Advisory Services |
Segments Covered | By Type (Single Axis, Dual), By Technology (Photovoltaic, Concentrated Solar Power), By Application (Utility, Commercial, Residential) |
Regional Analysis | North America - US, Canada; Europe - Germany, France, The UK, Spain, Italy, Russia, Netherlands, Rest of Europe; Asia Pacific - China, Japan, South Korea, India, New Zealand, Singapore, Thailand, Vietnam, Rest of Latin America; Latin America - Brazil, Mexico, Rest of Latin America; Middle East & Africa - South Africa, Saudi Arabia, UAE, Rest of MEA |
Key companies profiled | Nextracker, Trina Tracker, Array Technologies, PV Hardware, Antai Solar, Soltec, Arctech Solar, GameChange Solar, FTC Solar, Ideematec |
Customization Scope | Tailored insights for specific regions, countries, and market segments can be provided. Additional report customization is available upon request. |
Competitive Landscape
The market is characterized by intense competition among established players and emerging companies. Strategic partnerships, mergers and acquisitions, and product innovation are key strategies employed by market participants.
Key Market Players
Nextracker
Trina Tracker
Array Technologies
PV Hardware
Antai Solar
Soltec
Arctech Solar
GameChange Solar
FTC Solar
Ideematec
Meet the Team
This report was prepared by our expert analysts with deep industry knowledge and research experience.
Pratiksha is market research analyst with strong experience in industry research, market forecasting, and competitive analysis. She specializes in identifying market trends, evaluating growth opportunities, and preparing data-driven insights across global industries. Her work supports businesses in understanding market dynamics, customer demand, regional opportunities, and strategic investment areas.
Sayali brings more than 5 years of experience to Globe Market Research, supporting the accuracy, clarity, and relevance of research content across multiple industries. She reviews market data, segment analysis, competitive insights, and industry trends to ensure each report meets strong quality standards and provides practical value to business decision-makers. Her expertise spans healthcare, information technology, consumer goods, and diverse cross-industry domains. With a strong focus on data reliability, structured analysis, and clear presentation, Sayali helps ensure that each research output delivers well-reviewed insights for clients, investors, consultants, and industry stakeholders.
Frequently Asked Questions
Related Reports
More in Energy and Power
Hydropower Generation Market to Hit USD 560.9 Billion by 2035
Hydropower Generation Market Size, Share, Analysis By Plant Type (Large Hydropower Plant, Small Hydropower Plant, Pumped Storage Hydropower), By Application (Utility, Industrial, Rural Electrification), By Regional Insights, Business plan and Project Report, Investment Opportunities, Profitability, Industry Trends, Leading Companies and Growth Forecasts by 2025-2035
Power Generation Market to Hit USD 2,539.5 Billion by 2035
Power Generation Market Size, Share, Analysis By Type (Conventional/Non-Renewable (Nuclear and Fossil Fuels), Non-Conventional/Renewable (Solar, Wind, Hydro, and Others)), By End-User (Residential, Commercial, Industrial, Others), By Regional Insights, Business plan and Project Report, Investment Opportunities, Profitability, Industry Trends, Leading Companies and Growth Forecasts by 2025-2035
Single Phase String Inverters Market to Hit USD 5.1 Billion by 2035
Single Phase String Inverters Market Size, Share, Analysis By Connectivity (On-Grid, Off-Grid), By Power Rating (Below 1 kW, 1 kW to 3 kW, 3 kW to 5 kW, Above 5 kW), By Application (Residential, Commercial), By Regional Insights, Business plan and Project Report, Investment Opportunities, Profitability, Industry Trends, Leading Companies and Growth Forecasts by 2025-2035
Hydrogen Fuel Cells Market to Hit USD 70.2 Billion by 2035
Hydrogen Fuel Cells Market Size, Share, Analysis By Type (Air-Cooled Type, Water-Cooled Type), By Application (Stationary, Transport, Portable), By Regional Insights, Business plan and Project Report, Investment Opportunities, Profitability, Industry Trends, Leading Companies and Growth Forecasts by 2025-2035