

Revenue, 2025
$59.7Bn
Forecast, 2035
$225.2Bn
CAGR, 2025-2035
14.2%
Report Coverage
Global
Market Size and Forecast
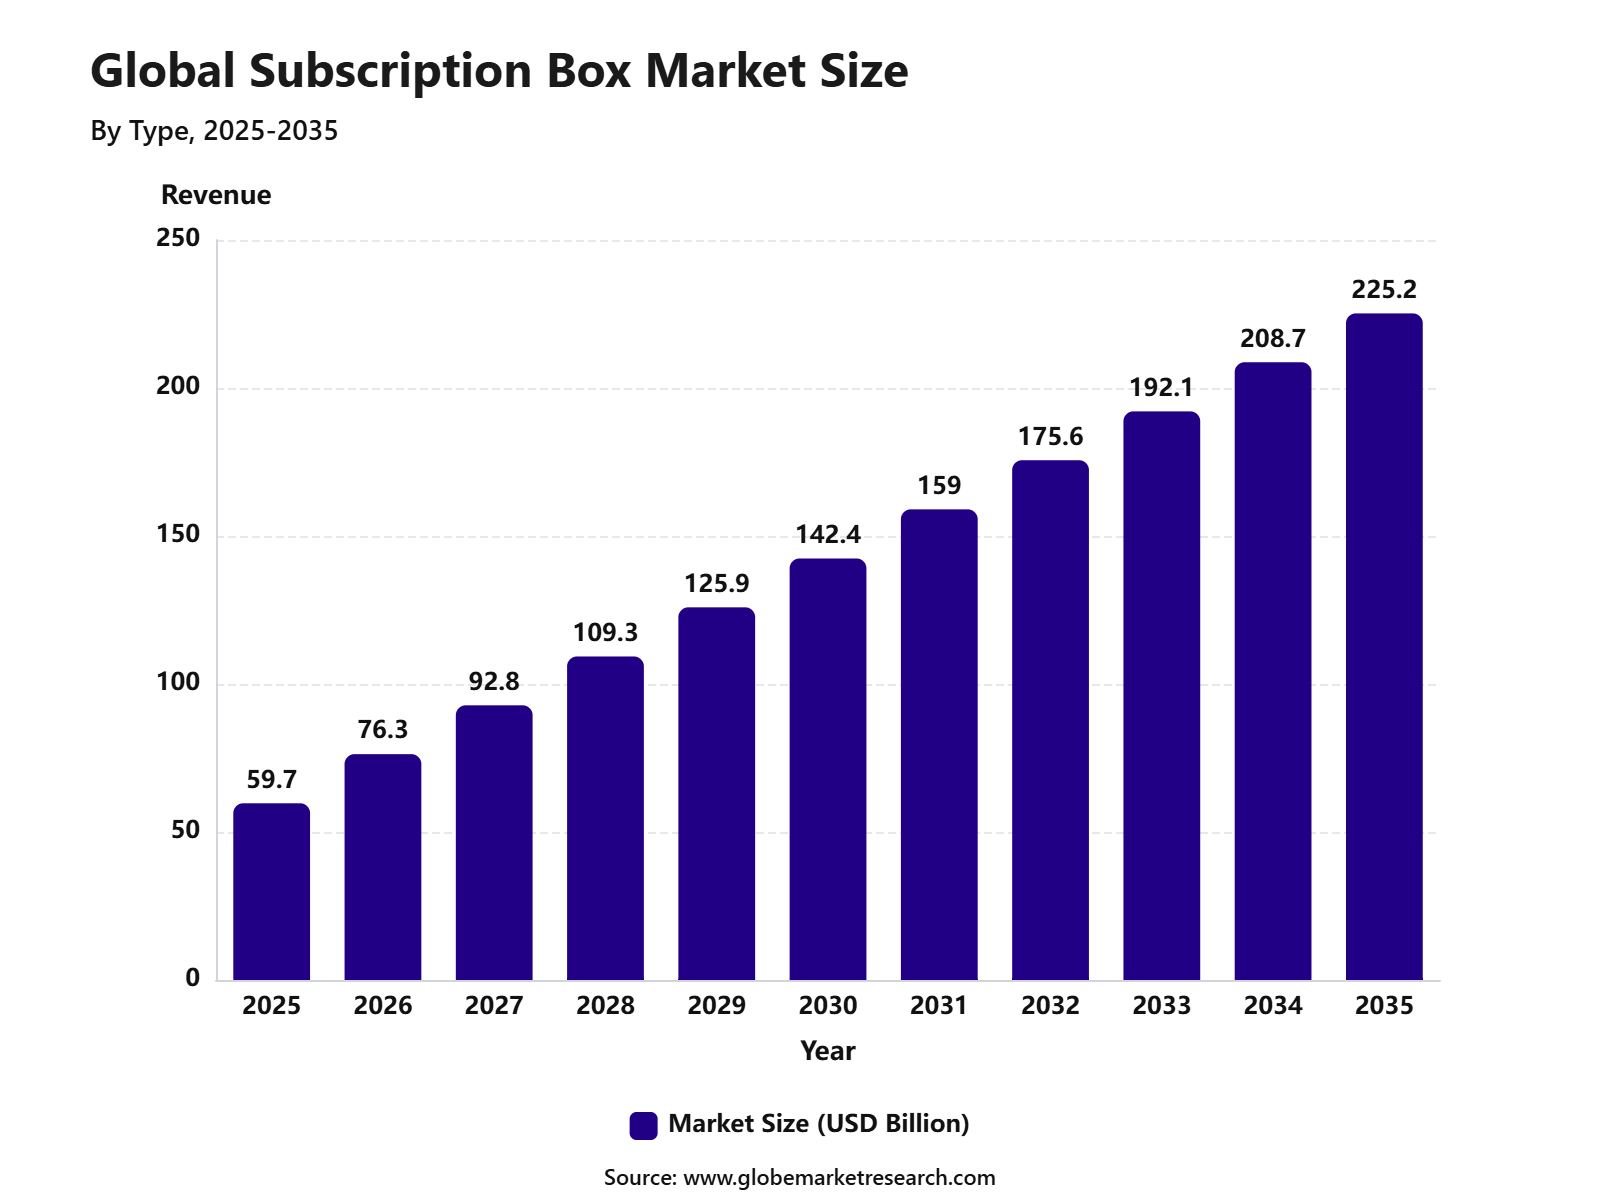
The Global Subscription Box Market was valued at USD 59.7 billion in 2025 and is projected to reach USD 225.2 billion by 2035, growing at a CAGR of 14.2% from 2025 to 2035. North America held the largest regional share of 43.2% in 2025, supported by strong e-commerce penetration, high consumer spending on personalized products, and wide adoption of recurring delivery models across beauty, food, fashion, pet care, wellness, books, and lifestyle categories.
Subscription boxes are recurring product delivery services that offer curated items based on customer preferences, needs, or interests. The growth of the market can be attributed to increasing demand for convenience, personalized shopping experiences, product discovery, and flexible subscription models. Brands are using subscription boxes to improve customer retention, build direct consumer relationships, and create predictable recurring revenue.
The market outlook remains positive as consumers continue to prefer customized, time-saving, and experience-based shopping formats. Demand is expected to rise for niche subscription boxes, premium curated products, sustainable packaging, and AI-based personalization. North America is expected to maintain its leading position due to its mature digital commerce ecosystem, strong direct-to-consumer brand presence, and growing preference for recurring online purchases.
 iThe graph shows projected market growth until 2035 based on CAGR analysis. Actual outcomes may vary depending on changing demand, competition, and economic factors.To gain greater insights - request a sample report PDF
Key Market Insights
Replenishment subscriptions led the market with 48.2% share, supported by recurring demand for essential products, automatic deliveries, and convenience-focused purchasing.
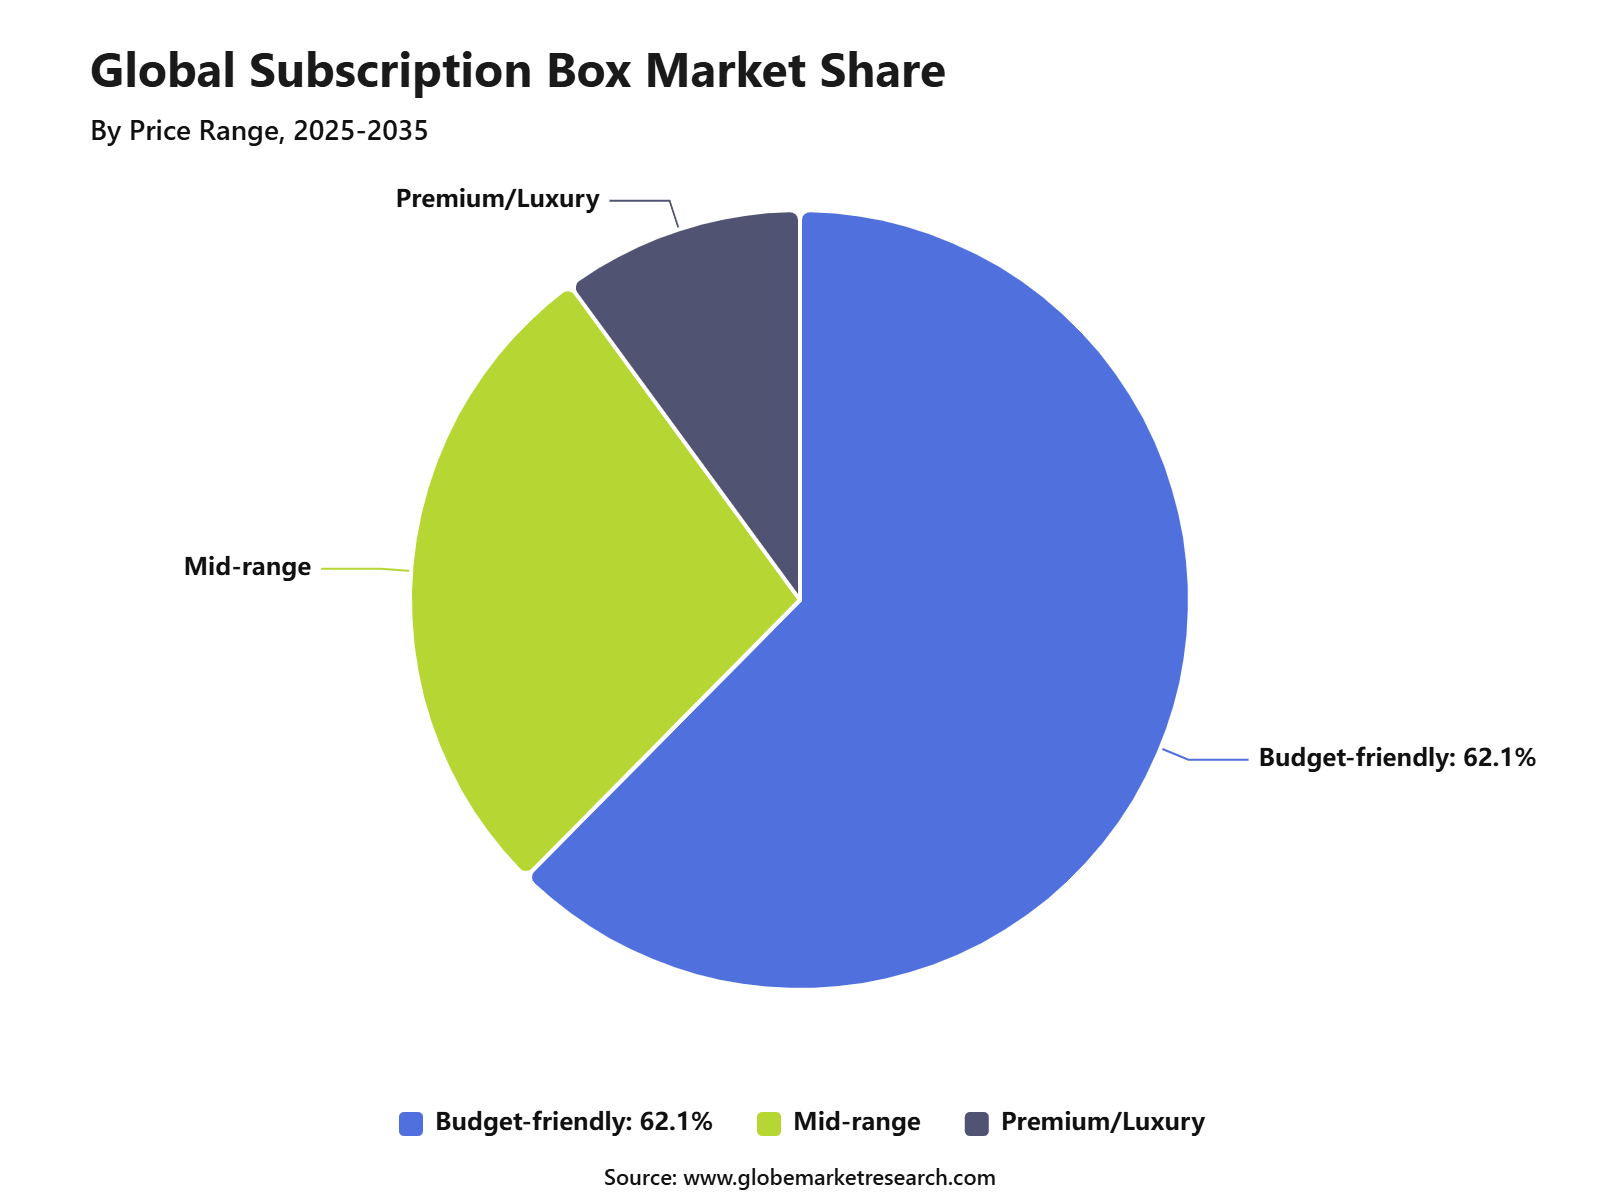
Budget-friendly subscriptions accounted for 62.1% share, driven by consumer preference for affordable plans, flexible pricing, and value-based product bundles.
Food and beverages captured 37.4% share by application, supported by rising demand for meal kits, snack boxes, specialty drinks, and curated grocery subscriptions.
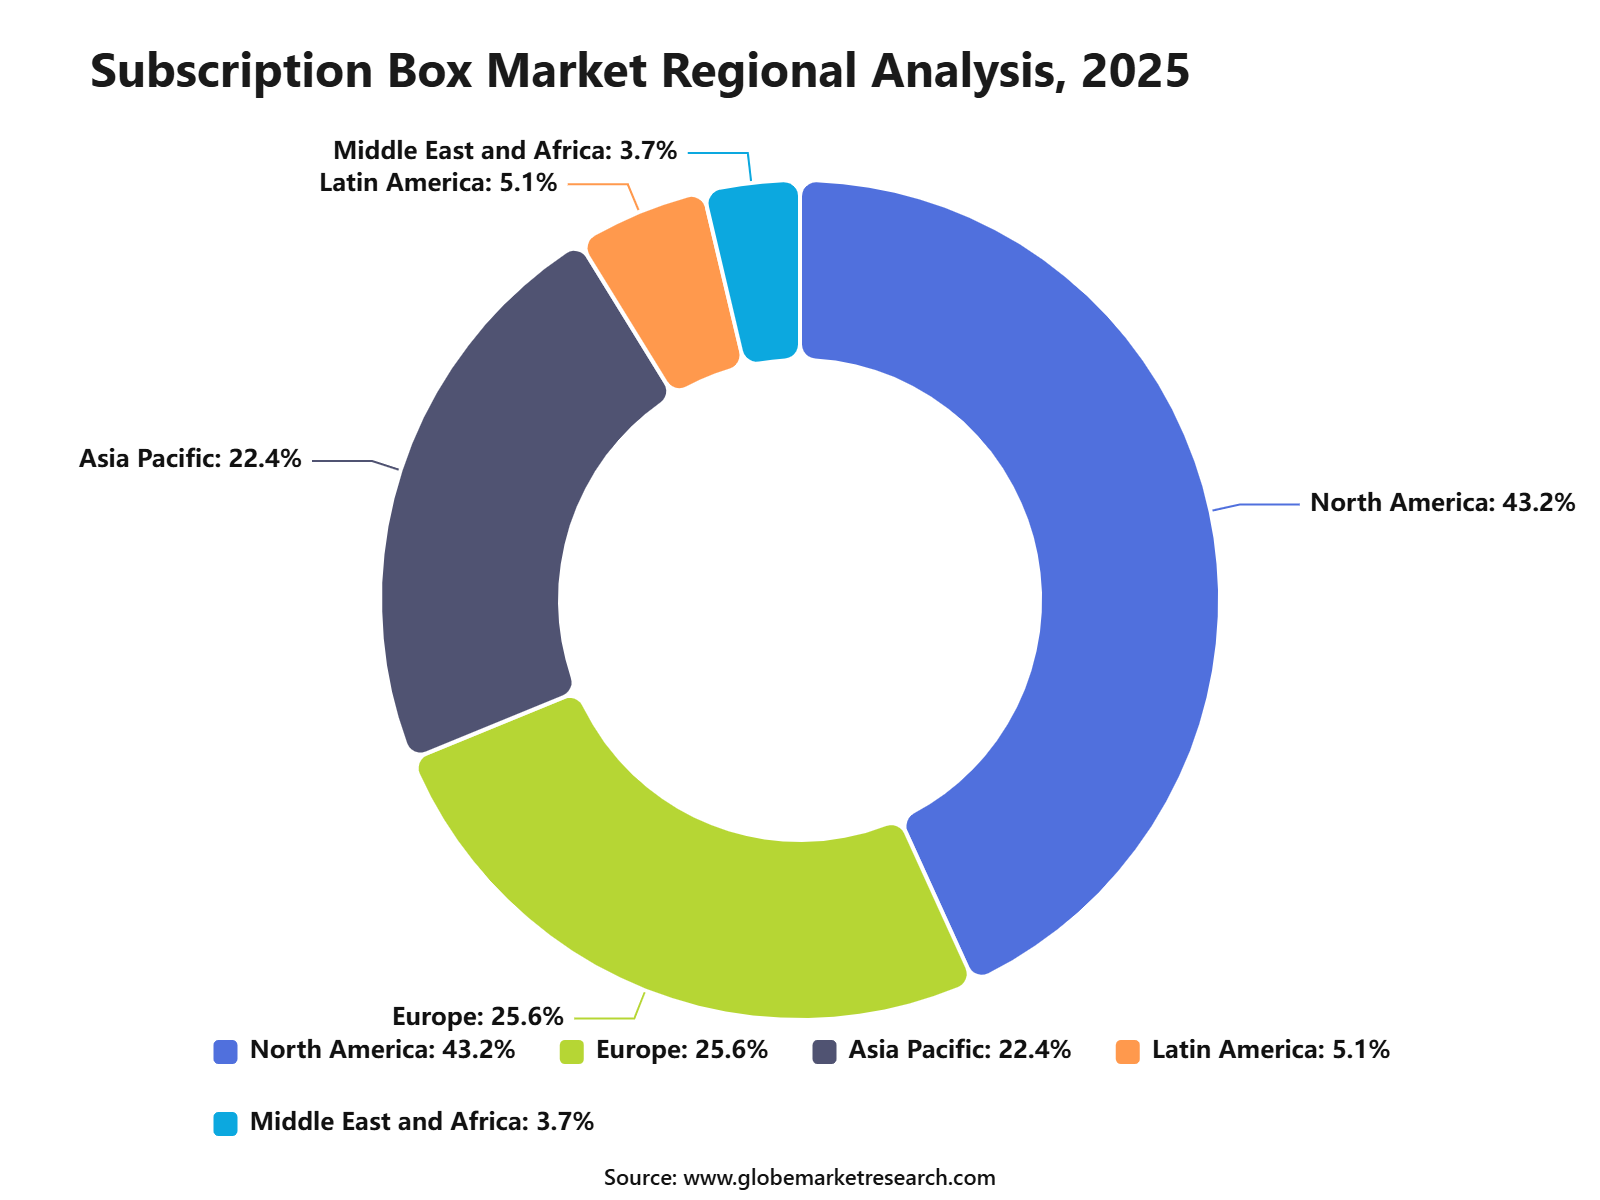
North America held 43.2% share of the subscription box market, supported by high digital adoption, strong e-commerce penetration, and growing consumer preference for personalized recurring deliveries.
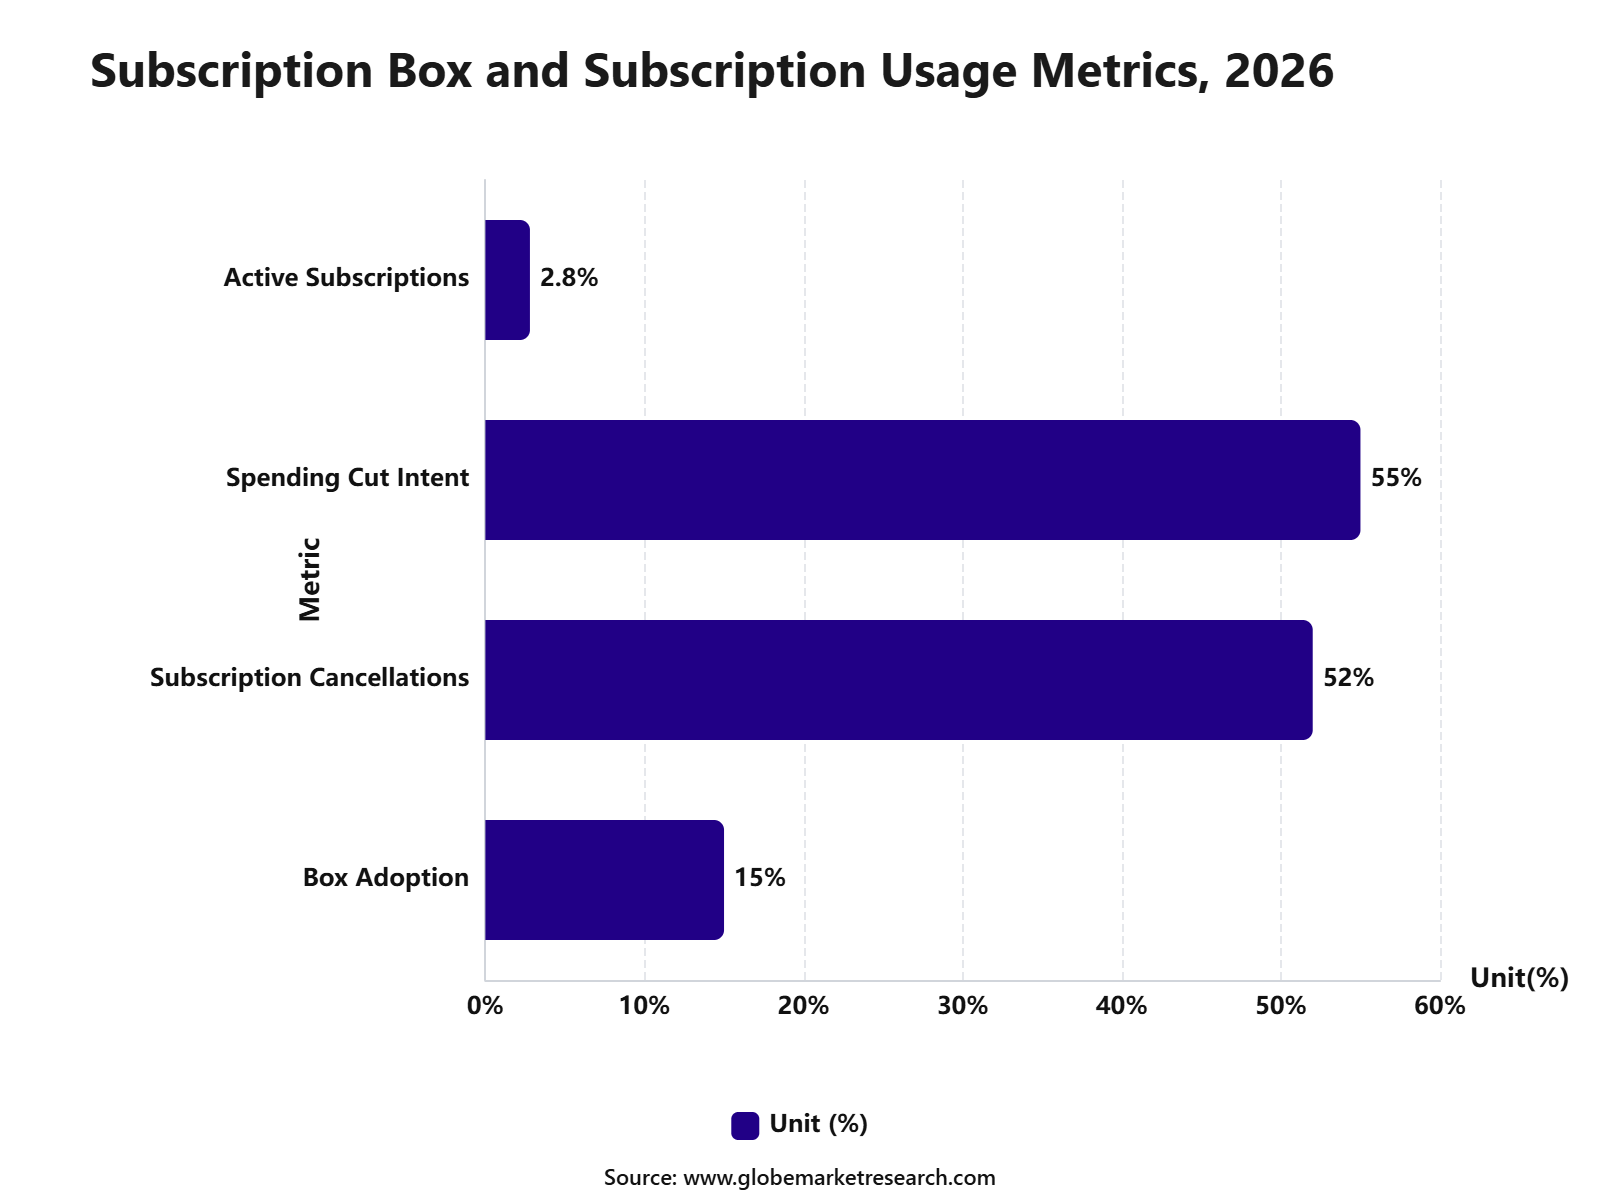
Usage Metrics
 iThe graph shows projected market growth until 2035 based on CAGR analysis. Actual outcomes may vary depending on changing demand, competition, and economic factors.To gain greater insights - request a sample report PDF
Type Analysis
Replenishment subscription led the Subscription Box Market with 48.2% share, supported by strong demand for repeat-use products that customers need on a regular basis. These subscriptions are commonly used for food items, beverages, personal care products, pet supplies, household essentials, vitamins, grooming products, and baby care products. The growth of this segment can be attributed to convenience, automatic delivery, predictable purchase cycles, and reduced need for repeat manual ordering.
Consumers prefer replenishment subscriptions because they save time, reduce stockout risk, and often provide better value through discounts or bundled offers. Replenishment subscription is expected to remain a leading model because it offers stable recurring revenue for brands and reliable product access for customers. Companies that provide flexible delivery schedules, easy cancellation, product customization, and clear pricing are likely to gain stronger customer retention.
Price Range Analysis
Budget-friendly subscription boxes accounted for 62.1% share, making them the leading price range segment. This dominance is supported by rising consumer price sensitivity and growing demand for affordable subscription options across food, beverages, beauty, personal care, books, household products, and lifestyle categories. The segment is growing because customers are more careful about discretionary spending and prefer subscription plans that offer practical value.
Budget-friendly boxes are attractive when they provide savings, useful products, free delivery benefits, or smaller entry-level plans that reduce purchase hesitation. Demand is expected to remain strong as subscription brands focus on flexible pricing and wider consumer access. Providers that offer low-cost plans, trial boxes, refill packs, and clear value comparison are likely to perform well in this segment.
 iThe graph shows projected market growth until 2035 based on CAGR analysis. Actual outcomes may vary depending on changing demand, competition, and economic factors.To gain greater insights - request a sample report PDF
Application Analysis
Food and beverages led the application segment with 37.4% share, supported by strong consumer demand for meal kits, snacks, coffee, tea, health drinks, specialty foods, ready-to-cook products, and curated grocery boxes. This category benefits from frequent consumption and repeat purchase behavior, which makes it suitable for subscription-based delivery.
The growth of this segment is being driven by convenience, changing eating habits, demand for discovery-based food products, and interest in personalized meal options. Consumers are using food and beverage subscription boxes to save time, try new brands, manage diet preferences, and access products that may not be available in local stores.
Food and beverage subscriptions are expected to remain a major growth area as brands improve freshness, packaging, cold-chain delivery, and personalization. Opportunities are likely to remain strong in healthy snacks, premium beverages, regional foods, meal kits, organic products, and family-focused subscription formats.
Regional Analysis
North America led the Subscription Box Market with 43.2% share, supported by strong e-commerce penetration, high digital payment adoption, mature direct-to-consumer brands, and wide consumer familiarity with subscription services. The region has a strong base of online shoppers, digital-first retail brands, and recurring delivery platforms.
The growth of North America is supported by demand for convenience, personalization, and automatic product replenishment. Consumers in the region are using subscription boxes across food and beverages, beauty, pet care, personal care, fitness, household essentials, books, toys, and lifestyle products.
North America is expected to remain a leading region as brands continue to invest in customer retention, mobile commerce, loyalty programs, and data-based personalization. Subscription providers that offer flexible plans, transparent billing, easy pause options, and strong product value are likely to gain higher trust and repeat demand.
 iThe graph shows projected market growth until 2035 based on CAGR analysis. Actual outcomes may vary depending on changing demand, competition, and economic factors.To gain greater insights - request a sample report PDF
Go-to-Market and Sales Strategy
The Subscription Box Market needs a retention-led go-to-market strategy because revenue depends on repeat billing, not only first-time sales. Brands should focus on curated products, personalization, flexible plans, refill options, product discovery, gifting, and clear value per box. According to census, Strong categories include beauty, food and snacks, pet products, books, wellness, coffee, toys, apparel, hobby kits, and baby products. U.S. retail e-commerce sales reached USD 326.7 billion in Q1 2026, up 9.8% from Q1 2025, and e-commerce accounted for 16.9% of total U.S. retail sales, supporting online subscription commerce demand.
Sales economics are strongest when brands reduce customer acquisition cost and extend subscriber lifetime through product quality, loyalty rewards, personalized selections, easy skips, and flexible pause options. Subscription box companies should not depend only on discounts, because discount-led acquisition often creates weak retention. U.S. retail sales reached USD 763.7 billion in May 2026, up 0.9% from April and 6.9% from May 2025, while non-store retailers were up 12.2% year-on-year. This shows that online-led retail demand remains strong, but customers are still selective about recurring spending.
Revenue Potential Analysis
Revenue Landscape Across
The revenue landscape for subscription boxes is spread across monthly boxes, quarterly boxes, refill subscriptions, discovery boxes, premium memberships, gifting subscriptions, corporate gifting, private label products, and add-on sales. Beauty, food, pet care, wellness, books, toys, hobby kits, coffee, fitness, and baby care remain attractive because they support repeat use and emotional buying. Stronger revenue is expected when brands combine recurring boxes with e-commerce stores, loyalty programs, limited-edition drops, and member-only discounts.
The strongest revenue model is not only the box itself, but the full subscriber relationship. Brands can use subscription boxes to introduce new products, collect preference data, drive full-size product purchases, and build repeat buying across channels. Nonstore retail growth supports this model, as U.S. Census data showed nonstore retailers were up 12.2% year-on-year in May 2026. This gives subscription box brands a stronger base for direct-to-consumer sales, but only if retention and fulfillment quality are well controlled.
Financial Impact
The financial impact can be positive for companies that manage acquisition cost, product cost, packing cost, shipping cost, churn, and payment failure rates carefully. Gross margin can improve through private label products, supplier-funded samples, bulk buying, regional warehouses, lightweight packaging, and add-on sales. Subscription boxes can also generate predictable cash flow because customers are billed on a recurring schedule, which supports inventory planning and supplier negotiations.
Financial risk remains high when brands overpay for digital advertising, offer large discounts, or underestimate fulfillment and shipping costs. The USPS 8% temporary price increase in 2026 shows how logistics can quickly affect profitability, especially for low-ticket monthly boxes. The strongest financial resilience is expected from companies that use flexible plans, strong cancellation transparency, local sourcing, reduced packaging weight, high-quality curation, and clear unit economics before scaling paid marketing.
Risk Factors & Market Barriers
The main risk factor is churn. Subscription box customers often cancel when product value feels repetitive, delivery is delayed, price rises, or household budgets tighten. Unlike standard e-commerce, subscription boxes must deliver satisfaction every cycle, which means poor curation can quickly reduce renewal rates. The FTC has also highlighted rising consumer concern around recurring subscriptions, stating that in 2024 it received nearly 70 complaints per day on negative option and recurring subscription practices, up from 42 per day in 2021.
Another barrier is high operating complexity. Subscription box companies must manage product sourcing, packaging, inventory forecasting, fulfillment timing, shipping, returns, damaged goods, customer support, cancellations, and payment failures. Shipping cost pressure remains high, as USPS announced a time-limited 8% increase on Priority Mail Express, Priority Mail, USPS Ground Advantage, and Parcel Select, effective from April 2026, through January 2027, subject to review. This directly affects box economics because shipping is one of the largest recurring costs.
Regulatory & Compliance Risks
Regulatory risk is high because subscription boxes use automatic renewal billing, free trials, promotional offers, influencer marketing, product claims, and customer data. Businesses must clearly disclose price, renewal timing, cancellation terms, billing frequency, trial conversion rules, and any material conditions before charging customers. The FTC stated in March 2026 that it was seeking information on negative option programs, enrollment and cancellation practices, and ways to address unfair or deceptive practices, showing that subscription compliance remains an active enforcement area.
Compliance also depends on the product category inside the box. Beauty boxes may need cosmetic labeling and ingredient compliance, food boxes need allergen and food safety documentation, pet boxes need material safety checks, and children’s toy boxes require age grading and small-parts controls. Subscription companies must also manage privacy, payment security, refund policies, influencer disclosures, and customer consent records. A weak cancellation process, unclear trial conversion, or misleading “free” offer can create legal risk and damage customer trust.
Market Adoption Barriers
Market adoption barriers are mainly linked to subscription fatigue, price sensitivity, and uncertain perceived value. Consumers may enjoy product discovery, but they are more likely to cancel when they receive unwanted products, duplicate items, low-value samples, or items that do not match their preferences. This makes onboarding questions, product personalization, skip options, and easy plan changes important for adoption. A subscription box should feel useful and curated, not like excess inventory packed into a monthly shipment.
Returns and refunds are also adoption barriers. NRF reported that total U.S. retail returns were projected to reach USD 849.9 billion in 2025, while 19.3% of online sales were expected to be returned. It also reported that 82% of consumers consider free returns important when shopping online. This creates a challenge for subscription boxes because returns are harder to manage when products are bundled, sampled, or personalized.
Segment Covered in the Report
By Type
Replenishment Subscription
Curation Subscription
Access Subscription
By Price Range
Budget-friendly
Mid-range
Premium/Luxury
By Application
Beauty and Personal Care
Food and Beverages
Fashion and Apparel
Pet Products
Health and Fitness
Kids and Baby Products
Books and Entertainment
Home Goods
Tech and Gadgets
Arts and Crafts
Others
By Region
North America
Europe
Asia Pacific
Latin America
Middle East and Africa
Drivers Impact Analysis
Impact Factor | Estimated CAGR Impact | Regional Relevance | Market Impact |
|---|---|---|---|
Rising demand for personalized products | +3.7% | North America, Europe, Asia Pacific | Drives subscription adoption. |
Growth in direct-to-consumer brands | +3.2% | U.S., UK, China, India | Supports recurring sales. |
Increasing online shopping behavior | +2.8% | Global | Expands customer reach. |
Convenience of scheduled deliveries | +2.5% | Urban global markets | Improves customer retention. |
Growth in beauty, food, and lifestyle boxes | +2.2% | North America, Europe, Asia Pacific | Expands category demand. |
Restraints Impact Analysis
Impact Factor | Estimated CAGR Impact | Regional Relevance | Market Impact |
|---|---|---|---|
High customer churn rate | -1.9% | Global | Affects recurring revenue. |
Rising logistics and fulfillment cost | -1.6% | North America, Europe, Asia Pacific | Pressures margins. |
Subscription fatigue among consumers | -1.4% | Mature markets | Slows repeat purchases. |
Product quality inconsistency | -1.1% | Global | Reduces brand trust. |
Price sensitivity in emerging markets | -0.9% | Asia Pacific, Latin America, MEA | Limits premium adoption. |
Opportunities Impact Analysis
Impact Factor | Estimated CAGR Impact | Regional Relevance | Market Impact |
|---|---|---|---|
Expansion of beauty subscription boxes | +3.4% | U.S., Europe, South Korea, Japan | Supports premium demand. |
Growth in food and meal subscription boxes | +3.0% | North America, Europe, urban Asia | Builds repeat usage. |
Pet subscription box growth | +2.6% | U.S., Canada, UK, Australia | Opens niche demand. |
AI-based product personalization | +2.4% | Developed digital markets | Improves customer fit. |
Corporate gifting subscription models | +2.0% | North America, Europe, Asia Pacific | Expands B2B demand. |
Challenges Impact Analysis
Impact Factor | Estimated CAGR Impact | Regional Relevance | Market Impact |
|---|---|---|---|
Retaining long-term subscribers | -1.7% | Global | Impacts lifetime value. |
Managing inventory variety | -1.4% | Subscription operators | Raises planning complexity. |
Delivery delays and return issues | -1.2% | Global | Affects customer experience. |
Strong competition from e-commerce platforms | -1.1% | Global | Pressures differentiation. |
Maintaining personalization quality | -0.9% | Mature markets | Affects satisfaction. |
Recent Developments
March 2026, Visa launched Enhanced Subscription Manager to help banks and card issuers give customers better control over recurring payments. The tool allows users to view, manage, switch, and cancel subscriptions directly inside mobile banking apps. Visa said the service would be available to North American issuers in summer 2026, followed by expansion to Latin America and the Caribbean.
March 2026, Dollar General announced plans to pilot a subscription program as part of its loyalty strategy in 2026. The retailer also planned a new store format focused on browsing and higher customer engagement. Dollar General reported Q4 net sales of USD 10.9 billion and fiscal 2025 net sales of USD 42.7 billion, showing how large retailers are testing subscription models to protect repeat purchases and customer loyalty.
Report Scope
Report Highlights | Details |
|---|---|
Market Revenue (2025) | USD 59.7 Billion |
Forecast Revenue (2035) | USD 225.2 Billion |
CAGR (2025-2035) | 14.2% |
Base Year for Estimation | 2025 |
Historic Data | 2020-2024 |
Forecast Period | 2025-2035 |
Report Coverage | AI market impact analysis, market surveys, trade analysis, Industry & competitive intelligence, Revenue projections, company positioning, competitive analysis, growth drivers, and emerging market trends, Strategic Consultation & Advisory Services |
Segments Covered | By Type (Replenishment Subscription, Curation Subscription, Access Subscription), By Price Range (Budget-friendly, Mid-range, Premium/Luxury), By Application (Beauty and Personal Care, Food and Beverages, Fashion and Apparel, Pet Products, Health and Fitness, Kids and Baby Products, Books and Entertainment, Home Goods, Tech and Gadgets, Arts and Crafts, Others), By Regional Insights |
Regional Analysis | North America - US, Canada; Europe - Germany, France, The UK, Spain, Italy, Russia, Netherlands, Rest of Europe; Asia Pacific - China, Japan, South Korea, India, New Zealand, Singapore, Thailand, Vietnam, Rest of Latin America; Latin America - Brazil, Mexico, Rest of Latin America; Middle East & Africa - South Africa, Saudi Arabia, UAE, Rest of MEA |
Key companies profiled | HelloFresh SE, Stitch Fix, Ipsy, BARK, BarkBox, Gousto, Amazon Subscribe & Save, Birchbox, Blue Apron Holdings Inc., Dollar Shave Club, FabFitFun, Glossybox, Grove Collaborative Inc., Harry’s Inc. |
Customization Scope | Tailored insights for specific regions, countries, and market segments can be provided. Additional report customization is available upon request. |
Competitive Landscape
The market is characterized by intense competition among established players and emerging companies. Strategic partnerships, mergers and acquisitions, and product innovation are key strategies employed by market participants.
Key Market Players
HelloFresh SE
Stitch Fix
Ipsy
Gousto
Amazon Subscribe & Save
Birchbox
Blue Apron Holdings Inc.
Dollar Shave Club
FabFitFun
Glossybox
Other Key Players
Meet the Team
This report was prepared by our expert analysts with deep industry knowledge and research experience.
Pratiksha is market research analyst with strong experience in industry research, market forecasting, and competitive analysis. She specializes in identifying market trends, evaluating growth opportunities, and preparing data-driven insights across global industries. Her work supports businesses in understanding market dynamics, customer demand, regional opportunities, and strategic investment areas.
Sayali brings more than 5 years of experience to Globe Market Research, supporting the accuracy, clarity, and relevance of research content across multiple industries. She reviews market data, segment analysis, competitive insights, and industry trends to ensure each report meets strong quality standards and provides practical value to business decision-makers. Her expertise spans healthcare, information technology, consumer goods, and diverse cross-industry domains. With a strong focus on data reliability, structured analysis, and clear presentation, Sayali helps ensure that each research output delivers well-reviewed insights for clients, investors, consultants, and industry stakeholders.
Frequently Asked Questions
Related Reports
More in Consumer Goods
Sustainable Casket and Coffin Market Size to hit USD 5.9 bn by 2035
Global Sustainable Casket and Coffin Market Size, Go-to-Market Strategy Analysis By Material (Soft Wooden, Cardboard, Wicker, Others), By Price (Low, Medium, High), By Distribution Channel (Online, Offline), By Regional Insights, Business plan and Project Report, Investment Opportunities, Profitability, Industry Trends, Leading Companies and Growth Forecasts By 2025-2035
Sports Sponsorship Market to hit USD 215.8 billion by 2035
Global Sports Sponsorship Market Size, Go-to-Market Strategy Analysis By Sponsorship Type (Team/Club, Athlete, Events, Venue, Others), By Sports Category (Football, Cricket, E-sports, Others), By Event Type (International, League, Domestic), By Application (Competition Sponsorship, Training Sponsorship, Others), By Regional Insights, Business plan and Project Report, Investment Opportunities, Profitability, Industry Trends, Leading Companies and Growth Forecasts By 2025-2035
Pet Toys Market to hit USD 35.6 billion by 2035
Global Pet Toys Market Size, Share Analysis By Product Type (Plush, Rope, Balls, Others), By Pet Type (Dogs, Cats, Others), By Distribution Channel (Offline, Online), By Regional Insights, Business plan and Project Report, Investment Opportunities, Profitability, Industry Trends, Leading Companies and Growth Forecasts By 2025-2035
Black Hair Care Market to hit 17.1 Bn by 2035
Global Black Hair Care Market By Product Type (Shampoo, Conditioner, Hair Dye, Hair Oils, Hair Serums, Others.), By Application (Household, Commercial Use, Salons, Beauty Parlors, Professional Hair Care Services), By Distribution Channel (Offline Stores, Online Platforms, Supermarkets and Hypermarkets, Specialty Beauty Stores, Retail Stores, Pharmacies, Direct-to-Consumer Channels), By End User (Women, Men, Kids, Professional Stylists, Salons), By Hair Concern (Dryness and Moisture Retention, Scalp Health, Breakage Repair, Curl Definition, Frizz Control, Protective Styling, Hair Growth Support, Chemical-Free Hair Care), By Regional Insights, Business plan and Project Report, Investment Opportunities, Profitability, Industry Trends, Leading Companies and Growth Forecasts by 2025-2035