

Revenue, 2025
$1,181.4 Bn
Forecast, 2035
USD 2,529.2 Bn
CAGR, 2025-2035
7.9%
Report Coverage
Global
Market Size and Forecast
The Global Used Car Market was worth USD 1,181.4 billion in 2025 and is expected to reach USD 2,529.2 billion by 2035, growing at a CAGR of 7.9% from 2025 to 2035. Asia Pacific held the largest regional share of 38.7% in 2025, supported by rising middle-class income, growing demand for affordable mobility, expanding online used car platforms, and strong vehicle resale activity across China, India, Japan, South Korea, and Southeast Asia.
The Used Car Market includes pre-owned passenger cars, commercial vehicles, certified pre-owned vehicles, and vehicles sold through dealerships, online platforms, auctions, independent sellers, and rental fleet remarketing channels. The market is closely linked with vehicle financing, digital inspection tools, price transparency platforms, extended warranties, insurance services, and organized retail networks.
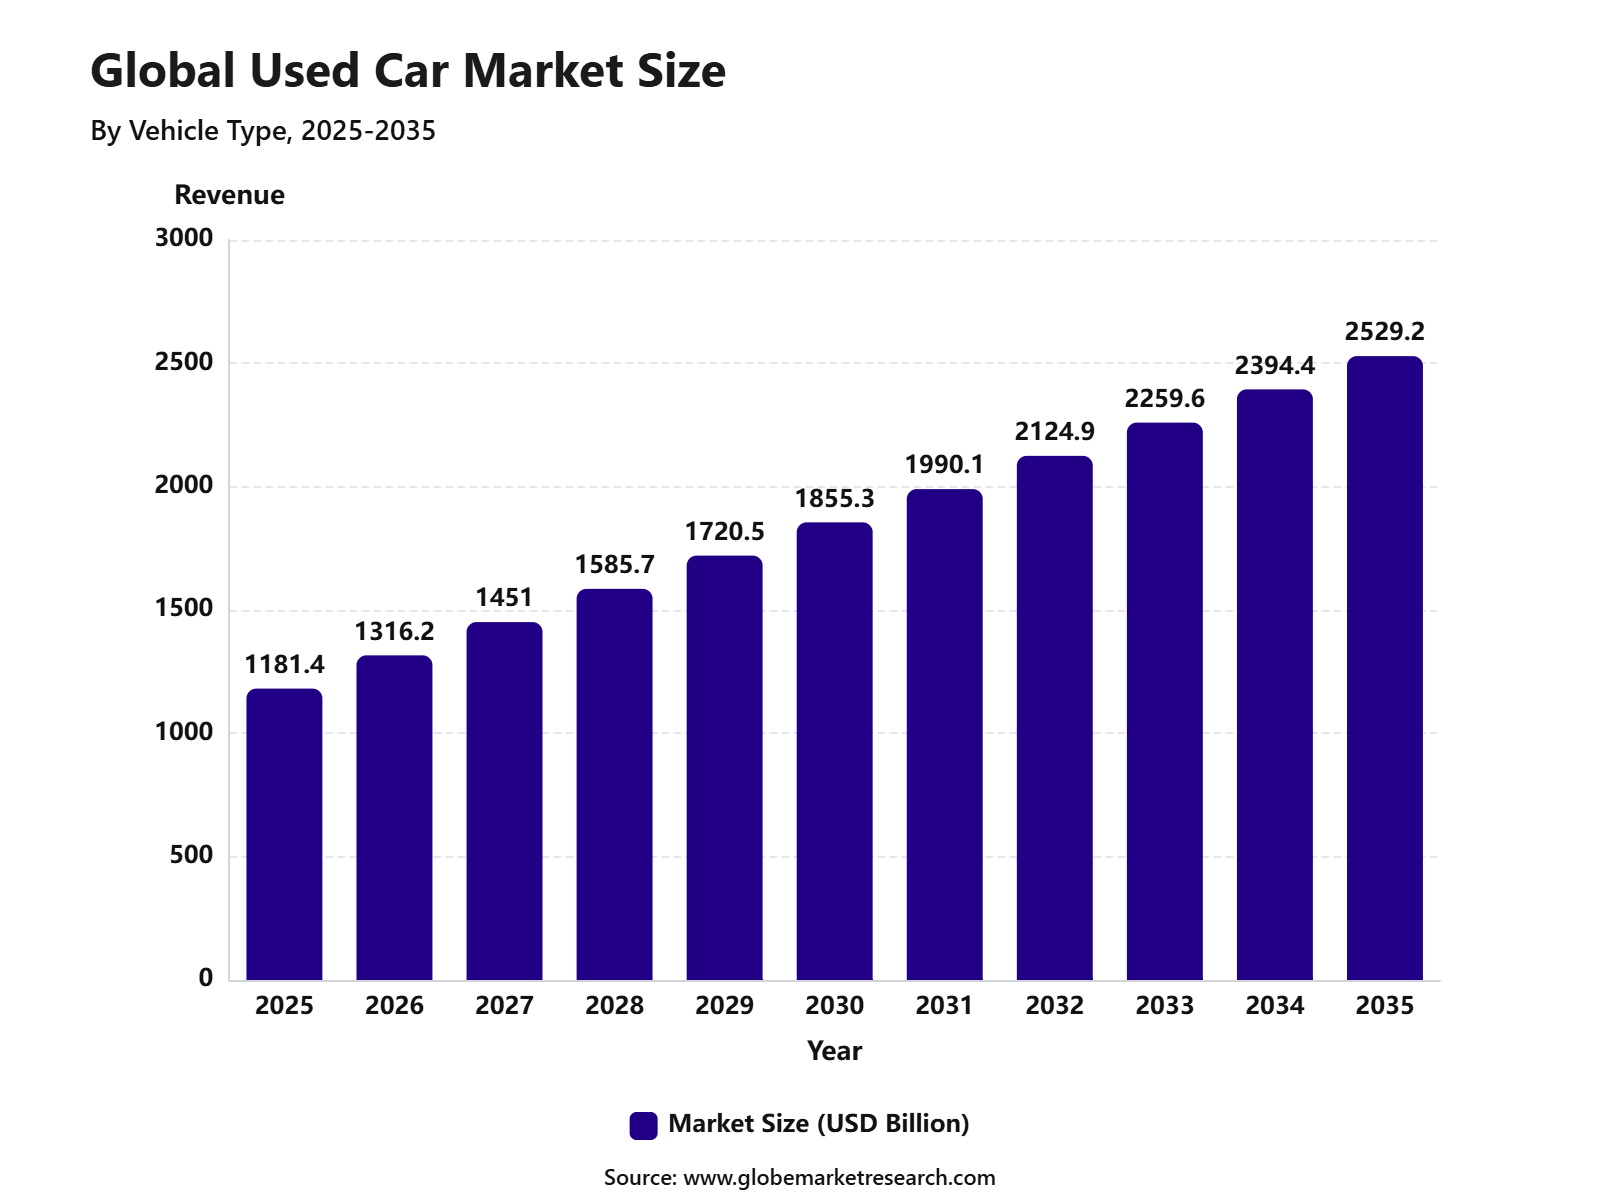 iThe graph shows projected market growth until 2035 based on CAGR analysis. Actual outcomes may vary depending on changing demand, competition, and economic factors.To gain greater insights - request a sample report PDF
The market outlook remains positive as consumers continue to prefer cost-effective vehicle ownership and flexible purchase options. Growth can be attributed to rising new car prices, better availability of certified vehicles, wider digital listing platforms, and increasing trust in organized used car sales channels. The expansion of online car marketplaces, vehicle history reports, and financing support is expected to strengthen long-term market demand.
Report Highlights | Details |
|---|---|
Market Revenue (2025) | USD 1,181.4 billion |
Forecast Revenue (2035) | USD 2,529.2 billion |
CAGR (2025-2035) | 7.9% |
Base Year for Estimation | 2025 |
Historic Data | 2020-2024 |
Forecast Period | 2025-2035 |
Key Market Insights
Hatchbacks led the vehicle type segment with 55.5% share, supported by affordability, compact design, fuel efficiency, and strong demand among urban buyers.
Petrol vehicles accounted for 45.9% share by fuel type, driven by lower upfront cost, wider availability, and easier maintenance compared to other fuel options.
Franchised dealers held 70.5% share by distribution channel, supported by buyer trust, certified vehicle options, financing support, and organized after-sales service.
Personal use dominated the end-use segment with 75.4% share, driven by rising demand for affordable mobility and growing preference for private vehicle ownership.
Offline sales captured 72.6% share by sales channel, supported by physical vehicle inspection, price negotiation, test drives, and dealer-led purchase assistance.
Asia Pacific led the used car market with 38.7% share, supported by large vehicle ownership, growing middle-class demand, and strong expansion of organized used car platforms.
Go-to-Market and Sales Economics
The go-to-market strategy for the used car market is shifting toward a hybrid model, where online discovery is combined with dealer-led physical inspection, financing, documentation and delivery. In the U.S. , 63% of vehicle buyers said an omnichannel buying process is ideal, while only 7% completed the full purchase fully online. Among used-vehicle buyers, 77% used third-party websites, showing that marketplaces, pricing tools and comparison platforms are now critical for lead generation.
Sales economics is being shaped by limited supply, faster stock movement and higher acquisition costs. In the U.S., used-vehicle inventory stood at 2.04 million units in April 2026, with 43 days of supply and an average listing price of USD 26,342 . This indicates that dealers with strong sourcing networks, faster reconditioning and dynamic pricing can protect margins better than sellers relying only on walk-in demand.
In the UK, the average used car price reached GBP 17,306 in May 2026, while used cars sold in an average of 29 days. Used EVs moved faster, taking only 24 days to sell, supported by rising demand and tighter supply. This shows that stock turnover, not only selling price, is becoming a key profit driver for used car dealers and platforms.
Adoption Statistics
Statistic Area | Country / Region | Latest Year | Adoption Value |
|---|---|---|---|
Certified pre-owned adoption | United States | 2025 | CPO sales reached 2.61 million units, up 2.1% year-on-year. |
Used-car sales penetration | United States | 2025 | Used cars represented around 76% of U.S. vehicle registrations since 2019. |
Used EV adoption | United Kingdom | 2025 | Used BEV transactions reached 274,815 units, with 3.5% share. |
Electrified used-car adoption | United Kingdom | 2025 | Electrified used cars accounted for 9.9% of total used-car transactions. |
Used-to-new adoption ratio | India | FY2026 | Used-to-new car sales ratio reached about 1.4x. |
By Vehicle Type
Hatchbacks led the vehicle type segment with 55.5% share, supported by affordability, compact size, lower maintenance cost, and strong suitability for city driving. These vehicles remain highly attractive for first-time buyers and budget-conscious households because they are easier to park, cheaper to insure, and practical for daily commuting.
The segment is strongly supported by Asia’s large small-car ownership base. In India, used-car annual sales are nearing 6 million units, while the used-to-new car sales ratio has reached around 1.4:1 , showing that pre-owned cars are becoming a mainstream purchase route for personal mobility.
Hatchbacks also benefit from continuous supply from the new-car ecosystem. Reuters reported that India’s October 2025 tax cuts reduced duties on entry-level vehicles from 28% to 18% , helping lift small-car demand during the festive period. This steady inflow of compact vehicles supports future resale availability in the used car market.
By Fuel Type
Petrol led the fuel type segment with 45.9% share, supported by wide vehicle availability, lower upfront cost, easier servicing, and strong acceptance among private buyers. Petrol cars remain popular in the used market because buyers often prefer simple engine technology and lower repair complexity compared with diesel, hybrid, or electric alternatives.
The segment is also supported by the slow turnover of the vehicle fleet. IEA’s 2026 electric vehicle outlook noted that electric cars represented about 10% of U.S. car sales in 2025, while Q4 2025 EV sales share stood at only 6% to 7%. This indicates that petrol and other combustion vehicles still form the larger pool of used-car inventory in many mature markets.
Petrol vehicles remain especially strong in price-sensitive markets where charging infrastructure, battery concerns, and repair familiarity still affect used EV adoption. Although electric car sales crossed 20 million globally in 2025, IEA data still shows that most vehicles in use are not electric, which supports petrol’s continued leadership in used-car transactions.
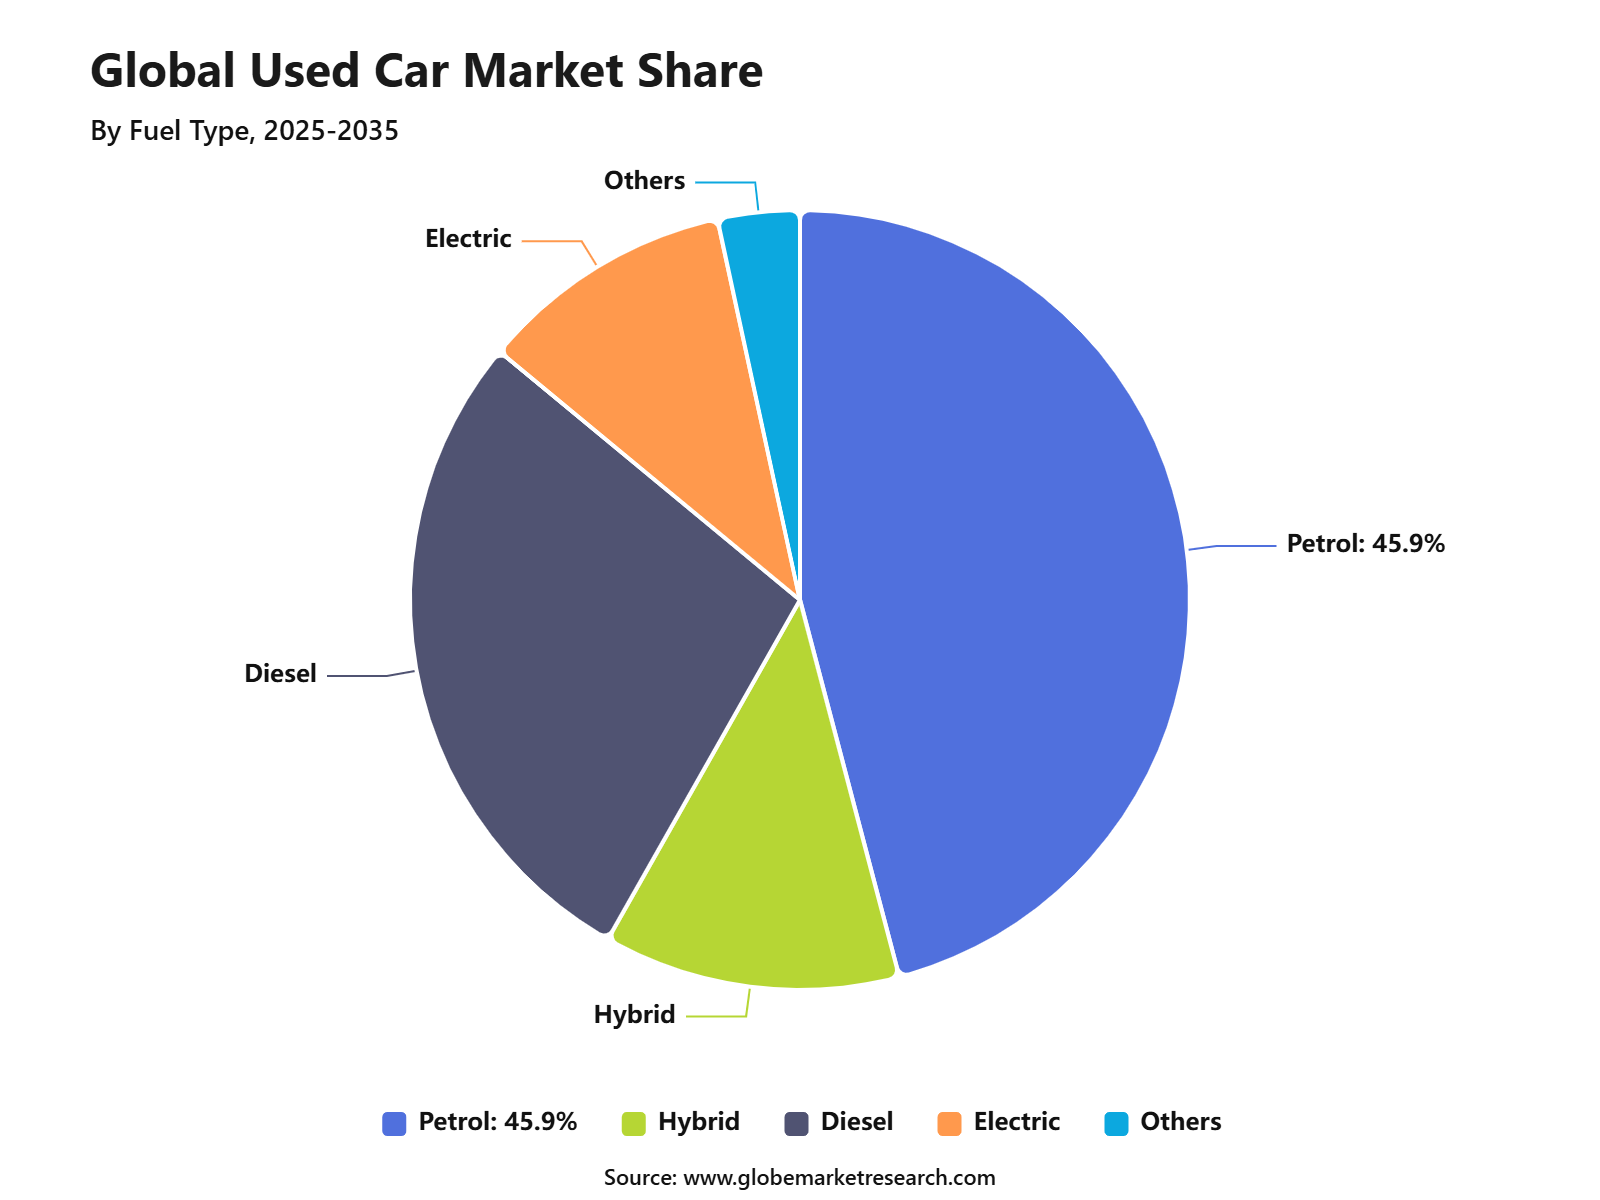 iThe graph shows projected market growth until 2035 based on CAGR analysis. Actual outcomes may vary depending on changing demand, competition, and economic factors.To gain greater insights - request a sample report PDF
By Distribution Channel
Franchised dealers led the distribution channel segment with 70.5% share, supported by stronger customer trust, certified vehicle checks, warranty-backed sales, financing support, and trade-in services. Buyers often prefer franchised dealers because used-car purchases involve higher inspection risk than new-car purchases.
Dealer-led resale is further supported by certified pre-owned activity. Cox Automotive reported that total U.S. certified pre-owned sales finished 2025 at 2.61 million units, up 2.1% from the previous year. December 2025 CPO sales reached 220,803 units, showing continued demand for inspected and dealer-backed used vehicles.
Franchised dealers are also expanding their used-car role through digital and certified programs. Reuters reported in March 2026 that about 40 million used vehicles are sold annually in the U.S., compared with around 16 million new vehicles, and large automakers are restructuring dealer networks to capture more pre-owned demand.
By End Use
Personal use held the largest end-use share at 75.4% , supported by demand for affordable ownership, family mobility, work commuting, and first-time car purchases. Used cars are often preferred by individuals who need private transport but want to avoid the higher cost of a new vehicle.
The segment is supported by rising affordability pressure and stronger private ownership needs. AutoPunditz reported that India’s used-car market is nearing 6 million annual sales, while the average age of cars entering the used market is around 3.7 years. This shows that many buyers are accessing newer used vehicles for personal use rather than delaying ownership.
Personal-use demand is also supported by the high value placed on vehicle ownership. In the U.S., car buying remains one of the most expensive household purchases after housing, and consumer surveys cited by Wired in 2026 showed that buyers still prefer to see, touch, and test-drive vehicles before purchase. This behavior supports personal car ownership through used-car channels.
By Sales Channel
Offline sales led the sales channel segment with 72.6% share, supported by the need for physical inspection, test drives, price negotiation, document verification, and financing assistance. Used cars are condition-sensitive products, so buyers often prefer to check vehicle quality in person before finalizing payment.
The continued strength of offline sales is supported by buyer behavior. Wired reported in 2026 that only 7% of U.S. car buyers completed their purchase fully online, even though 28% initially wanted to do the whole transaction online. More than half of buyers still completed purchases entirely in person.
Offline channels also remain important because trust is central to used-car buying. The same 2026 reporting cited a buyer survey in which 86% of respondents wanted to see a car in person before finalizing the purchase. This clearly supports the dominance of showroom, dealer lot, and physical inspection-led sales models.
By Region
Asia Pacific led the regional segment with 38.7% share, supported by large vehicle populations, rising middle-class demand, strong two-wheeler-to-car upgrades, and high acceptance of affordable pre-owned vehicles. The region has major automotive markets such as China, India, Japan, South Korea, Indonesia, Thailand, and Australia, creating a deep vehicle supply base for resale.
The regional position is supported by strong automotive activity in 2025. OICA reported that Asia Pacific vehicle production rose 7.6% to around 59.2 million vehicles in 2025, accounting for more than 61% of global output. Sales across Asia, Oceania, and the Middle East increased to 55.02 million units, lifting the region’s global sales share above 55%.
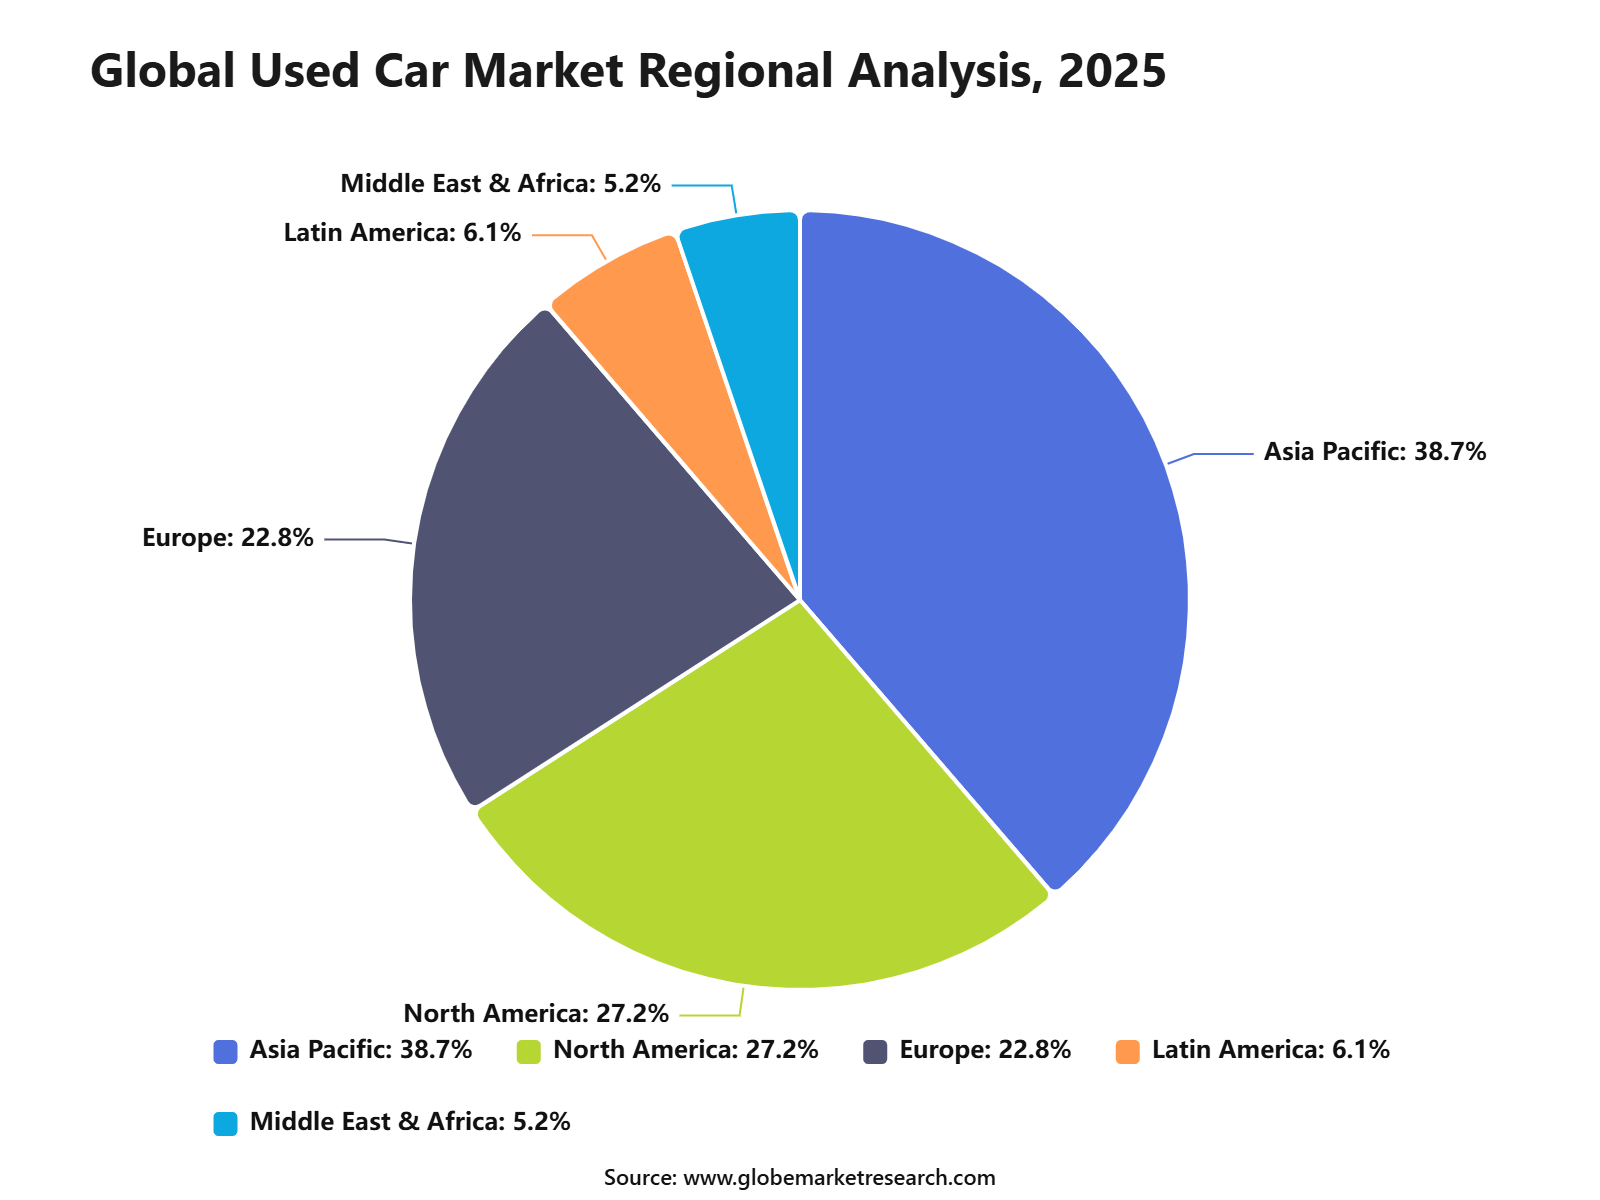 iThe graph shows projected market growth until 2035 based on CAGR analysis. Actual outcomes may vary depending on changing demand, competition, and economic factors.To gain greater insights - request a sample report PDF
India is one of the strongest growth contributors within Asia Pacific. OICA noted that India’s vehicle production reached 6.49 million units, while domestic passenger vehicle sales exceeded 4.6 million in FY2025-26. This large and growing new-vehicle base strengthens the future used-car supply pipeline across Asia Pacific.
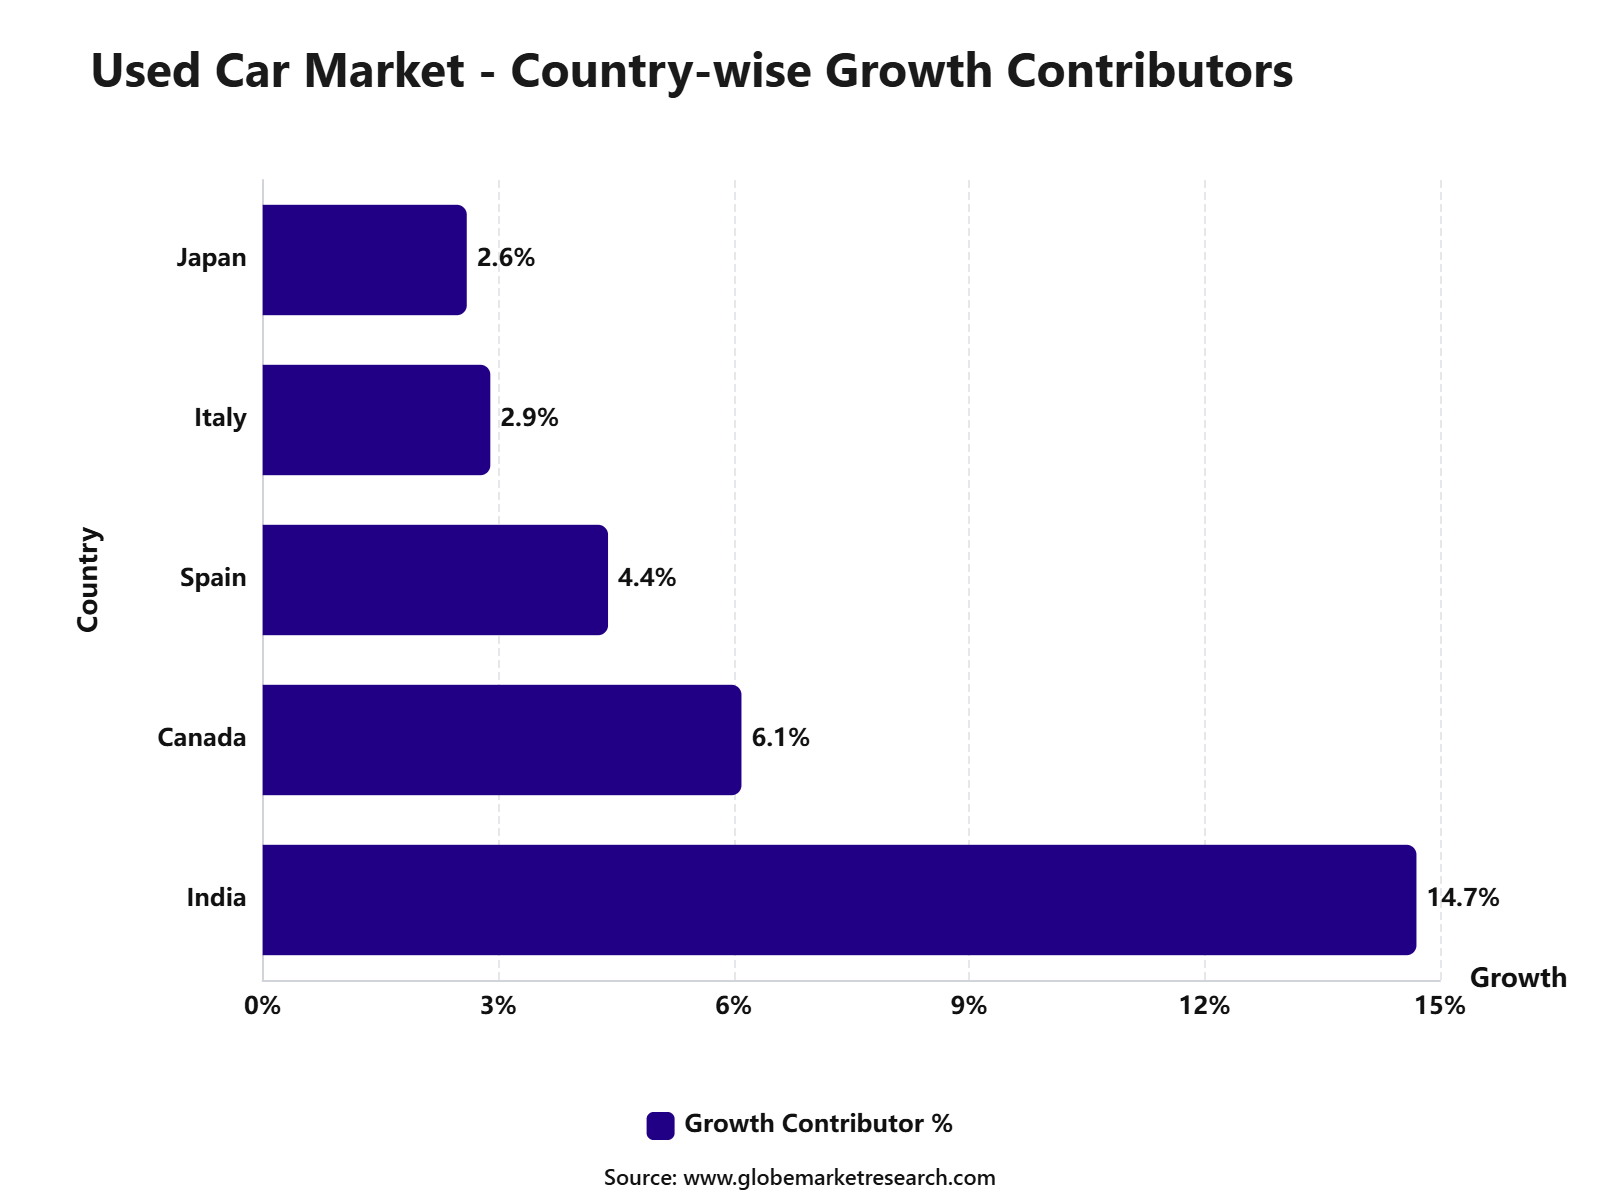 iThe graph shows projected market growth until 2035 based on CAGR analysis. Actual outcomes may vary depending on changing demand, competition, and economic factors.To gain greater insights - request a sample report PDF
Revenue Potential Analysis
Revenue Landscape Across
The revenue landscape is spread across used vehicle sales, certified pre-owned programs, dealer finance, insurance, warranties, refurbishment, logistics, auction services and digital lead generation. In the U.S., retail used-vehicle sales were around 1.43 million units in April 2026, while certified pre-owned sales reached 215,320 units and accounted for 15.1% of total used-vehicle retail sales. This creates recurring revenue scope beyond the first vehicle sale, especially through warranty, service contracts, financing and trade-in programs.
India is becoming one of the strongest revenue pools for used cars, supported by affordability pressure and wider digital adoption. Used car sales volume in India is expected to cross around 6 million units in the current fiscal year, while the used-to-new car sales ratio has improved to about 1.4 times from below 1.0 times five years ago. The estimated value of these used cars is around Rs 4 lakh crore, nearly matching the value of new car sales, which reflects strong monetization potential for organized platforms, lenders and refurbishment networks.
Digital-first sales are also improving conversion economics in India. In the first quarter of 2025, around 77% of Spinny customers purchased cars online, while 57% opted for used car loans through the platform. This indicates that revenue potential is expanding from vehicle resale to finance-led income, platform fees, insurance attachment and post-sale support.
Financial Impact
The financial impact is most visible in financing, where affordability challenges are increasing loan dependence. In Q1 2026, the average used vehicle loan amount in the U.S. reached USD 27,070, while the average monthly payment rose to USD 531 . Loan terms of more than six years accounted for 31.54% of used vehicle financing, showing that buyers are stretching repayment periods to manage ownership costs.
For dealers and platforms, this creates both revenue opportunity and credit risk. Financing improves conversion and raises per-customer revenue, but longer loan terms and higher payments can increase default exposure. U.S. 30- day auto loan delinquencies rose to 2.0% in Q1 2026, while 60- day delinquencies increased to 0.86% , meaning lenders and dealers need stronger underwriting, transparent pricing and better customer affordability checks.
The strongest financial upside will be captured by players that control sourcing, reconditioning, pricing, financing and after-sales service together. CRISIL noted that organized used car players in India have faced high operating costs from refurbishment, logistics and finance, but higher revenue growth is expected to help players reach operating-level breakeven over this and the next fiscal year. This makes scale, inventory discipline and service attachment key factors for profitability.
Segment Covered in the Report
By Vehicle Type
Sports Utility Vehicle
Hatchbacks
Sedan
Others
By Fuel Type
Petrol
Hybrid
Diesel
Electric
Others
By Distribution Channel
Franchised Dealers
Independent Dealers
Online Platforms
Others
By End Use
Personal
Commercial
By Sales Channel
Online
Offline
By Region
North America
Europe
Asia Pacific
Latin America
Middle East and Africa
Driver Analysis
New Vehicle Affordability Pressure
The Used Car Market is being driven by the growing affordability gap between new and used vehicles. Reuters reported that the average new vehicle transaction price in the U.S. reached around USD 47,000 , up about 40% since 2018, which has pushed many middle-income buyers toward used cars. This trend supports demand for certified pre-owned cars, older low-mileage vehicles, and budget-friendly used models. It also strengthens dealership focus on used vehicle sourcing, inspection, financing, and online listing visibility.
The aging vehicle fleet is another demand driver. S&P Global Mobility reported that the average age of U.S. light vehicles reached 12.8 years in 2025, showing that consumers are keeping cars longer due to high purchase costs and economic uncertainty. This supports both used car transactions and vehicle replacement demand when older cars become expensive to maintain. The trend also benefits aftersales, repair, parts, warranty, and reconditioning services linked to used vehicles.
Restraint Analysis
Financing Pressure and Loan Affordability
A major restraint for the Used Car Market is the continued pressure from vehicle financing costs. Experian reported tha t 31.54% of used vehicle loans had terms longer than six years in Q1 2026, compared with 28.60% in Q1 2025. This shows that buyers are stretching repayment periods to manage monthly payments, which can increase total interest cost and reduce financial flexibility. For dealers and lenders, affordability pressure can slow conversions, increase credit risk, and make price-sensitive buyers more cautious.
Negative equity is also affecting the broader vehicle purchase cycle. Edmunds reported that 30.9% of trade-ins toward new-vehicle purchases carried negative equity in Q1 2026, the highest level since Q1 2021. While this data is linked to new-vehicle trade-ins, it still matters for the used car market because underwater loans can delay trade-ins and reduce available quality used inventory. Buyers with existing debt may also postpone replacement decisions or choose lower-priced used vehicles.
Opportunity Analysis
Used EVs and Digital Retail Expansion
A strong opportunity is emerging from used electric vehicles as more EVs enter the resale cycle. Cox Automotive reported that used EV sales reached 42,924 units in March 2026, up 27.7% year over year, while used EV market share increased to 2.5% . This creates new opportunities for dealers, marketplaces, battery health testing providers, warranty companies, and financing firms. As more EVs move from first owners to second owners, transparent pricing and battery condition reporting will become important purchase factors.
Digital retail is also improving used car discovery and sales efficiency. Buyers increasingly compare prices, mileage, history reports, financing offers, and dealer ratings before visiting a store. Online-first listing models help dealers reach a wider buyer base and support faster inventory turnover. For market participants, the opportunity lies in combining vehicle inspection, transparent pricing, home delivery, flexible financing, and aftersales support into a simple buying experience.
Challenge Analysis
Price Volatility and Inventory Quality
The key challenge for the Used Car Market is price volatility in wholesale vehicle values. Cox Automotive’s Manheim Used Vehicle Value Index reached 213.9 in mid-June 2026, reflecting a 0.6% increase from May and a 2.6% rise compared with June 2025. This creates margin risk for dealers because acquisition costs can change faster than retail demand. When wholesale prices rise, dealers may face pressure to either increase retail prices or accept lower margins.
Inventory quality is another challenge because used vehicles differ widely in mileage, accident history, maintenance records, ownership patterns, and remaining useful life. This makes inspection, certification, reconditioning, and pricing more complex than new vehicle retail. Buyers also need more trust before purchasing, especially through online channels where the vehicle is not always inspected physically before payment. Companies that improve transparency through vehicle history, warranty coverage, return policies, and standardized condition reports are better positioned to reduce buyer hesitation.
Strategic Developments
Used Car Market: Recent Developments
In June 2026, Carro entered Australia through the acquisition of CarPlace, a used car sales platform operated by Autoleague. The move gave Carro a direct physical presence in Western Australia, Queensland, and Victoria, covering three of Australia’s four largest automotive markets. Financial terms were not disclosed, but the development is important because it shows that online used car platforms are adding physical retail and inspection networks to improve customer trust.
In March 2026, the UK Competition and Markets Authority cleared Constellation Developments’ deal, through British Car Auctions, to buy ABVR Holdings, the owner of Aston Barclay. BCA and Aston Barclay both provide used vehicle auction services to large business sellers and buyers in Great Britain. The approval shows that auction infrastructure remains a key part of the used car value chain, especially for fleet sellers, dealers, and remarketing companies.
In 2025, the used car market also showed a clear shift toward online transaction support. eBay completed its acquisition of Caramel in February 2025 to improve online vehicle buying and selling. Caramel supports title checks, identity verification, financing, insurance, transport, paperwork, and ownership transfer, which are major pain points in digital used car transactions.
Used Car Market: Mergers
The most notable merger-style consolidation activity was seen in the UK B2B vehicle auction space. In March 2026, the CMA cleared the BCA and Aston Barclay transaction after an in-depth review. The regulator noted that both companies operate in used vehicle auction services for large national business vendors and buyers, making the case directly relevant to the organized used car remarketing segment.
This development indicates that large automotive service groups are strengthening their control over vehicle supply, auction access, and remarketing networks. In the used car market, such consolidation can improve operational efficiency, vehicle movement, and dealer access to inventory. However, regulatory review remains important because auction services influence pricing, supply visibility, and wholesale competition.
Used Car Market: Acquisitions
In January 2026, CARS24 acquired CarInfo, a Delhi-based vehicle information and management platform. The official deal value was not disclosed, while media reports estimated the transaction at around INR 400 crore . CarInfo’s data-led services are expected to strengthen CARS24’s vehicle ownership, history, and management ecosystem, which is important for improving transparency in used car buying.
In April 2025, CARS24 acquired Team-BHP, one of India’s most influential automotive communities. The acquisition was aimed at strengthening content, reviews, ownership discussions, and buyer trust around cars. This is strategically important because used car buyers often rely on peer reviews, expert opinions, and real ownership feedback before making purchase decisions.
In February 2025, eBay completed the acquisition of Caramel to make vehicle transactions easier on its platform. The acquisition added services such as payment support, paperwork, title transfer, financing, shipping, and insurance. This shows that online used car platforms are now investing beyond listing models and moving toward full transaction enablement.
Used Car Market: Funding
In December 2025, AUTO1 Group expanded its inventory financing capacity to EUR 1.6 billion through an upsized and extended asset-backed securitisation facility. The financing supports used car inventory across Europe and helps the company maintain supply availability for dealers and consumers. This development highlights the importance of structured financing in used car operations, where inventory holding capacity directly affects sales scale.
In September 2025, Carro raised USD 60 million in a round led by Cool Japan Fund, Japan’s sovereign wealth fund. The funding was aimed at accelerating demand for Japanese cars across Asia Pacific, including used vehicles and plug-in hybrid models. This is a notable government-linked investment because it connects used car trade with regional demand for Japanese automotive brands.
In March 2025, Spinny raised USD 131 million i n funding led by Accel Leaders Fund. Existing investors also participated, according to reported sources. The funding supports Spinny’s full-stack used car retail model and reflects continued investor interest in organized, inspection-led, and finance-supported used car platforms in India.
Research Methodology
Methodology Area | Coverage Details |
|---|---|
Primary Research | Interviews with manufacturers, suppliers, distributors, consultants, procurement teams, and industry experts. |
Secondary Research | Company filings, annual reports, regulatory databases, government publications, trade associations, and verified industry sources. |
Data Validation | Cross-verification through source triangulation, historical trend review, demand-side checks, and supply-side assessment. |
Market Estimation | Bottom-up and top-down analysis based on product demand, regional consumption, company presence, and application-level usage. |
Forecasting Approach | Forecasts based on regulatory shifts, infrastructure investment, technology adoption, pricing trends, industrial expansion, and end-use demand. |
Quality Review | Analyst review, peer validation, outlier checks, internal consistency review, and final publication approval. |
AI Policy | AI is not used as a primary data source. All published insights are reviewed against human-verified evidence. |
Competitive Landscape
The market is characterized by intense competition among established players and emerging companies. Strategic partnerships, mergers and acquisitions, and product innovation are key strategies employed by market participants.
Key Market Players
CarMax Business Services LLC
AutoNation Inc.
Cox Automotive Inc.
TrueCar Inc.
eBay Inc.
Alibaba Group Holding Limited
Asbury Automotive Group Inc.
Group 1 Automotive Inc.
Lithia Motors Inc.
Arnold Clark Automobiles Limited
Pendragon PLC
Other Key Players
Meet the Team
This report was prepared by our expert analysts with deep industry knowledge and research experience.
Pratiksha is market research analyst with strong experience in industry research, market forecasting, and competitive analysis. She specializes in identifying market trends, evaluating growth opportunities, and preparing data-driven insights across global industries. Her work supports businesses in understanding market dynamics, customer demand, regional opportunities, and strategic investment areas.
Sayali brings more than 5 years of experience to Globe Market Research, supporting the accuracy, clarity, and relevance of research content across multiple industries. She reviews market data, segment analysis, competitive insights, and industry trends to ensure each report meets strong quality standards and provides practical value to business decision-makers. Her expertise spans healthcare, information technology, consumer goods, and diverse cross-industry domains. With a strong focus on data reliability, structured analysis, and clear presentation, Sayali helps ensure that each research output delivers well-reviewed insights for clients, investors, consultants, and industry stakeholders.
Frequently Asked Questions
Related Reports
More in Automotive and Transportation
Motorsports Sponsorship Market to hit USD 11.9 billion by 2035
Global Motorsports Sponsorship Market Size, Share Analysis By Type (Race Teams, League Organizers and Promoters, Track Owners and Runners), By Race Series (Formula Racing, One-Make Series, Touring Car Racing, Stock Car Racing, GT Racing, Rally and Off-Road Racing, Motorbike Racing), By Sponsor Category (Automotive Companies, Energy and Lubricants, Technology Companies, Financial Services, Consumer Goods, Telecom and Media, Others), By Sponsorship Asset (Team Sponsorship, Driver Sponsorship, Event Sponsorship, Track and Venue Sponsorship, Digital and Streaming Sponsorship, Esports and Sim Racing Sponsorship), By Regional Insights, Business plan and Project Report, Investment Opportunities, Profitability, Industry Trends, Leading Companies and Growth Forecasts By 2025-2035
Inboard Electric Motors Market to hit 13.1 Bn by 2035
Global Inboard Electric Motors Market Size By Type(Low Power Below 10 HP, Medium Power 10 to 35 HP, Large Power Above 35 HP), By Application (Civil Entertainment, Municipal, Commercial, Other Applications), By Boat / Vessel Type (Recreational Boats, Yachts, Fishing Boats, Workboats, Passenger Boats, Commercial Vessels), By Battery Type (Lithium-ion Batteries, Lead-acid Batteries, Nickel-based Batteries, Other Battery Types), By Sales Channel (OEM, Aftermarket), By End User (Individual Boat Owners, Commercial Operators, Tourism and Leisure Operators, Municipal Authorities, Marine Transport Operators), By Regional Insights, Business plan and Project Report, Investment Opportunities, Profitability, Industry Trends, Leading Companies and Growth Forecasts by 2025-2035
Automotive AI Agents Market to hit 16.5 Bn by 2035
Global Automotive AI Agents Market By Agent Type (Conversational AI Agents, Autonomous Driving AI Agents, Predictive Maintenance AI Agents, Fleet Management AI Agents and Others), By Vehicle Type (Passenger Vehicles, Commercial Vehicles, Electric Vehicles (EVs), Autonomous Vehicles), By Application (Driver Assistance & Safety, In-Vehicle Virtual Assistants, Predictive Maintenance, Fleet & Logistics Management, Infotainment Personalization), By Deployment Type (Cloud-Based AI Agents, Edge/On-Board AI Agents, Hybrid Deployment), By Regional Insights, Business plan and Project Report, Investment Opportunities, Profitability, Industry Trends, Leading Companies and Growth Forecasts by 2025-2035
Chauffeur Car Market to Exceed USD 403.8 Billion by 2035
By Service Type (Business Travel Services, Leisure Travel Services, Airport Transfers, Event-specific Services), By Vehicle Type (Luxury Cars, Executive Cars, SUVs, Vans, Limousines), By Customer Type (Corporate Clients, Individual Customers, Tourist and Leisure Travelers), By Regional Insights, Business plan and Project Report, Investment Opportunities, Profitability, Industry Trends, Leading Companies and Growth Forecasts by 2025-2035