

Revenue, 2026
USD 12.2 Bn
Forecast, 2035
USD 23.3 Bn
CAGR, 2026-2035
7.3%
Report Coverage
Global
Market Size and Forecast
Visual effects involve the creation or modification of digital imagery that cannot be produced efficiently through live-action filming alone. VFX services include computer-generated imagery, compositing, animation, simulation effects, digital environments, matte painting, motion capture and virtual production. These technologies allow studios to create realistic characters, complex action sequences and large-scale environments while improving production flexibility, safety and creative control.
The Visual Effects (VFX) Market was valued at USD 12.2 bn in 2026 and is projected to reach approximately USD 23.3 bn by 2035, growing at a CAGR of 7.3%. North America is expected to account for 45.3% of the market by 2035, representing approximately USD 10.5 bn. Market growth is being supported by increasing demand for high-quality visual content across movies, television, streaming platforms, video games, advertisements and immersive entertainment. The U.S. VFX Market was valued at USD 3.8 bn in 2026 and is expected to reach approximately USD 7.1 bn by 2035, growing at a CAGR of 7.2% from 2026 to 2035.
Key Parameter | Report Details |
|---|---|
Market Revenue, 2026 | USD 12.2 Billion |
Projected Revenue, 2035 | USD 23.3 Billion |
CAGR, 2026-2035 | 7.3% |
Largest Region | North America, 45.3% Share by 2035 |
U.S. Market Revenue, 2026 | USD 3.8 Billion |
U.S. CAGR, 2026-2035 | 7.2% |
Market Concentration | Medium |
Base Year | 2025 |
Forecast Period | 2026-2035 |
Demand is also being influenced by the continued expansion of film production and digital-video advertising. The World Intellectual Property Organization reported that global box-office revenue reached USD 32.8 billion in 2025, supported by the recovery of international film production. The Interactive Advertising Bureau projects that U.S. digital-video advertising spending will exceed USD 80 billion in 2026, increasing by 11% and accounting for more than 60% of total television and video advertising expenditure. These content investments are increasing the requirement for VFX, animation, virtual production and post-production services.
Agentic AI is improving VFX production by coordinating shot planning, motion tracking, rotoscoping, compositing, asset generation and quality review. Adobe’s April 2026 survey found that creative professionals used AI in more than 40% of their projects. About 94% produced content faster, most reported productivity improvements of at least 50%, and average time savings reached 17 hours per week.
Human control will remain important as autonomous creative workflows expand. Adobe’s June 2026 survey of more than 16,000 creators found that 75% considered creative AI integrated or essential to their work, while 85% wanted final creative decisions to remain human-led. Autodesk Flow Studio already automates motion tracking, compositing and scene generation while providing editable camera tracks, masks and motion-capture data for professional VFX pipelines.
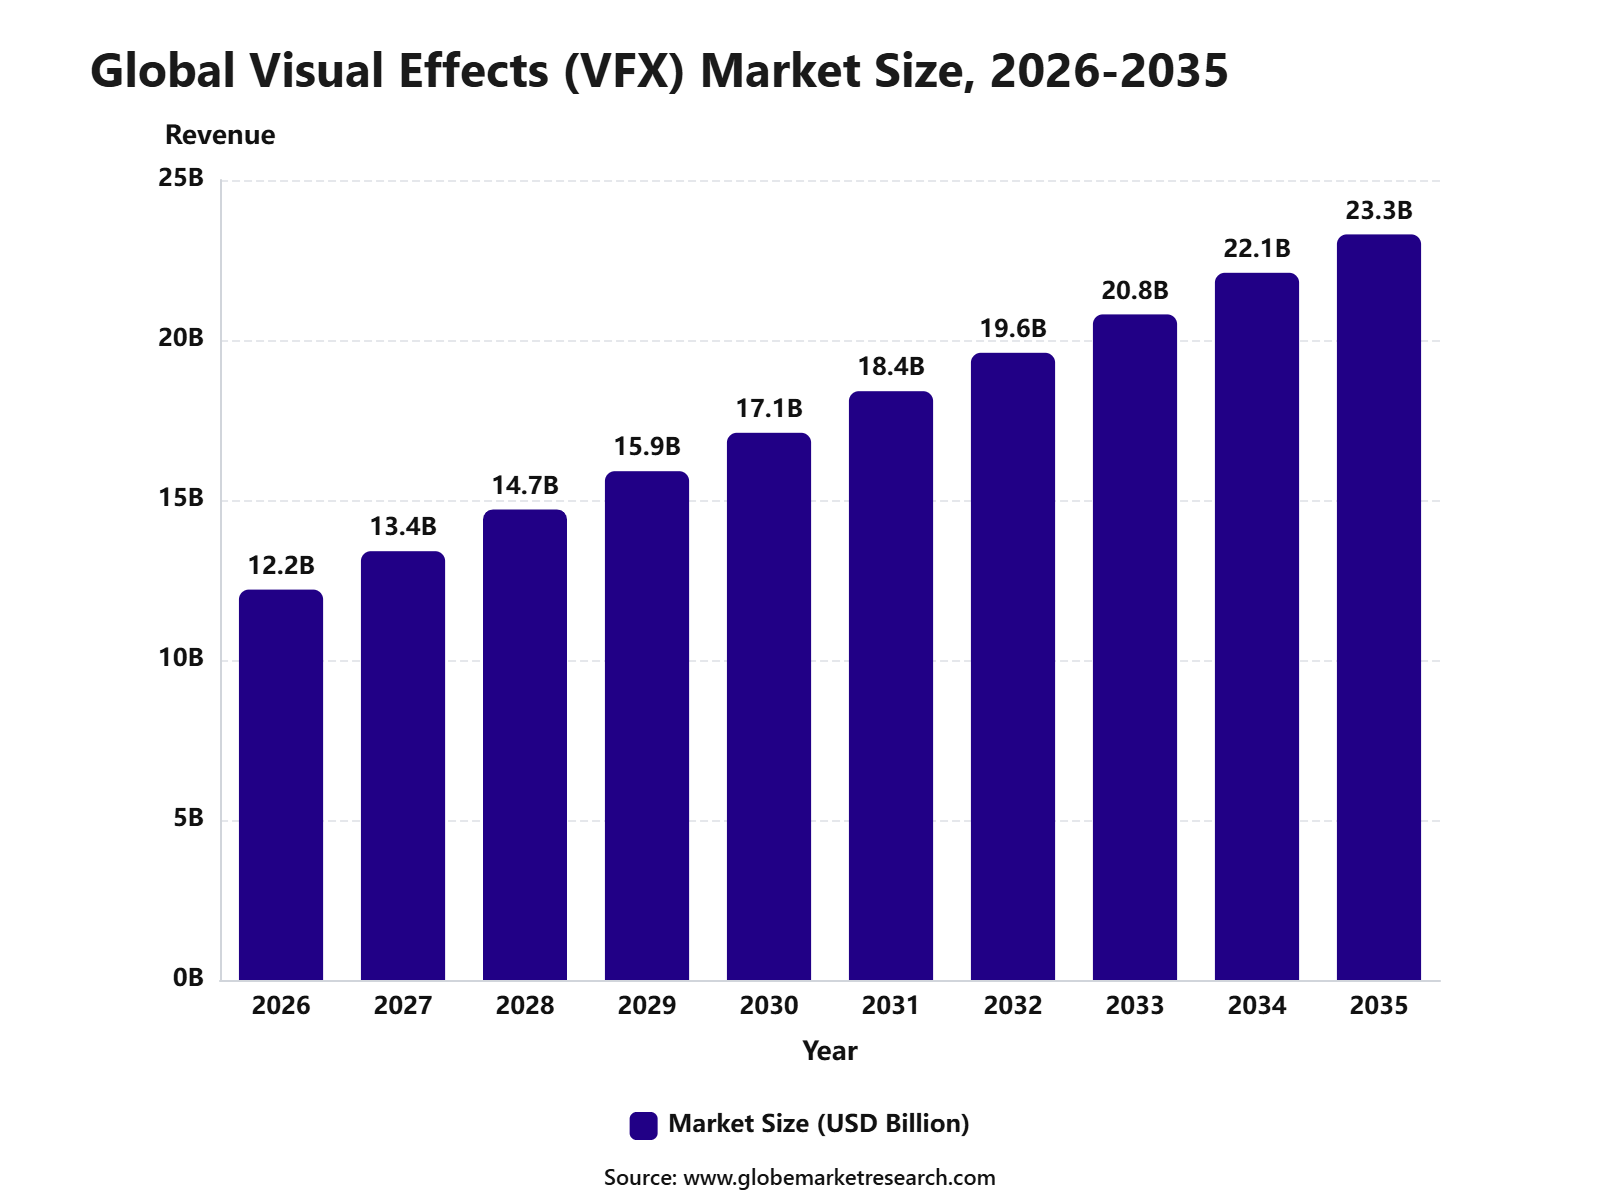 iThe graph shows projected market growth until 2035 based on CAGR analysis. Actual outcomes may vary depending on changing demand, competition, and economic factors.To gain greater insights - request a sample report PDF
Key Market Insights
Artificial Intelligence (AI) led the technology segment with a 76.1% share, supported by its increasing use in automated editing, digital content creation, motion tracking, rendering, and scene enhancement.
Movies accounted for the largest application share at 39.5%, driven by rising demand for realistic environments, digitally created characters, complex action sequences, and high-quality cinematic experiences.
Software dominated the component segment with a 60.8% share, reflecting the widespread adoption of compositing, modelling, rendering, simulation, animation, and post-production platforms.
Animation held the leading product share of 36.7%, supported by its expanding use across films, television programs, gaming, advertisements, streaming platforms, and digital media content.
North America led the regional market with a 45.3% share, supported by established production studios, advanced post-production infrastructure, skilled creative professionals, and strong investment in digital entertainment.
The U.S. Visual Effects (VFX) market was valued at USD 3.8 billion and is projected to expand at a CAGR of 7.2%, supported by continued spending on films, streaming content, television productions, gaming, and advertising.
VFX Market Usage Area Statistics
Based on data from WIPO, the Visual Effects market is supported by strong film production, global box office activity, and rising streaming investment. The production of 9,628 films, combined with more than USD 100 billion in streaming revenue and USD 42 billion in content spending, creates steady demand for VFX across theatrical films, television series, animation, and digital content.
Metric | Latest Value | Practical Use |
|---|---|---|
Film Production | 9,628 films | VFX is used for action sequences, digital environments, creatures, simulations, de-aging, set extensions, and post-production enhancement. |
Box Office Demand | USD 32.8 billion | Strong global box office revenue supports demand for premium theatrical releases and VFX-intensive films. |
Streaming Content | More than USD 100 billion in revenue | Streaming platforms use VFX across films, series, science fiction, fantasy, animation, documentaries, and international original content. |
Content Spending | USD 42 billion | High streaming content investment increases demand for post-production studios, animation teams, rendering infrastructure, and VFX production pipelines. |
Technology Insights
Artificial intelligence accounted for the leading technology share of 76.1%. AI is increasingly used for rotoscoping, object removal, background generation, motion tracking, facial animation, image enhancement and scene reconstruction. These tools reduce repetitive manual work while allowing artists to focus on composition, storytelling and final visual quality.
A 2026 survey of creative professionals found that AI was being used in more than 40% of their projects. About 94% said AI helped them produce content faster, while average time savings reached 17 hours per week. These broader creative-work indicators show why AI-assisted production is becoming central to VFX workflows.
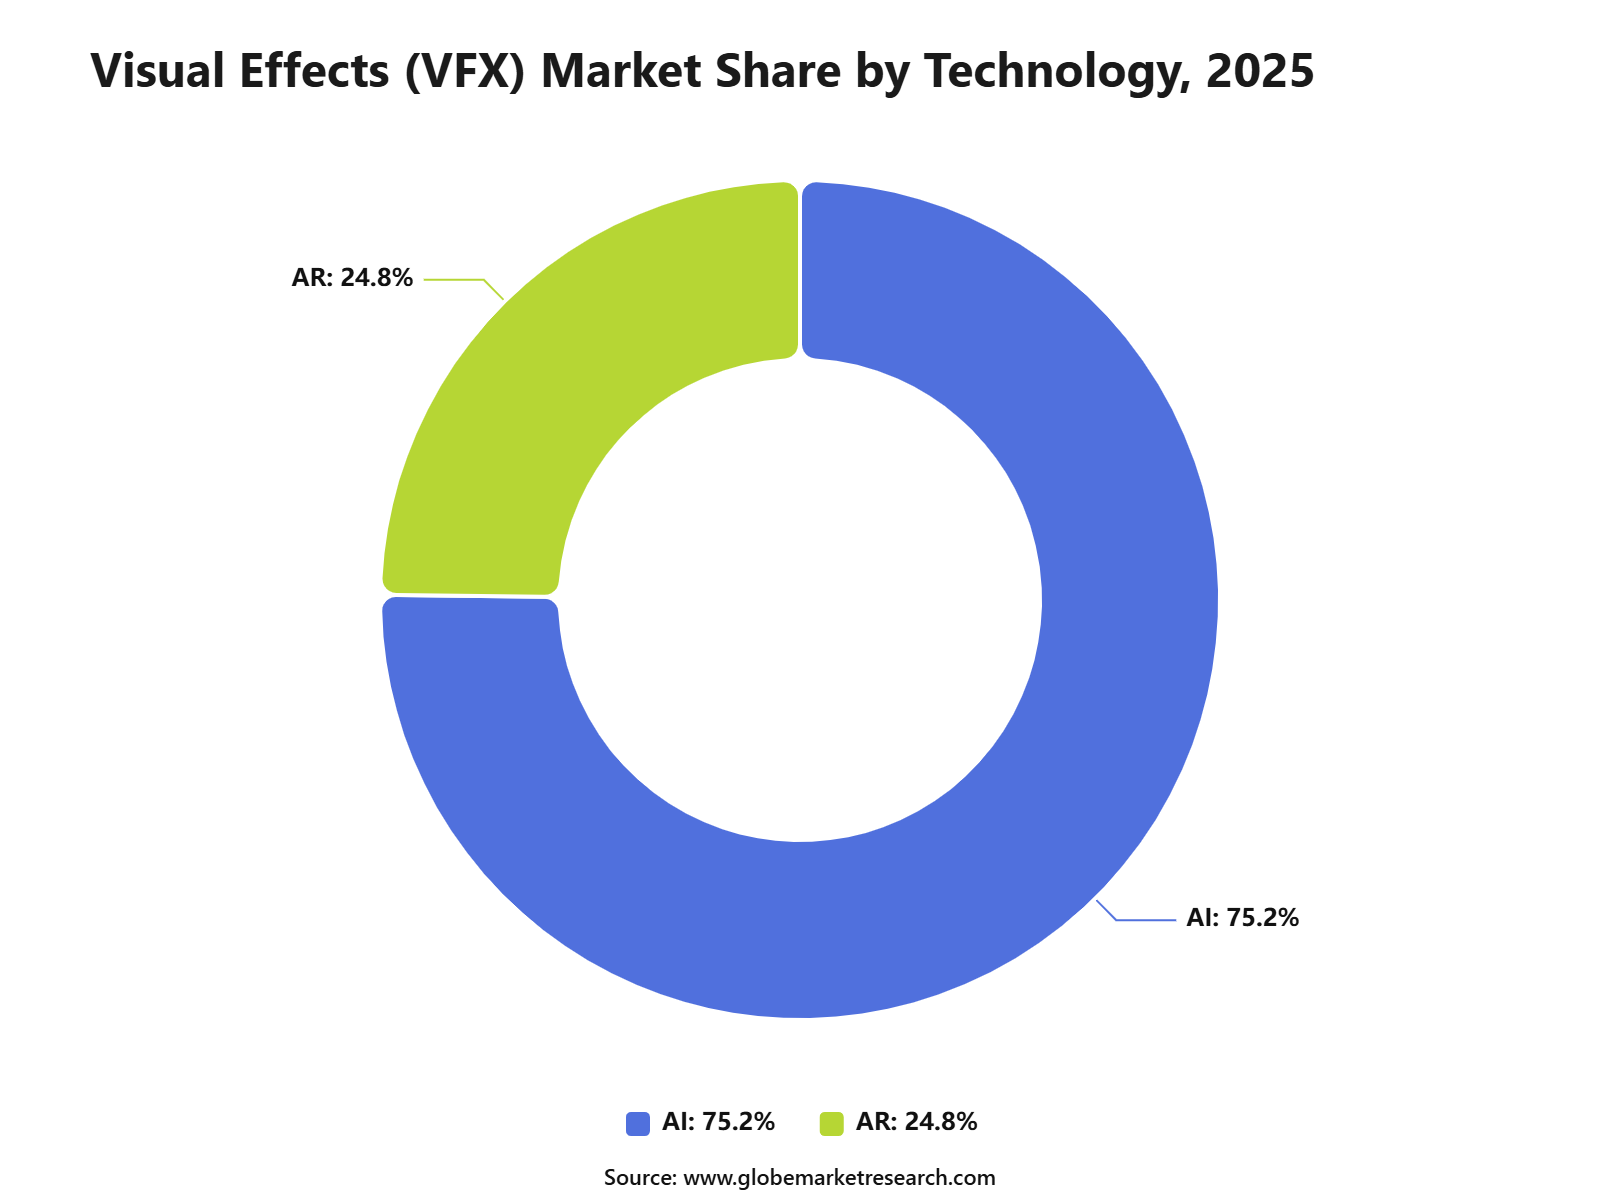 iThe graph shows projected market growth until 2035 based on CAGR analysis. Actual outcomes may vary depending on changing demand, competition, and economic factors.To gain greater insights - request a sample report PDF
Application Insights
Movies held the largest application share of 39.5%. Feature films use VFX to create digital environments, creatures, action scenes, crowd simulations, set extensions and effects that would be costly or unsafe to capture physically. Demand is also supported by the rising visual quality expected from theatrical and streaming releases.
The Academy reported that 317 feature films released during 2025 were eligible for the 98th Academy Awards, including 201 films that met the additional Best Picture requirements. This production activity creates a broad pipeline of projects requiring compositing, animation, simulation and post-production services.
Component Insights
Software represented the leading component share of 60.8%. VFX production depends on applications for modelling, animation, rendering, compositing, motion capture, colour management and production tracking. Software platforms also connect artists working across different locations and help studios manage revisions, approvals and large digital assets.
A 2025 survey found that 60% of creators had used more than one generative AI tool within three months. Editing, upscaling and enhancement were used by 55%, while 52% used the technology to generate new image and video assets. This multi-tool approach supports continued demand for connected and specialized creative software.
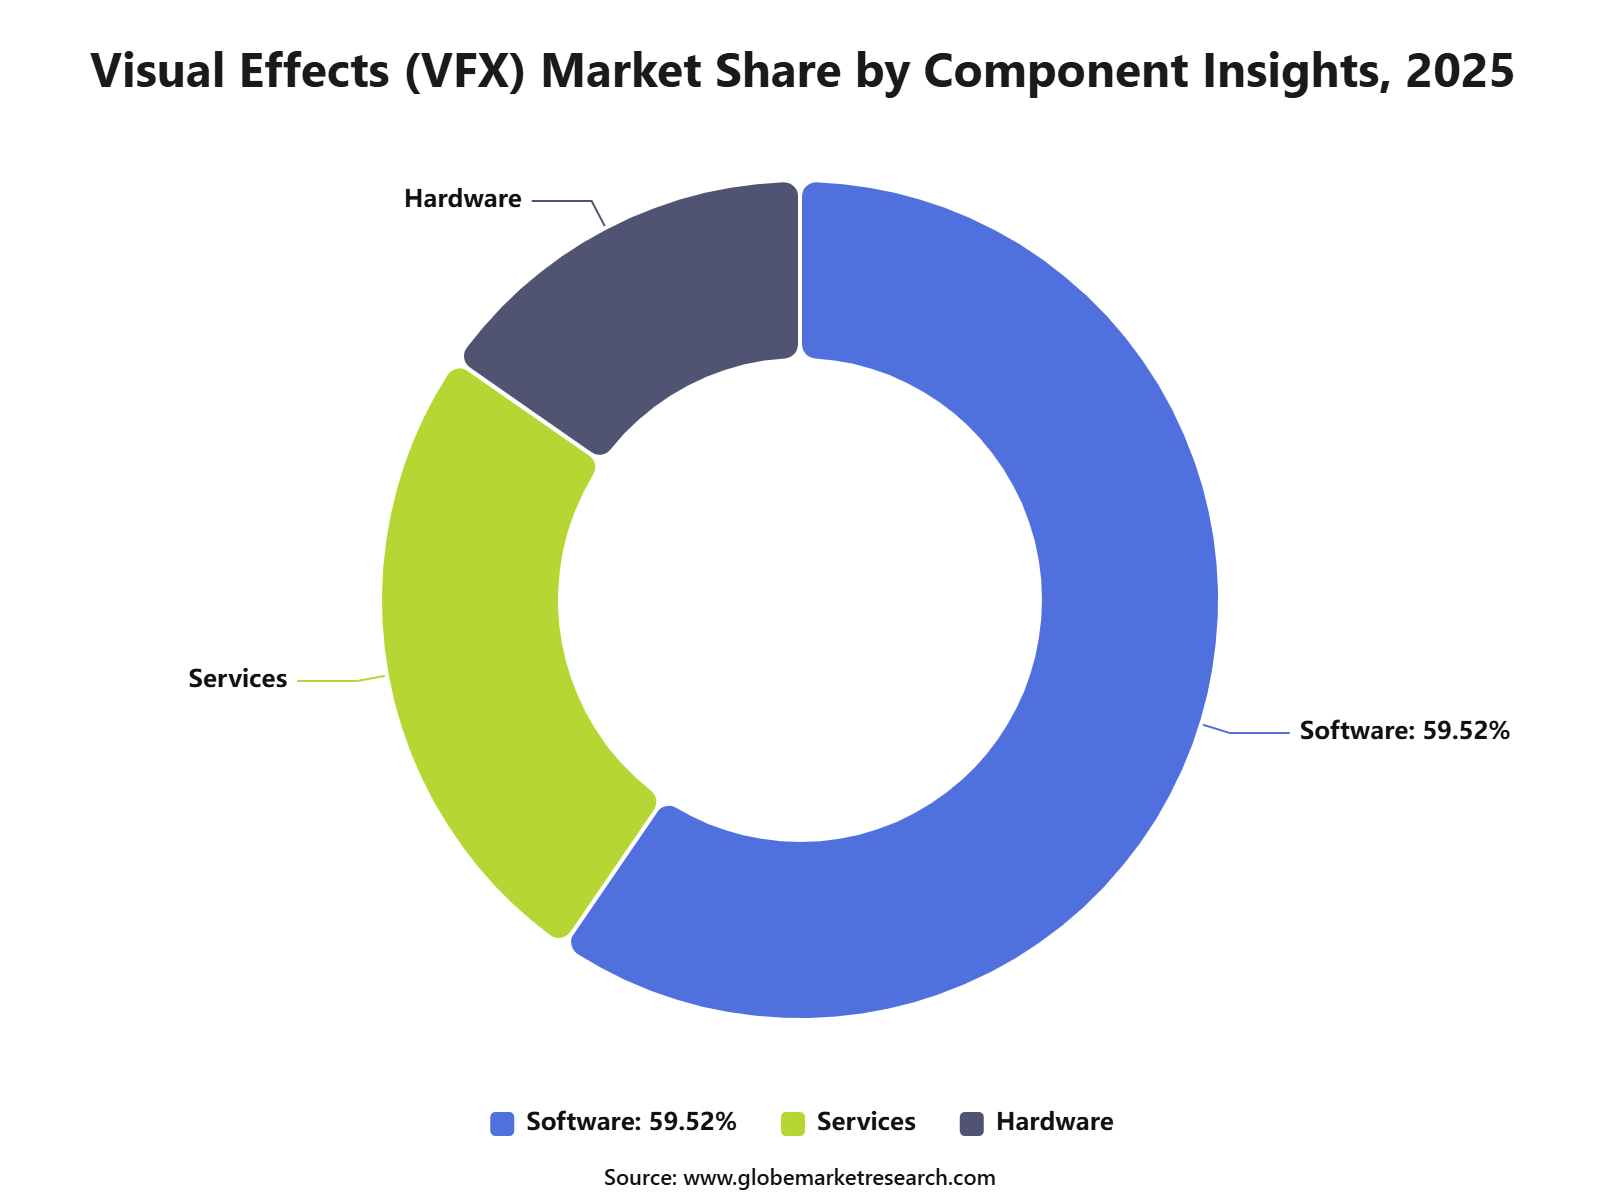 iThe graph shows projected market growth until 2035 based on CAGR analysis. Actual outcomes may vary depending on changing demand, competition, and economic factors.To gain greater insights - request a sample report PDF
Product Insights
Animation accounted for the largest product share of 36.7%. It is used to create digital characters, creatures, vehicles, environments and objects that cannot be produced through live-action filming alone. Animation is also closely connected with rigging, motion capture, lighting, simulation and rendering within the wider VFX process.
The Academy announced that 35 animated feature films were eligible for consideration at the 98th Academy Awards in 2025. Animated films could also qualify in other categories, including Best Picture and Visual Effects, showing the growing overlap between animation, cinematic production and advanced digital effects.
Geography Analysis
North America led the Visual Effects Market with a share of 45.3%. The region has a large film and television production base, experienced creative professionals, advanced post-production infrastructure and strong demand from streaming, advertising and gaming. Production incentives in the United States and Canada also support local VFX activity.
The U.S. film and television industry supported 2.01 million jobs, generated USD 202 billion in wages and included more than 162,000 businesses, according to figures published in 2026. Canada’s screen-production sector supported 181,360 jobs during 2024/25, while foreign production activity increased by 9.5%, strengthening North America’s VFX production ecosystem.
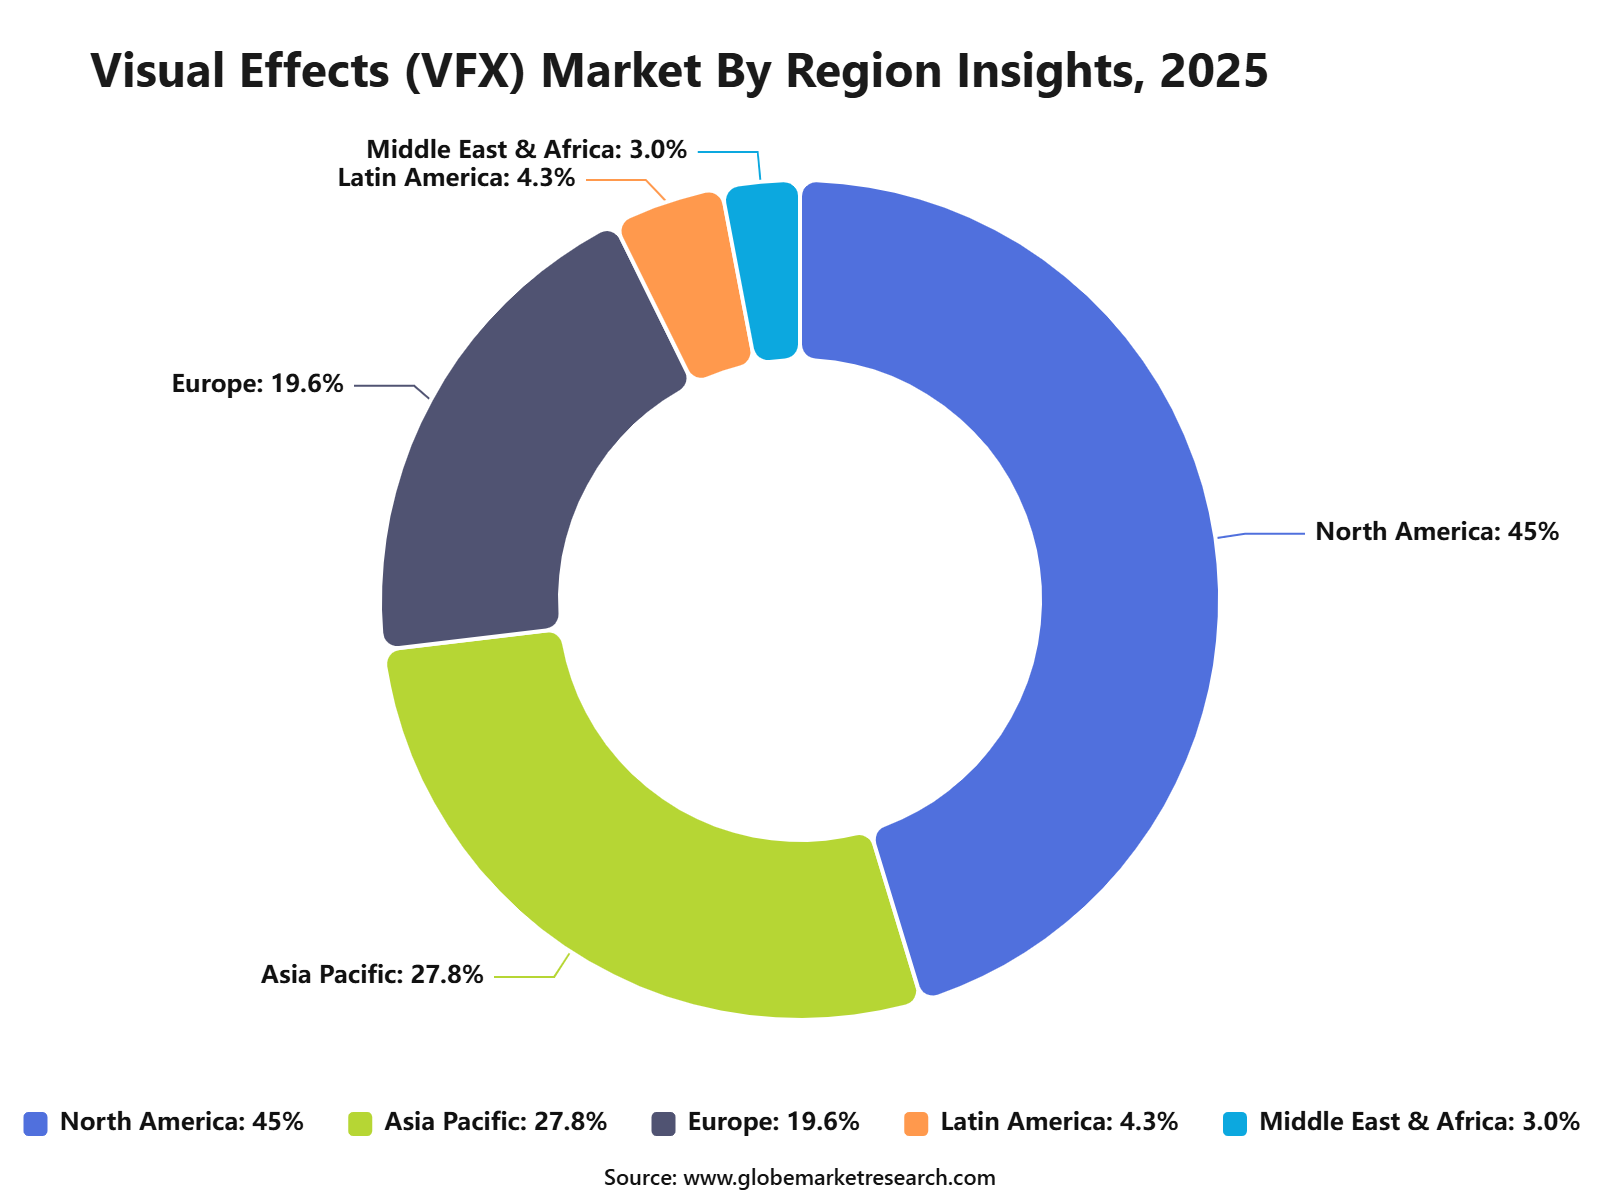 iThe graph shows projected market growth until 2035 based on CAGR analysis. Actual outcomes may vary depending on changing demand, competition, and economic factors.To gain greater insights - request a sample report PDF
The U.S. Visual Effects Market was valued at USD 3.8 billion and is projected to grow at a CAGR of 7.2%. Growth is being supported by continued film and television production, rising use of virtual production, AI-assisted editing and greater demand for high-quality visual content across theatrical, streaming and advertising projects.
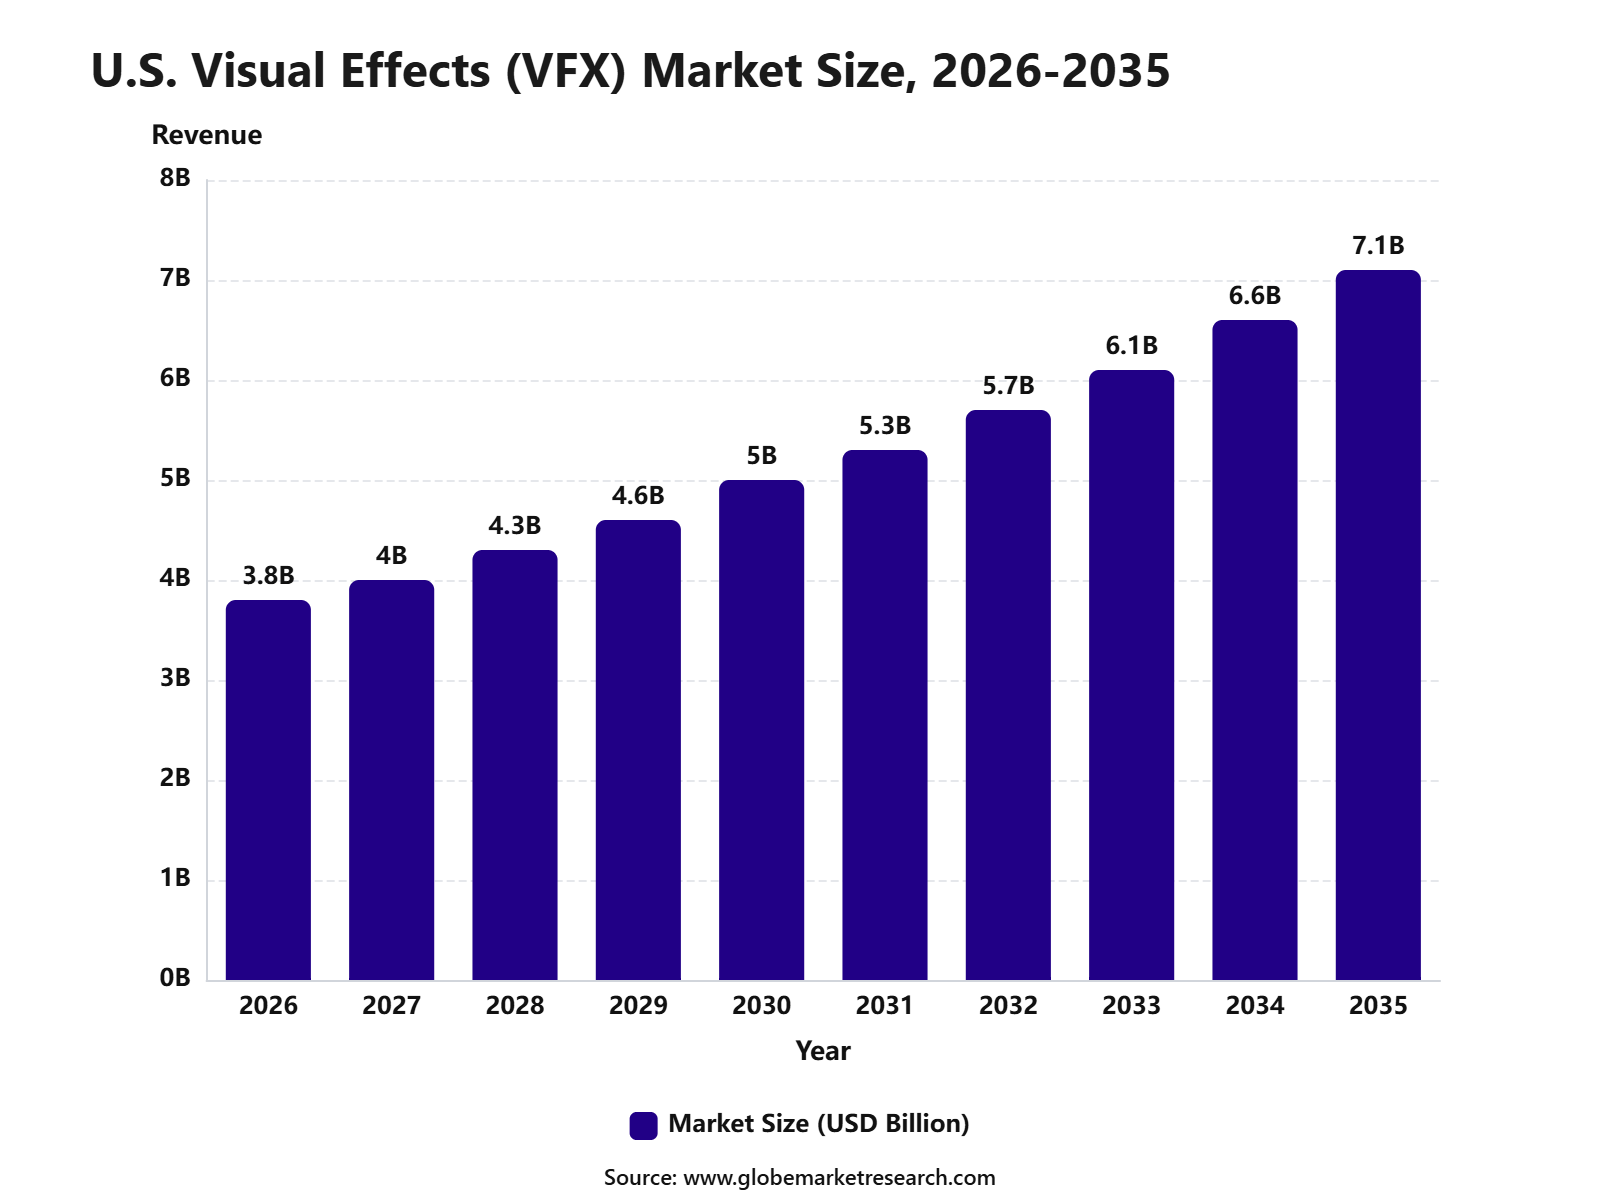 iThe graph shows projected market growth until 2035 based on CAGR analysis. Actual outcomes may vary depending on changing demand, competition, and economic factors.To gain greater insights - request a sample report PDF
Key Market Segments
By Technology
Artificial Intelligence (AI)
Augmented Reality (AR)
By Application
Movies
Television
Gaming
Advertisements
By Component
Software
Services
Hardware
By Product
Animation
Simulation FX
Compositing
Modelling
Matte Painting
By Region
North America
Europe
Asia Pacific
Latin America
Middle East and Africa
Drivers Impact Analysis
The Visual Effects Market is driven by rising demand for streaming content, high-budget films, gaming visuals, advertising, virtual production, and immersive entertainment. VFX is becoming central to storytelling as studios use digital environments, character animation, compositing, simulation, and post-production effects to improve audience experience.
North America remains a major value region due to strong film studios, OTT platforms, gaming companies, advertising agencies, and virtual production infrastructure. The U.S. leads regional demand because of Hollywood production, streaming originals, large post-production houses, and advanced creative technology adoption.
Impact Factor | Estimated CAGR Impact | Regional Relevance | Market Impact |
|---|---|---|---|
Rising streaming content production | +2.1% | North America, Europe, Asia Pacific | Drives consistent VFX project demand. |
Growth in high-budget films and series | +1.8% | U.S., UK, Canada, India, South Korea | Supports premium visual work. |
Expansion of gaming and cinematic content | +1.5% | North America and Asia Pacific | Adds animation and real-time effects demand. |
Advertising and brand content growth | +1.2% | Global media markets | Expands short-form VFX usage. |
Virtual production adoption | +1.0% | U.S., Canada, UK, Australia | Improves production efficiency. |
Restraints Impact Analysis
The market faces restraints from high production cost, skilled artist shortages, tight delivery timelines, and pricing pressure from global outsourcing. VFX projects require specialized software, rendering capacity, creative talent, quality control, and strong coordination with studios. Another restraint is the uncertain production cycle in film and streaming. Changes in content budgets, delayed releases, and shifting platform strategies can affect vendor pipelines and revenue visibility.
Impact Factor | Estimated CAGR Impact | Regional Relevance | Market Impact |
|---|---|---|---|
High VFX production cost | -1.0% | Global studios and vendors | Limits smaller project budgets. |
Skilled artist shortage | -0.9% | North America, Europe, Asia Pacific | Slows project delivery. |
Tight turnaround timelines | -0.8% | Film, OTT, advertising | Increases operational pressure. |
Pricing pressure from outsourcing | -0.6% | Global VFX service markets | Affects vendor margins. |
Uncertain content spending cycles | -0.5% | Streaming and studio markets | Impacts project flow. |
Opportunities Impact Analysis
Opportunities are strong in virtual production, real-time rendering, AI-assisted workflows, animation, gaming cinematics, immersive media, advertising VFX, and episodic streaming content. These areas benefit from rising visual quality expectations across entertainment and digital media. Higher-value opportunities are emerging in LED volume stages, digital doubles, simulation effects, generative asset creation, virtual reality content, and cloud-based rendering. Companies that reduce production time while maintaining visual quality can capture stronger long-term demand.
Impact Factor | Estimated CAGR Impact | Regional Relevance | Market Impact |
|---|---|---|---|
Virtual production and LED stages | +2.0% | North America, Europe, Asia Pacific | Builds high-value production opportunity. |
AI-assisted VFX workflows | +1.7% | Advanced post-production markets | Speeds asset and compositing work. |
Gaming cinematics and real-time content | +1.4% | U.S., Canada, Japan, South Korea | Adds cross-media demand. |
Animation and digital character work | +1.1% | Global media production hubs | Expands premium project scope. |
Cloud rendering and remote collaboration | +0.9% | Distributed VFX teams | Improves scalability. |
Challenges Impact Analysis
The main challenge is maintaining creative quality while controlling cost and delivery timelines. VFX studios need to manage artists, supervisors, render farms, software pipelines, client revisions, and final delivery standards across complex productions. Another challenge is adapting to fast-changing technologies. Real-time engines, AI tools, virtual production, and cloud workflows are changing traditional pipelines, so vendors must update skills and infrastructure regularly.
Impact Factor | Estimated CAGR Impact | Regional Relevance | Market Impact |
|---|---|---|---|
Managing creative quality at scale | -0.9% | Large VFX studios | Affects client retention. |
Frequent technology upgrades | -0.8% | Global VFX vendors | Raises investment needs. |
Revision-heavy production cycles | -0.7% | Film and streaming projects | Increases labor cost. |
Data security and IP protection | -0.6% | Studio and vendor networks | Adds compliance pressure. |
Balancing automation with creative control | -0.5% | AI-enabled workflows | Requires careful process design. |
Go-to-Market and Sales Economics
According to Globe Market Research, the go-to-market approach for the Visual Effects Market should target film studios, streaming platforms, television producers, advertising agencies and game developers. Vendors should enter projects during pre-production through concept design, previsualization and VFX planning. Global film and television production spending reached USD 8.7 billion in the first quarter of 2026, covering 332 productions that began shooting.
Sales strategies should emphasize fast delivery, predictable pricing and the ability to adapt content across connected television, social media and online video formats. U.S. digital video advertising expenditure is projected to exceed USD 80 billion in 2026, with annual growth of 11%. This creates demand for motion graphics, product visualization, digital environments and short-form visual effects designed for multiple campaign formats.
The strongest commercial model will combine project fees with software subscriptions, cloud rendering, virtual production support, asset management and long-term production agreements. Studios can also generate recurring income from reusable environments, digital characters and effects libraries. Autodesk’s Media and Entertainment business generated USD 332 million in fiscal 2026 revenue, indicating continued spending on professional animation and post-production technology.
Revenue Landscape Across
Film and high-end television remain major revenue channels for VFX studios, particularly for complex environments, crowd simulation, digital characters and final compositing. The United Kingdom recorded GBP 6.8 billion in combined film and high-end television production expenditure in 2025. High-end television represented GBP 4.03 billion of this activity, providing a substantial project base for post-production suppliers.
Gaming provides revenue opportunities across cinematics, real-time effects, character development, environment creation and live-content updates. U.S. consumer spending on video games reached USD 60.7 billion in 2025, while subscription-service spending increased by 20%. This supports demand for VFX providers that can produce high-quality assets while meeting real-time performance, platform compatibility and continuous update requirements.
Streaming content investment supports revenue from episodic VFX, virtual sets, title design, cleanup, localization and versioning services. Netflix added approximately USD 17.1 billion to its content assets during 2025. This level of content investment provides a broad production pipeline for specialist studios, although contracts must be secured through reliable delivery, international capacity and strict data-security controls.
Financial Impact
The financial impact of VFX services is influenced by shot complexity, revision cycles, rendering requirements, workforce costs and production location. From April 2025, eligible UK visual effects expenditure qualified for an enhanced 39% Audio-Visual Expenditure Credit. The removal of the usual qualifying-cost cap for VFX can reduce net production expenses and influence where international projects are completed.
Artificial intelligence can reduce time spent on background removal, compositing, cleanup and first-pass effects, but human review remains necessary for final quality. Adobe’s June 2026 research found that 48.6% of U.S. video creators reported substantial generative AI use for visual effects. VFX companies should therefore price AI-supported workflows around faster delivery while retaining specialist supervision and quality assurance.
Copyright, ownership and training-data concerns can create direct legal and commercial costs. Adobe found that 70.5% of U.S. creative professionals believed AI models should not be trained on artists’ work without consent. VFX contracts should clearly define asset ownership, approved AI tools, model provenance, client-data usage, licensing obligations and responsibility for potentially infringing outputs.
Common Visual Effects (VFX) Usage Areas
Metric | Practical Use |
|---|---|
Compositing | Combining live-action footage, CGI, matte paintings, and effects layers |
CGI creation | Creating creatures, vehicles, environments, digital doubles, and fantasy elements |
Matte painting | Building digital backgrounds, landscapes, cityscapes, and extended sets |
Simulation FX | Creating smoke, fire, water, explosions, destruction, particles, and weather effects |
Motion capture | Recording actor movement for digital characters, games, and virtual production |
Rotoscoping | Separating objects or characters from footage for cleanup, compositing, or effects |
Virtual production | Using LED walls, real-time engines, camera tracking, and in-camera VFX |
Game cinematics | Producing trailers, cutscenes, character effects, and real-time visual environments |
Recent Developments
Market News
In February 2026, Foundry released Nuke 17.0, adding native Gaussian Splat support, a new USD-based 3D system, expanded machine learning capabilities, and updated compositing workflows for modern VFX production.
In March 2026, Autodesk highlighted Flow Studio updates that made AI-powered animation and VFX tools available more broadly, including tools for animation, motion capture, camera tracking, and 3D scene generation from live-action footage.
In April 2026, Luma and Wonder Project launched Innovative Dreams, a production services company combining generative AI with traditional filmmaking, backed and supported by Amazon Web Services.
In April 2026, Luma reported that 21 AI-generated finalists were submitted to Cannes Lions after the company supported more than 400 AI-created ads in less than eight weeks.
In April 2026, Foundry’s Nuke 17.0 won a Product of the Year award at the NAB Show, reinforcing the importance of professional compositing tools as VFX workflows move toward AI, USD, Gaussian Splats, and virtual production.
Acquisitions
In March 2026, Netflix acquired InterPositive, a startup founded by Ben Affleck that develops AI-powered filmmaking tools. The deal is relevant to VFX because AI-assisted editing, previs, shot planning, and post-production workflows are becoming more important for studio pipelines.
In 2026, DNEG continued integrating Metaphysic after its 2025 acquisition by Brahma, DNEG Group’s AI and content technology company. The acquisition supports AI content creation, digital human workflows, and scalable video, image, and audio production technology.
Funding and Investments
In March 2026, Runway continued to expand its AI video and production ecosystem through Runway Studios, which works directly with filmmakers, studios, musicians, writers, and independent artists on AI-assisted creative projects.
In March 2026, Runway launched a USD 10 million Builder Fund to support early-stage companies building across AI, media, and world simulation. This supports the wider VFX ecosystem because AI video, simulation, and creative tooling are becoming part of production pipelines.
In April 2026, Luma’s production partnership with Wonder Project and AWS showed continued investment in AI-native filmmaking services. This is important because cloud support, generative video models, and professional production services are being combined into new VFX-adjacent business models.
In 2026, dedicated funding for traditional VFX studios remained selective. Capital was more visible in AI video generation, cloud rendering, virtual production, digital human tools, and creative AI platforms, where investors are targeting faster production cycles and lower-cost content creation.
Market Concentration
The consolidated side of the market includes established VFX studios, production software providers and major entertainment groups with advanced rendering capacity, experienced artists and long-standing relationships with film producers. High technology costs, complex project management and strict delivery requirements create notable entry barriers.
The fragmented side includes independent VFX studios, animation companies, freelance artists and regional post-production suppliers. These participants compete through specialized skills, flexible pricing and expertise in areas such as compositing, simulation, motion graphics, virtual production and advertising content.
Competitive Landscape
The market is characterized by intense competition among established players and emerging companies. Strategic partnerships, mergers and acquisitions, and product innovation are key strategies employed by market participants.
Key Market Players
The Foundry Visionmongers Limited
Technicolor SA
Digital Domain
Framestore
Pixomondo
Adobe Inc.
Animal Logic
Cinesite
Weta FX
Industrial Light & Magic
DNEG
Other Key Players
Research Methodology
This market study is prepared using a combination of primary and secondary research. Primary research includes discussions with manufacturers, suppliers, distributors, consultants, industry experts, and end users. Secondary research covers company reports, government databases, trade associations, technical publications, regulatory sources, and trusted industry documents. The collected information is used to assess market demand, pricing trends, technology adoption, competitive activity, and regional performance.
AI language models are not used as primary data sources, and publicly available AI-generated content is not treated as market evidence. Computational tools may be used to support data processing, translation, data classification, and pattern identification. However, every published assessment is supported by verified sources, human review, and primary market discussions.
Market estimates are developed through top-down and bottom-up approaches and validated using data triangulation. Revenue, production, shipment, pricing, and application-level data are compared across multiple sources. Forecasts consider economic conditions, regulatory changes, investment activity, innovation, supply chain developments, and industry risks. All findings are reviewed through source verification and internal quality checks before publication.
Part I
Source Management & Input Data Standards
Who provides data, how sources are qualified, and what types of evidence are admissible.
Part II
Research Scope & Market Coverage
How we define the markets we assess and the parameters that govern each product.
Part III
Data Collection, Verification & Submission
The mechanics of gathering, cross-checking, and hierarchically ranking evidence.
Part IV
Assessment Determination & Quality Controls
How raw data becomes a published assessment — normalisation, expert judgement, and outlier exclusion.
Part V
Publication, Corrections & Revision
Our publication schedule, corrections policy, and methodology review cycle.
Part VI
Independence, Ethics & Complaints
Conflict-of-interest policies, editorial independence, and how clients raise concerns.
Google · Preferred Sources
Don't miss the latest market research insights and industry updates on Google.
Add Globe Market Research as a preferred source in the Google app to see our reports, analysis, and market stories in your news suggestions.
Meet the Team
This report was prepared by our expert analysts with deep industry knowledge and research experience.
Kimaya brings more than five years of experience in market research, content review, and industry analysis to Globe Market Research. She plays an important role in maintaining the accuracy, clarity, consistency, and relevance of research content across a wide range of industries. Her responsibilities include reviewing market data, segment analysis, competitive landscapes, industry trends, company developments, and strategic insights. Each report is carefully assessed to ensure that the findings are supported by reliable data, presented in a structured format, and aligned with the information needs of business decision-makers. Kimaya has research experience across healthcare, information technology, consumer goods, and several cross-industry domains.
Prashant S. is a Research Analyst at Globe Market Research with more than four years of experience in market research and industry analysis. He specializes in the Aerospace and Defence, Automotive and Transportation, Semiconductor and Electronics, Information and Technology sectors, with expertise in market sizing, trend analysis, competitive assessment, and industry forecasting. He applies primary and secondary research, data validation, company analysis, and market estimation methods to deliver reliable insights for strategic planning and business decision-making.
Frequently Asked Questions
Related Reports
More in Information and Technology
South Korea Physical AI Market Size to Reach USD 3.6 billion by 2035
South Korea Physical AI Market Size, Share, Trends and Growth Analysis Report By Deployment (On-Device AI, Cloud-Based AI), By Component (Hardware, Software, Services), By Technology (Computer Vision, Speech and Natural Language Processing, Gesture and Movement Recognition, Reinforcement Learning and Control Systems, Other Technologies), By Robot Type (Service Robots, Humanoid and Social Robots, Collaborative Robots, Exoskeletons and Prosthetics, Mobile Robots and Drones, Industrial Robots), By Application (Healthcare, Manufacturing and Automotive, Logistics and Warehousing, Retail and Hospitality, Other Applications), By Technology Trends, Competitive Landscape, Strategic Opportunities and Growth Forecast, 2026-2035
Physical AI Market Size to hit USD 2,129.0 billion by 2035
Physical AI Market Size, Share, Trends and Growth Analysis Report By Component (Hardware, Software, Services), By Technology (Computer Vision, Machine Learning and Deep Learning, Natural Language Processing, Edge AI, Other Technologies), By Product (Robots, Exoskeletons, Autonomous Systems, Smart Appliances), By Application (Automation and Manufacturing, Logistics and Supply Chain, Healthcare, Automotive, Defense and Security, Retail, Education, Other End Uses), By Regional Insights, Technology Trends, Competitive Landscape, Strategic Opportunities and Growth Forecast, 2026-2035
Edtech SaaS Tools Market Size to hit USD 217.6 billion by 2035
EdTech SaaS Tools Market Size, Share, Trends and Growth Analysis Report By Software (Classroom Management Systems, Document Management Systems, Learning and Gamification Platforms, Learning Management Systems, Student Collaboration Systems, Assessment and Analytics Tools, Content Authoring Tools, Other Software), By Sector (Preschool, K-12, Higher Education, Other Education Sectors), By Deployment (Cloud-Based, Hybrid), By End Use (Businesses, Educational Institutions, Individual Learners and Consumers), By Regional Insights, Technology Trends, Competitive Landscape, Strategic Opportunities and Growth Forecast, 2026–2035
Marketing Technology Market Size to Reach USD 3,810.8 billion by 2035
Marketing Technology Market Size, Share, Trends and Growth Analysis Report By Marketing Type (Digital Marketing, Offline Marketing), By Product (Social Media Tools, Content Marketing Tools, Rich Media Tools, Marketing Automation Tools, Data and Analytics Tools, Sales Enablement Tools), By Deployment (Cloud-Based, On-Premises, Other Deployment Models), By Enterprise Type (Large Enterprises, Small and Medium-Sized Enterprises), By Application (IT and Telecommunication, Retail and E-commerce, Healthcare, Media and Entertainment, Sports and Events, BFSI, Real Estate, Other Applications), By Regional Insights, Technology Trends, Competitive Landscape, Strategic Opportunities and Growth Forecast, 2026-2035