

Revenue, 2025
$ 17.2 Bn
Forecast, 2035
$ 28.6 Bn
CAGR, 2025-2035
5.2%
Report Coverage
Global
Market Size and Forecast
The Global Gas Turbine MRO Market was worth USD 17.2 billion in 2025 and is expected to reach USD 28.6 billion by 2035, growing at a CAGR of 5.2% from 2025 to 2035. Based on this growth rate, the market is estimated to reach around USD 18.3 billion in 2026. Asia Pacific held the largest regional share of 52.5% in 2025, supported by rising power generation demand, expanding aviation activity, industrial energy use, and growing gas-fired power infrastructure.
Key Parameter | Report Details |
|---|---|
Market Revenue, 2025 | USD 17.2 Billion |
Projected Revenue, 2035 | USD 28.6 Billion |
CAGR (2025-2035) | 5.2% |
Largest Region | Asia Pacific |
Market Concentration/Structure | Medium/Moderately Consolidated |
Base Year | 2025 |
Forecast Period | 2025-2035 |
What is the Gas Turbine MRO Market ?
The Gas Turbine MRO Market includes maintenance, repair, and overhaul services used to improve turbine reliability, efficiency, safety, and operating life. These services cover inspection, component repair, parts replacement, performance testing, rotor maintenance, hot section repair, and engine overhaul. The market is closely linked with power plants, aviation turbines, oil and gas facilities, marine propulsion, and industrial power systems.
The market outlook remains steady as operators continue to focus on reducing downtime and extending the lifecycle of gas turbine assets. Growth can be attributed to aging turbine fleets, rising electricity demand, and higher use of gas turbines for flexible power generation. The expansion of predictive maintenance, digital monitoring, and advanced repair technologies is expected to support long-term market demand.
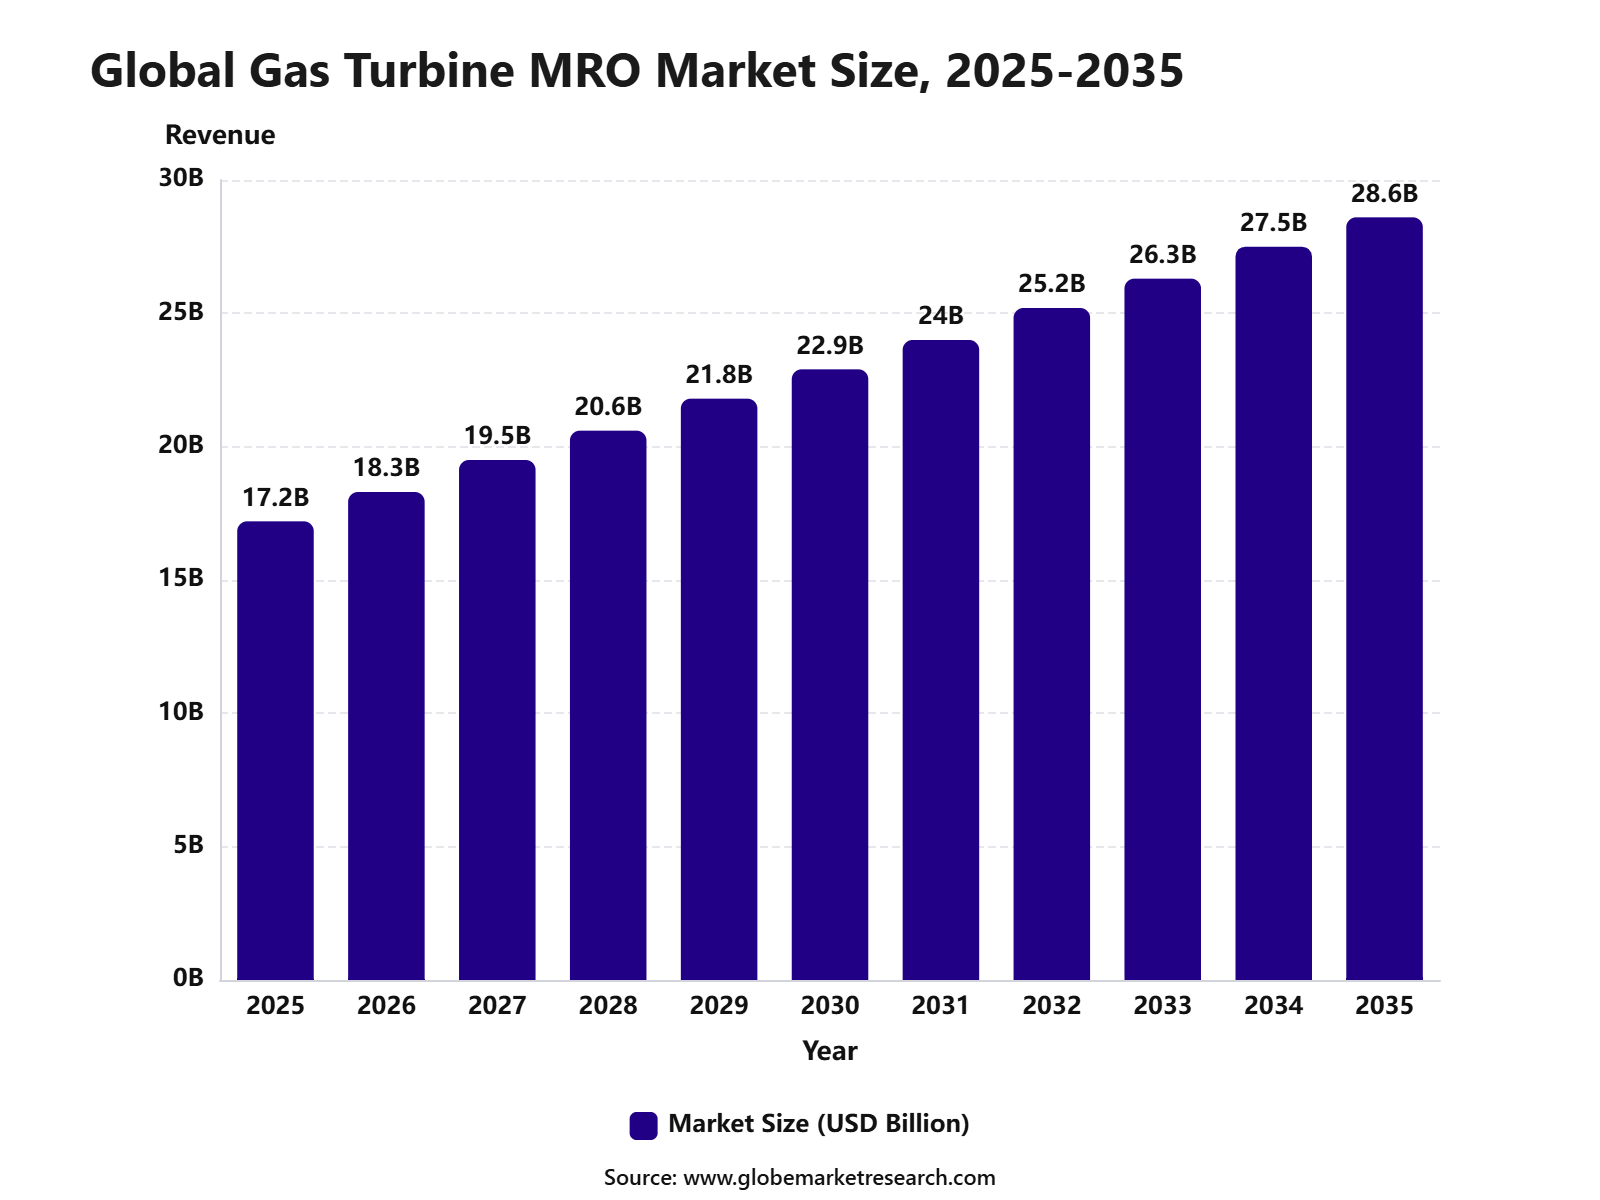 iThe graph shows projected market growth until 2035 based on CAGR analysis. Actual outcomes may vary depending on changing demand, competition, and economic factors.To gain greater insights - request a sample report PDF
Key Market Insights
Gas turbines above 120 MW led the capacity segment with 58.2% share, supported by their strong use in large power plants, industrial energy systems, and high-output electricity generation.
Combined cycle turbines accounted for 86.2% share, driven by higher fuel efficiency, lower emissions, and strong adoption in modern gas-based power generation facilities.
Maintenance services held 55.1% share by service type, supported by the need to reduce downtime, improve turbine reliability, extend asset life, and ensure stable plant operations.
Power generation captured 70.2% share by end-user industry, driven by rising demand for reliable electricity supply, grid stability, and efficient gas-fired power capacity.
Asia Pacific led the gas turbine MRO market with 52.5% share, supported by expanding power demand, rising gas-fired generation capacity, and growing maintenance needs across China, India, Japan, and Southeast Asia.
By Capacity
Above 120 MW gas turbines accounted for 58.2% share of the Gas Turbine MRO Market. This dominance can be attributed to their wide use in large power plants, industrial utilities, and grid-scale energy generation where high output and continuous operation are required.
Large-capacity turbines require regular maintenance, inspection, parts replacement, and performance optimization to avoid downtime. Since these turbines operate under high temperature, pressure, and load conditions, MRO services are essential for extending equipment life and maintaining efficiency.
The segment is expected to remain strong as utilities focus on reliable power supply, plant availability, and lower operating costs. Demand will be supported by aging turbine fleets, rising electricity consumption, and continued use of gas-based power generation.
By Turbine Cycle
Combined cycle turbines held 86.2% share of the Gas Turbine MRO Market. Their leadership is supported by high fuel efficiency, lower emissions compared with simple cycle systems, and strong adoption in large-scale power generation facilities.
Combined cycle plants use both gas and steam turbines to generate more electricity from the same fuel input. This creates higher operational complexity, making scheduled maintenance, component monitoring, heat recovery system servicing, and turbine overhauls highly important.
The segment is expected to maintain its dominant position as power producers seek efficient and flexible generation assets. MRO demand will remain high because combined cycle plants are often used for baseload, peak support, and grid balancing operations.
By Service Type
Maintenance accounted for 55.1% share of the Gas Turbine MRO Market. This leading share is driven by the need for routine inspections, cleaning, lubrication, parts replacement, performance checks, and preventive servicing across operating turbine fleets.
Regular maintenance helps reduce unplanned outages, improve fuel efficiency, and extend the operating life of turbines. It also supports compliance with safety standards and helps operators detect early signs of wear in blades, rotors, combustors, bearings, and control systems.
The segment is expected to remain the largest service type as plant owners prioritize reliability and cost control. Predictive maintenance, digital monitoring, and condition-based servicing are further improving maintenance planning and reducing downtime risk.
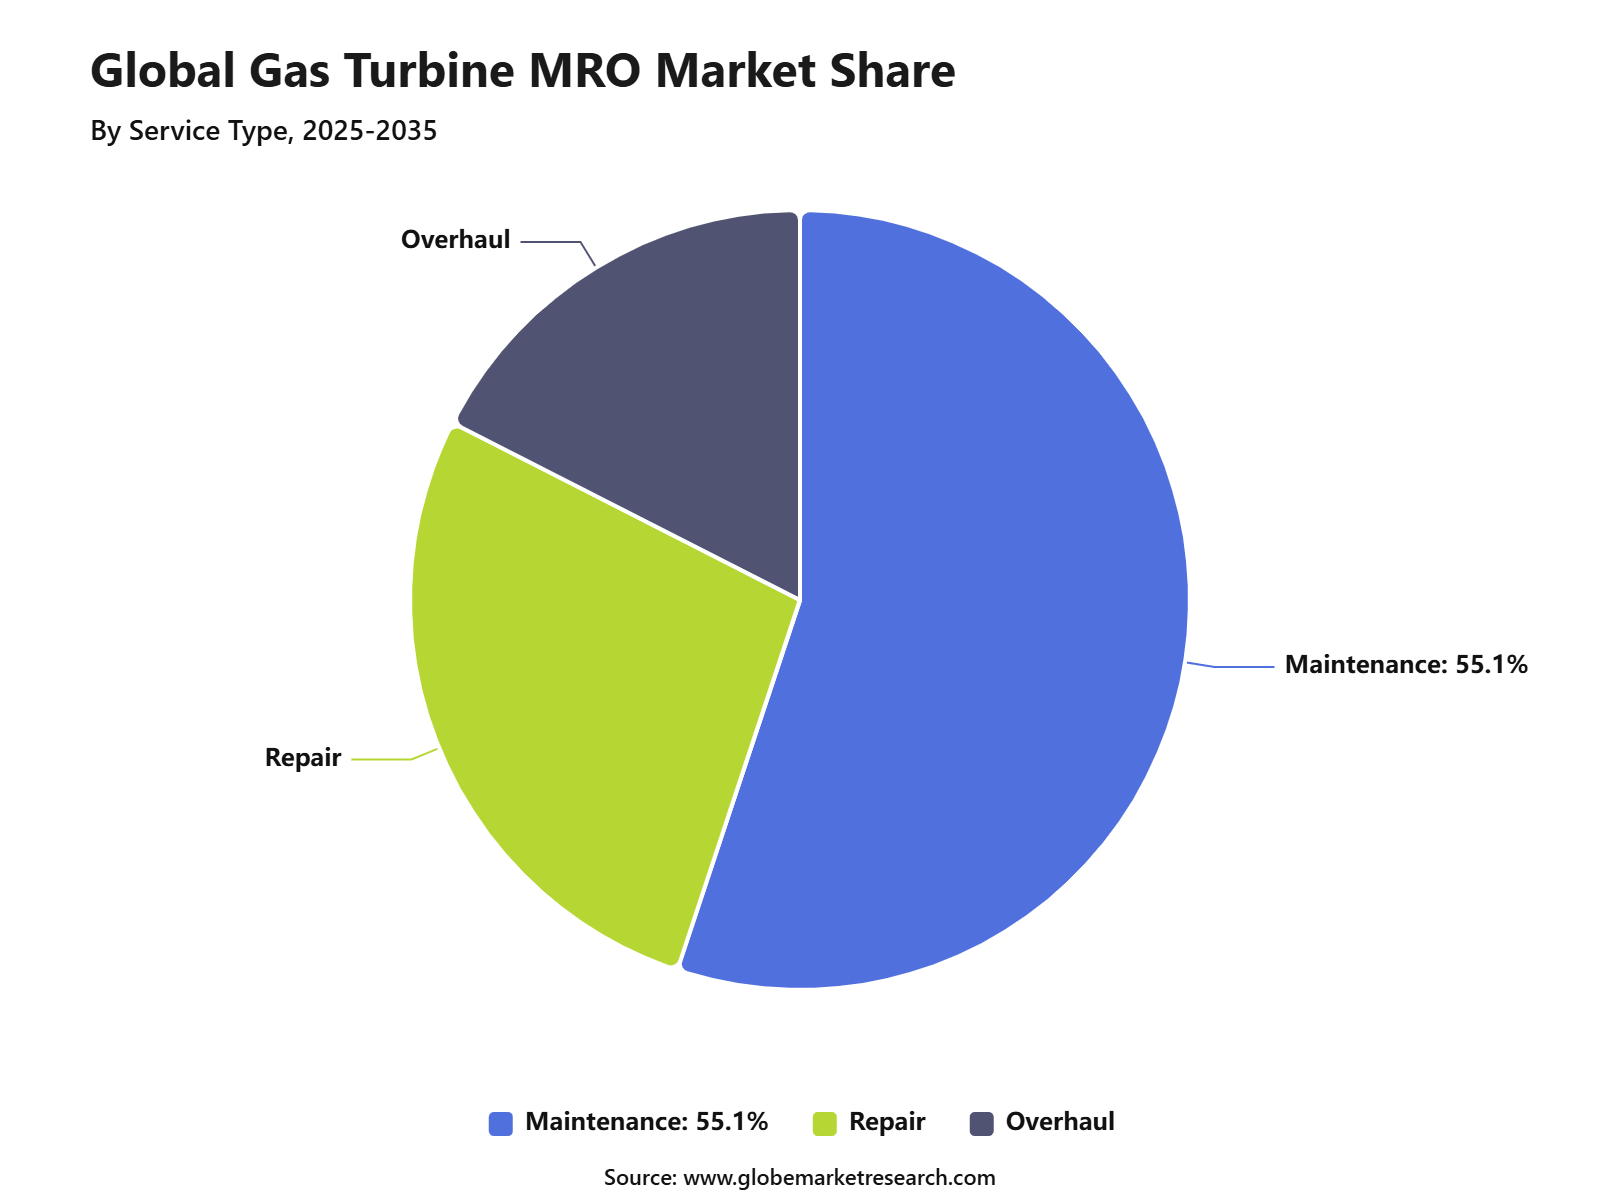 iThe graph shows projected market growth until 2035 based on CAGR analysis. Actual outcomes may vary depending on changing demand, competition, and economic factors.To gain greater insights - request a sample report PDF
By End-user Industry
Power generation accounted for 70.2% share of the Gas Turbine MRO Market. This dominance is supported by the heavy use of gas turbines in electricity production, especially in combined cycle power plants and flexible grid-support facilities.
Gas turbines are used by utilities and independent power producers to provide reliable electricity, peak-load support, and backup generation. Continuous operation creates high demand for inspections, component repairs, hot gas path servicing, and major overhauls.
The segment is expected to maintain strong demand as electricity consumption rises and grid systems require flexible generation. Gas turbine MRO will remain critical for improving plant availability, reducing forced outages, and supporting stable power supply.
By Region
Asia Pacific accounted for 52.5% share of the Gas Turbine MRO Market, making it the leading regional market. Growth is supported by rising electricity demand, expanding industrial activity, and strong investment in power generation capacity across major economies.
China, India, Japan, South Korea, Australia, and Southeast Asian countries are key demand centers. The region has a large installed base of gas turbines used in utilities, industrial plants, LNG facilities, and distributed power systems.
Asia Pacific is expected to maintain its leading position as power producers focus on reliability, efficiency, and lower emissions. Growing energy demand, aging turbine fleets, and the need for stable grid support will continue to drive MRO service demand across the region.
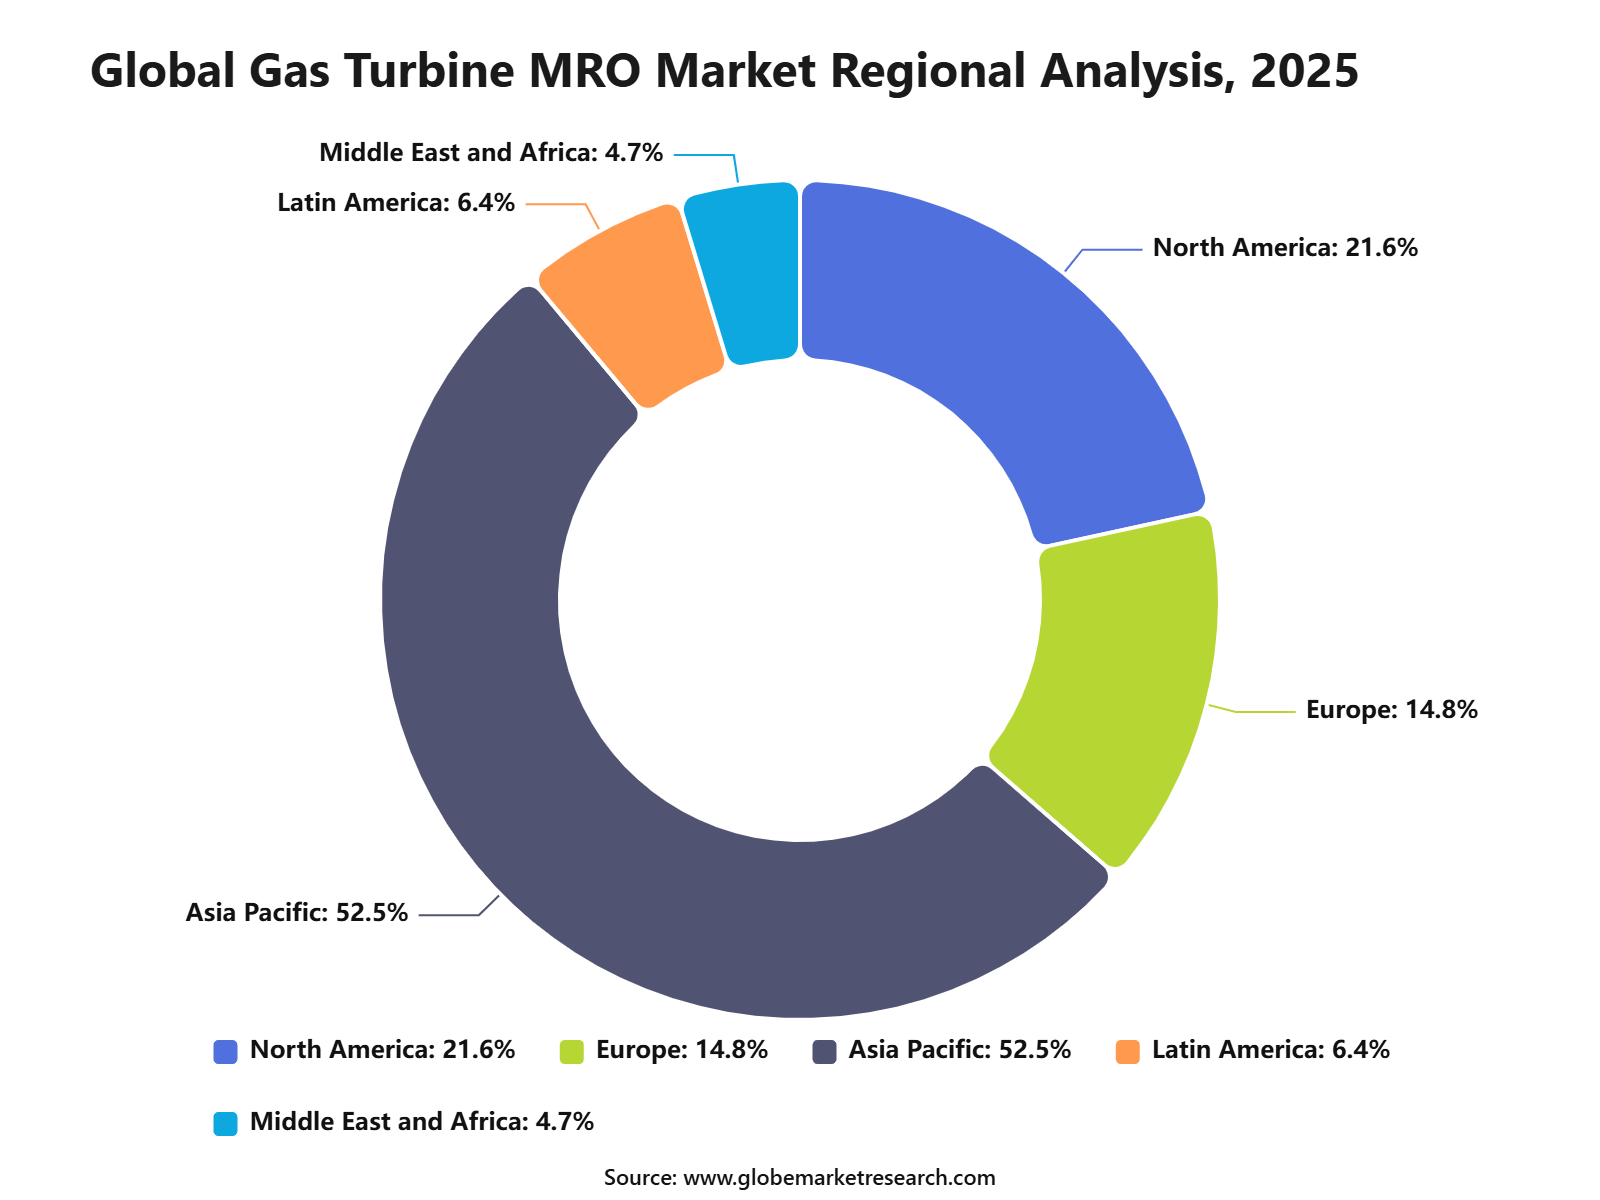 iThe graph shows projected market growth until 2035 based on CAGR analysis. Actual outcomes may vary depending on changing demand, competition, and economic factors.To gain greater insights - request a sample report PDF
Go-To-Market and Sales Economics
Gas turbine MRO is mainly sold through OEM-led long-term service agreements, outage contracts, parts supply, field service, and performance upgrade packages. Demand is tied to operational availability because gas-fired generation is expected to grow by an average of 2.6% per year during 2026 to 2030, supporting recurring inspection and overhaul needs.
Sales economics are supported by large installed fleets and service visibility. GE Vernova states that its customers generate around 25% of the world’s electricity using its technologies, with about 7,000 installed gas turbines. The company also reports that services account for more than 55% of backlog, showing strong repeat revenue from maintenance activity.
New turbine orders also create future MRO opportunities. Siemens Energy’s Gas Services business booked 102 gas turbines in Q1 FY2026, converted 12 GW from reservations, and added another 12 GW of new reservations. This expands the future service base for inspections, hot-section repairs, controls upgrades, and lifecycle maintenance.
Risk Factors & Market Barriers
The main barrier is outage complexity, as turbine maintenance must be completed within tight power-plant shutdown windows. Hot-gas-path parts, blades, rotors, controls, and skilled technicians must be available on time. Any delay can affect power supply, especially during peak demand periods when gas-fired plants are needed for grid reliability.
Fuel supply risk can also affect service planning and plant utilization. FERC reported that U.S. natural gas power burn is expected to average 44 Bcfd in summer 2026, with July and August averaging 47.9 Bcfd. High seasonal use can reduce flexibility for planned outages and increase stress on operating turbines.
Cost inflation and supply-chain constraints remain important barriers. Baker Hughes reported that its Industrial & Energy Technology revenue grew 14% year over year in Q1 2026, while Gas Technology Services grew 34%. Strong demand supports revenue, but it can also tighten availability of parts, repair slots, and specialized service teams.
Revenue Landscape Across
Revenue is spread across utilities, independent power producers, LNG-linked facilities, refineries, petrochemical plants, industrial cogeneration sites, and data-center power projects. Demand is strongest where uptime has direct financial value. IEA projects global electricity generation for data centers to rise from 460 TWh in 2024 to more than 1,000 TWh by 2030.
The U.S. remains a key revenue landscape because gas plants hold a large role in power generation. EIA projects natural gas to keep a 40% share of U.S. electricity generation in 2026 and 2027. This supports recurring work for compressors, combustors, turbine blades, heat recovery systems, control systems, and emissions-compliance upgrades.
OEMs are benefiting from rising service demand across gas and power infrastructure. Siemens Energy reported Q2 FY2026 orders of EUR 17.7 billion, supported by another record order level at Gas Services, while total backlog reached EUR 154.0 billion. This indicates strong forward visibility for turbine equipment, service, repair, and modernization work.
Revenue Potential Analysis
Financial Impact
Gas turbine MRO has a direct financial impact because every forced outage can reduce power sales and increase replacement power costs. Preventive maintenance, condition monitoring, and planned overhauls help operators protect availability. As electricity demand rises, turbine reliability becomes more valuable, especially for plants serving peak loads, industrial sites, and data-center customers.
Service revenue can improve margins because MRO is recurring and less one-time than equipment sales. GE Vernova reported Q1 2026 orders of USD 18.3 billion, up 71% organically, with backlog growth of USD 13.0 billion from equipment and services. This reflects stronger lifecycle revenue visibility for power assets.
Financial returns are expected to be strongest where operators combine MRO with efficiency upgrades, digital diagnostics, emissions control, and fuel-flexibility retrofits. EIA projects U.S. dry natural gas production at 111.00 Bcfd in 2026, supporting fuel availability for gas-fired assets. Stable fuel supply strengthens operating hours and increases the value of maintenance programs.
Drivers Impact Analysis
The Gas Turbine MRO Market is driven by rising demand for reliable power generation, aviation engine servicing, industrial gas turbine maintenance, and lifecycle extension of installed turbine fleets. MRO services help improve uptime, fuel efficiency, safety, emissions performance, and asset reliability.
Asia Pacific leads the market due to strong power demand, growing aviation activity, industrial expansion, and rising gas-based power capacity. China, India, Japan, South Korea, and Southeast Asia remain key contributors because of large turbine installations and increasing maintenance requirements.
Impact Factor | Estimated CAGR Impact | Regional Relevance | Market Impact |
|---|---|---|---|
Rising installed gas turbine base | +1.4% | Asia Pacific, North America, Europe | Drives recurring maintenance. |
Growth in power generation demand | +1.2% | China, India, Southeast Asia | Supports service volume. |
Increasing aviation engine maintenance | +1.0% | Asia Pacific, Middle East, North America | Adds high-value demand. |
Lifecycle extension of aging turbines | +0.8% | Mature power and industrial markets | Improves asset utilization. |
Need for higher efficiency and uptime | +0.7% | Utilities and industrial operators | Supports planned servicing. |
Restraints Impact Analysis
The market faces restraints from high overhaul costs, long service downtime, and dependence on skilled technicians. Major inspections, hot-section repairs, component replacement, and engine overhaul can create heavy cost pressure for operators.
Another restraint is supply chain delay for turbine components. Blades, vanes, combustors, bearings, seals, and control systems require specialized manufacturing and certification, so part shortages can extend turnaround time.
Impact Factor | Estimated CAGR Impact | Regional Relevance | Market Impact |
|---|---|---|---|
High overhaul and repair cost | -0.8% | Global turbine operators | Pressures service budgets. |
Long turbine downtime during MRO | -0.7% | Power and aviation users | Affects asset availability. |
Shortage of skilled technicians | -0.6% | Asia Pacific, Middle East, Europe | Slows service execution. |
Component supply chain delays | -0.5% | Global MRO networks | Extends turnaround time. |
Competition from renewable energy systems | -0.4% | Europe, North America, developed Asia | Limits some power demand. |
Opportunities Impact Analysis
Opportunities are strong in predictive maintenance, digital turbine monitoring, hot-section repair, component refurbishment, field service contracts, and long-term service agreements. These areas help operators reduce unplanned outages and control lifecycle cost.
Higher-value opportunities are also emerging in hydrogen-ready turbines, low-emission upgrades, and efficiency retrofits. MRO providers that offer advanced diagnostics, faster turnaround, and OEM-certified repair capabilities can capture stronger long-term demand.
Impact Factor | Estimated CAGR Impact | Regional Relevance | Market Impact |
|---|---|---|---|
Predictive maintenance adoption | +1.3% | Asia Pacific, North America, Europe | Reduces unplanned downtime. |
Long-term service agreements | +1.1% | Utilities, airlines, industrial users | Builds recurring revenue. |
Hot-section repair and refurbishment | +0.9% | Power and aviation turbine fleets | Adds high-value service. |
Low-emission turbine upgrades | +0.8% | Europe, North America, Japan | Supports compliance needs. |
Hydrogen-ready turbine servicing | +0.6% | Europe, Japan, South Korea, U.S. | Creates future opportunity. |
Challenges Impact Analysis
The main challenge is maintaining turbine reliability under demanding operating conditions. Gas turbines face high temperatures, pressure cycles, fuel variation, corrosion, erosion, and thermal fatigue, which increases inspection and repair complexity.
Another challenge is balancing maintenance cost with operational availability. Operators want fewer outages, shorter repair windows, and predictable service schedules, while MRO providers must maintain safety and quality standards.
Impact Factor | Estimated CAGR Impact | Regional Relevance | Market Impact |
|---|---|---|---|
Managing thermal fatigue and wear | -0.7% | Power and aviation turbines | Raises repair complexity. |
Reducing turnaround time | -0.6% | Airlines and utilities | Affects service competitiveness. |
Maintaining certified repair quality | -0.6% | Regulated aviation and power sectors | Protects safety standards. |
Handling fuel flexibility requirements | -0.5% | Industrial and power turbines | Adds technical needs. |
Controlling lifecycle service cost | -0.4% | Global operators | Influences contract decisions. |
Segment Covered in the Report
By Capacity
Below 30 MW
31 to 120 MW
Above 120 MW
By Turbine Cycle
Combined Cycle
Open/Simple Cycle
By Service Type
Maintenance
Repair
Overhaul
By End-user Industry
Power Generation
Industrial
Other
By Region
North America
Europe
Asia Pacific
Latin America
Middle East and Africa
Market Trend Analysis
The market trend is moving toward digital MRO, condition-based maintenance, remote monitoring, component life extension, and performance-based service contracts. Operators are shifting from reactive maintenance to planned and predictive service models.
Power generation remains a major demand area, while aviation and industrial applications provide steady service opportunities. Asia Pacific continues to lead volume demand, supported by energy infrastructure growth and expanding aircraft fleets.
Impact Factor | Estimated CAGR Impact | Regional Relevance | Market Impact |
|---|---|---|---|
Condition-based maintenance grows | +1.2% | Asia Pacific, North America, Europe | Improves service planning. |
Remote turbine monitoring expands | +1.0% | Large utility and aviation fleets | Enhances uptime. |
Performance-based contracts rise | +0.9% | OEM and operator partnerships | Builds recurring value. |
Component refurbishment gains traction | +0.8% | Power, aviation, industrial users | Reduces replacement cost. |
Efficiency upgrade trend increases | +0.6% | Mature gas turbine fleets | Supports fuel savings. |
Investor Type Impact Matrix
Investors should focus on MRO providers with strong technical capability, certified repair processes, regional service networks, and long-term contracts with power, aviation, and industrial customers. Turnaround speed and service quality are key competitive factors.
Strategic investors can also target digital monitoring platforms, component repair specialists, field service companies, coating technology providers, and turbine diagnostics firms. Companies that improve uptime while lowering lifecycle cost are better positioned for long-term growth.
Investor Type | Estimated CAGR Impact | Regional Relevance | Market Impact |
|---|---|---|---|
Gas Turbine MRO Providers | +1.2% | Global | Expands service capacity. |
OEM Service Divisions | +1.0% | Asia Pacific, North America, Europe | Drives certified repair demand. |
Power Plant Service Companies | +0.9% | Utility and industrial markets | Supports recurring maintenance. |
Aviation Engine Maintenance Firms | +0.8% | Global aviation hubs | Adds premium service value. |
Digital Maintenance and Diagnostics Firms | +0.6% | Advanced turbine fleets | Improves uptime and planning. |
Recent Developments
In March 2026, Baker Hughes signed a 60-month service agreement with Petrobras for critical turbomachinery equipment in Brazil. The agreement covers maintenance, repairs, and engineering advisory services for up to 64 aeroderivative gas turbines across offshore and refinery operations.
In June 2026, Mitsubishi Power signed a Long-Term Parts and Services Agreement with LNGPH for the 1,200 MW Ilihan Combined Cycle Power Plant in Batangas, Philippines. The agreement covers M501G gas turbine parts, inspection management, hot parts, spare parts supply, repair works, and technical advisory services.
Competitive Landscape
The market is characterized by intense competition among established players and emerging companies. Strategic partnerships, mergers and acquisitions, and product innovation are key strategies employed by market participants.
Key Market Players
GE Vernova
Siemens Energy
Mitsubishi Power
MTU Aero Engines
EthosEnergy
Ansaldo Energia
Sulzer
Kawasaki Heavy Industries
Rolls-Royce
MAN Energy Solutions
Solar Turbines
Doosan Enerbility
Other Key Players
Research Methodology
This market study is prepared using a combination of primary and secondary research. Primary research includes discussions with manufacturers, suppliers, distributors, consultants, industry experts, and end users. Secondary research covers company reports, government databases, trade associations, technical publications, regulatory sources, and trusted industry documents. The collected information is used to assess market demand, pricing trends, technology adoption, competitive activity, and regional performance.
AI language models are not used as primary data sources, and publicly available AI-generated content is not treated as market evidence. Computational tools may be used to support data processing, translation, data classification, and pattern identification. However, every published assessment is supported by verified sources, human review, and primary market discussions.
Market estimates are developed through top-down and bottom-up approaches and validated using data triangulation. Revenue, production, shipment, pricing, and application-level data are compared across multiple sources. Forecasts consider economic conditions, regulatory changes, investment activity, innovation, supply chain developments, and industry risks. All findings are reviewed through source verification and internal quality checks before publication.
Part I
Source Management & Input Data Standards
Who provides data, how sources are qualified, and what types of evidence are admissible.
Part II
Research Scope & Market Coverage
How we define the markets we assess and the parameters that govern each product.
Part III
Data Collection, Verification & Submission
The mechanics of gathering, cross-checking, and hierarchically ranking evidence.
Part IV
Assessment Determination & Quality Controls
How raw data becomes a published assessment — normalisation, expert judgement, and outlier exclusion.
Part V
Publication, Corrections & Revision
Our publication schedule, corrections policy, and methodology review cycle.
Part VI
Independence, Ethics & Complaints
Conflict-of-interest policies, editorial independence, and how clients raise concerns.
Google · Preferred Sources
Don't miss the latest market research insights and industry updates on Google.
Add Globe Market Research as a preferred source in the Google app to see our reports, analysis, and market stories in your news suggestions.
Meet the Team
This report was prepared by our expert analysts with deep industry knowledge and research experience.
Kimaya brings more than five years of experience in market research, content review, and industry analysis to Globe Market Research. She plays an important role in maintaining the accuracy, clarity, consistency, and relevance of research content across a wide range of industries. Her responsibilities include reviewing market data, segment analysis, competitive landscapes, industry trends, company developments, and strategic insights. Each report is carefully assessed to ensure that the findings are supported by reliable data, presented in a structured format, and aligned with the information needs of business decision-makers. Kimaya has research experience across healthcare, information technology, consumer goods, and several cross-industry domains.
Pratiksha K. is a Senior Research Analyst with more than five years of experience in market research, industry analysis, competitive intelligence, and business strategy. She has contributed to detailed market reports, customized research studies, company profiling, market sizing, trend analysis, and strategic consulting projects for clients across different regions. Her industry expertise covers Chemical and Material, Consumer Goods, Food & Beverages and Energy & Power. She closely evaluates changing customer requirements, technology developments, regulatory conditions, supply chain structures, investment activity, and competitive strategies to provide clear and practical market insights.
Frequently Asked Questions
Related Reports
More in Energy and Power
Oil and Gas Turbomachinery Market to Hit USD 26.9 Billion by 2035
Oil and Gas Turbomachinery Market Size, Share, Analysis By Type (Gas Compressors, Gas and Steam Turbines, Pumps, Other Types), By Deployment (Onshore, Offshore), By Industry (Upstream, Midstream, Downstream), By Regional Insights, Business plan and Project Report, Investment Opportunities, Profitability, Industry Trends, Leading Companies and Growth Forecasts by 2025-2035
Liquefied Natural Gas (LNG) Bunkering Market to Hit USD 51.7 Billion by 2035
Liquefied Natural Gas (LNG) Bunkering Market Size, Share, Analysis By Product Type (Ship-to-Ship, Truck-to-Ship, Port-to-Ship, Portable Tanks), By Application (Cargo Fleet, Tanker Fleet, Container Fleet, Ferries, Inland Vessels, Others), By Regional Insights, Business plan and Project Report, Investment Opportunities, Profitability, Industry Trends, Leading Companies and Growth Forecasts by 2025-2035
Wind Energy Market to Hit USD 348.1 Billion by 2035
Wind Energy Market Size, Share, Analysis By Location (Onshore, Offshore), By Application (Utility, Non-Utility), By Component(Turbine, Support Structure, Electrical Infrastructure, Others), By Regional Insights, Business plan and Project Report, Investment Opportunities, Profitability, Industry Trends, Leading Companies and Growth Forecasts by 2025-2035
Power EPC Market to Hit USD 1,516.1 Billion by 2035
Power EPC Market Size, Share, Analysis By Type of Power Generation (Thermal Power, Renewable Energy, Nuclear Power, Hydropower, Others), By Service Type (Engineering, Procurement, Construction), By Equipment Type (Steam Turbines, Gas Turbines, Solar PV Systems, Wind Turbines, Boilers, Generators, Others), By Regional Insights, Business plan and Project Report, Investment Opportunities, Profitability, Industry Trends, Leading Companies and Growth Forecasts by 2025-2035