

Revenue, 2025
USD 28.2 Bn
Forecast, 2035
USD 55.0 Bn
CAGR, 2025-2035
6.9%
Report Coverage
Global
Market Size and Forecast
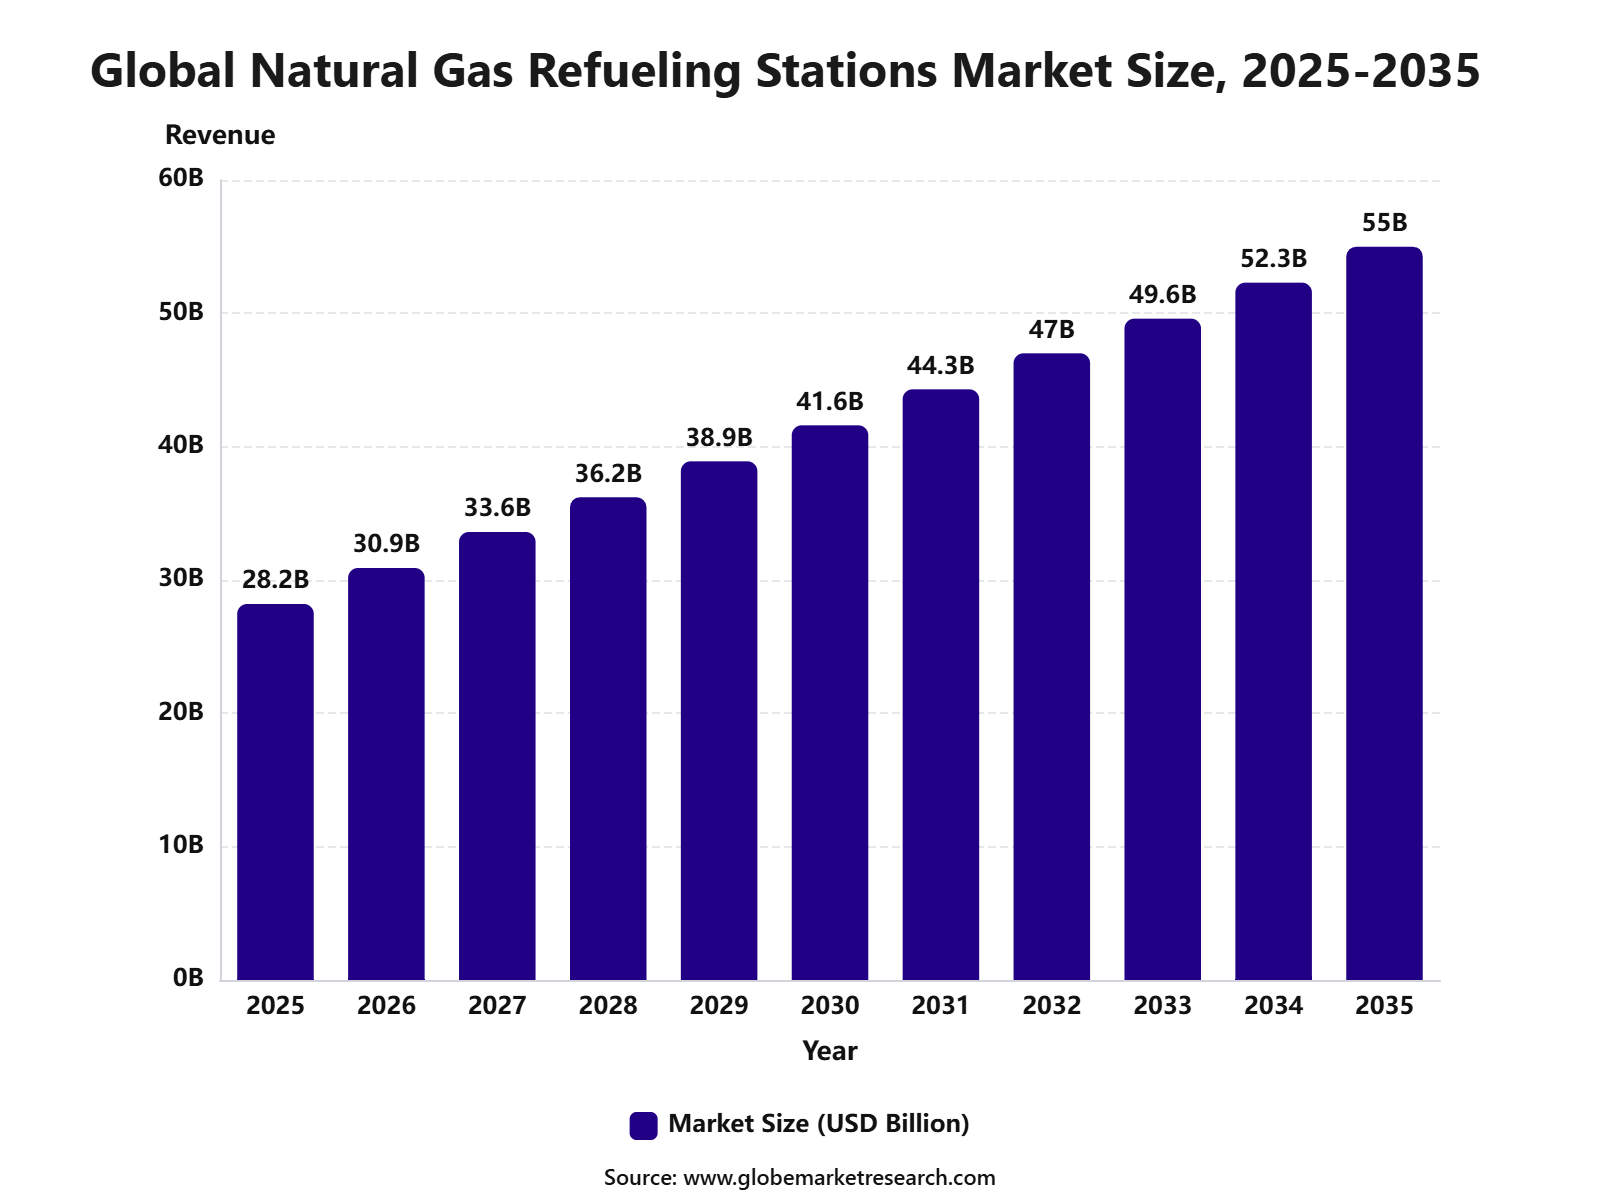
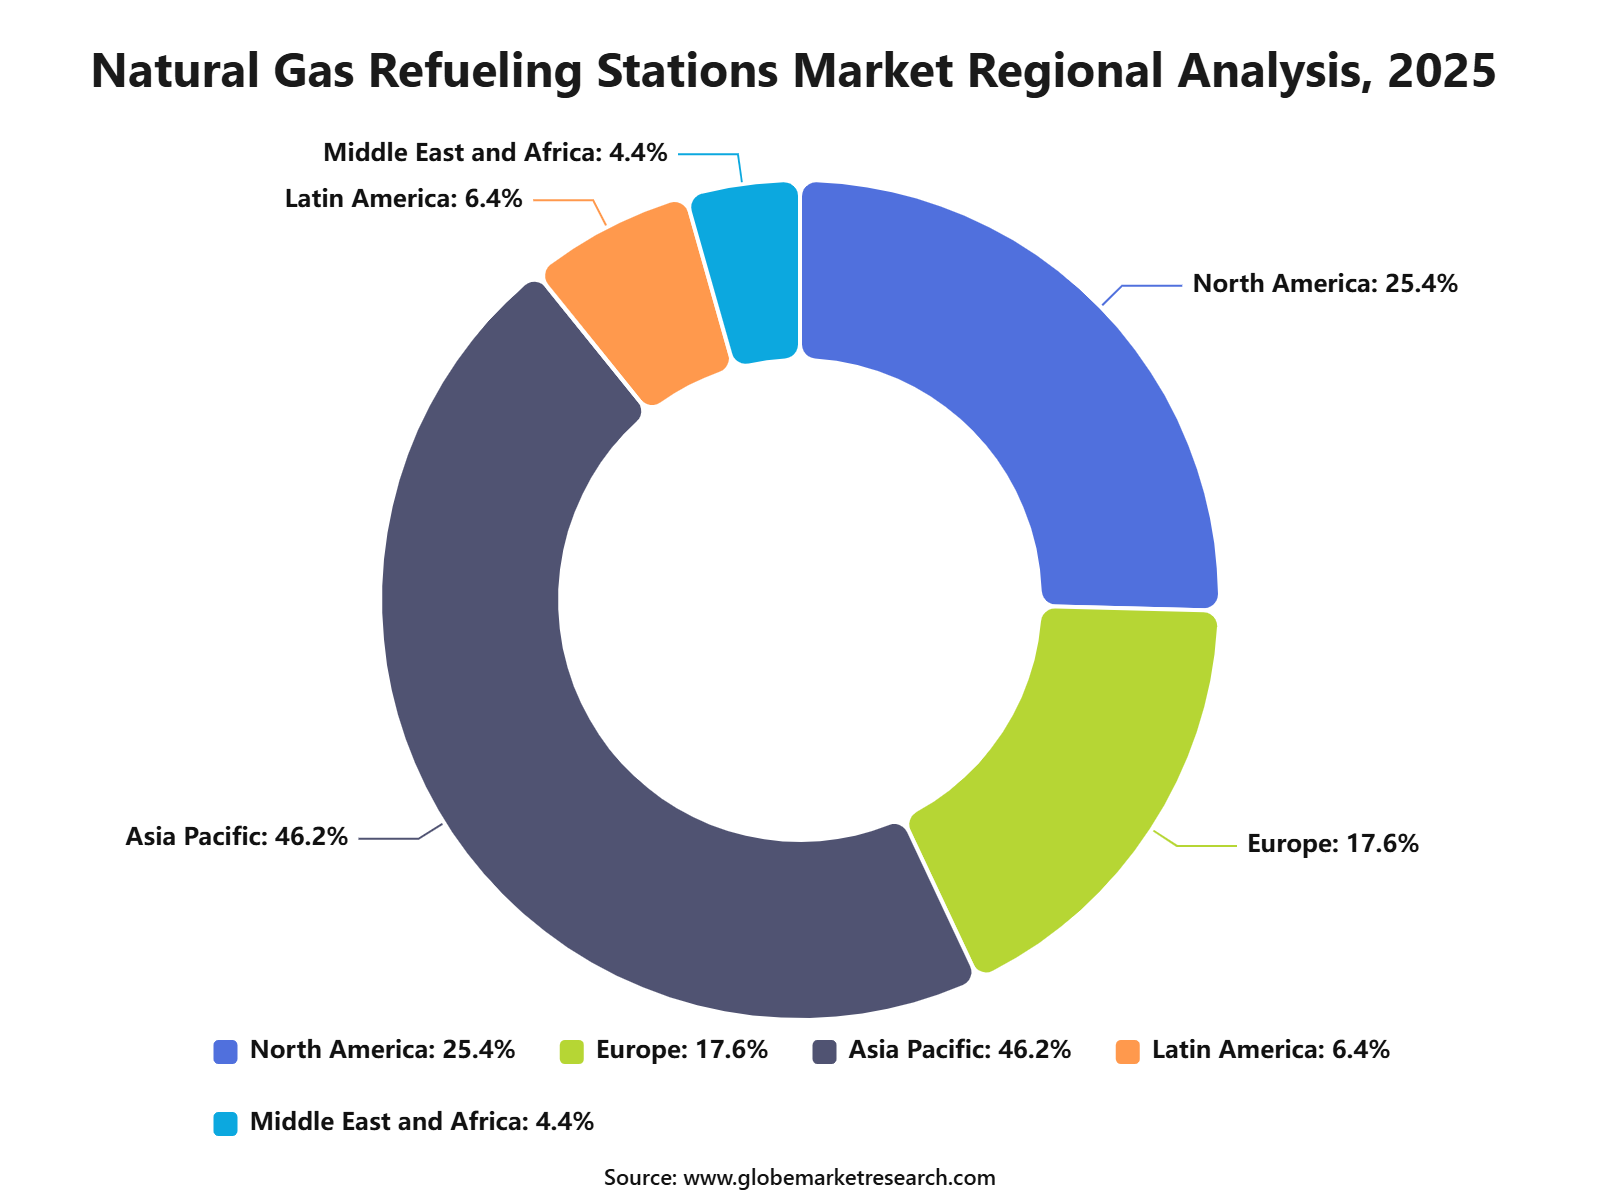
The Global Natural Gas Refueling Stations Market was worth USD 28.2 billion in 2025 and is expected to reach USD 55.0 billion by 2035, growing at a CAGR of 6.9% from 2025 to 2035. Based on this growth rate, the market is estimated to reach around USD 30.9 billion in 2026. Asia Pacific held the largest regional share of 46.2% in 2025, valued at around USD 13.0 billion, supported by expanding CNG and LNG vehicle fleets, public transport conversion, cleaner fuel policies, and rising demand for low-emission mobility infrastructure.
The Natural Gas Refueling Stations Market includes fueling infrastructure used to supply compressed natural gas and liquefied natural gas to passenger vehicles, buses, trucks, commercial fleets, and industrial mobility applications. These stations include fast-fill stations, time-fill stations, mobile refueling units, depot-based systems, and combined fuel stations. The market is closely linked with natural gas vehicles, fleet operations, urban transportation, logistics, and clean fuel distribution networks.
Key Parameter | Report Details |
|---|---|
Market Revenue, 2025 | USD 28.2 Billion |
Projected Revenue, 2035 | USD 55.0 Billion |
CAGR (2025-2035) | 6.9% |
Largest Region | Asia Pacific (46.2%, USD 13.0 Bn) |
Market Concentration | Medium |
Base Year | 2025 |
Forecast Period | 2025-2035 |
The market outlook remains positive as governments and fleet operators look for practical alternatives to diesel and gasoline. Growth can be attributed to rising demand for lower-emission transport, expanding CNG bus fleets, LNG use in long-haul trucking, and investment in public and private refueling networks. The expansion of Asia Pacific transport infrastructure, city-level clean fuel programs, and commercial fleet modernization is expected to support long-term market demand.
 iThe graph shows projected market growth until 2035 based on CAGR analysis. Actual outcomes may vary depending on changing demand, competition, and economic factors.To gain greater insights - request a sample report PDF
Key Market Insights
Compressed natural gas led the natural gas type segment with 63.5% share, supported by its lower fuel cost, cleaner combustion profile, and strong use across buses, trucks, taxis, and commercial fleets.
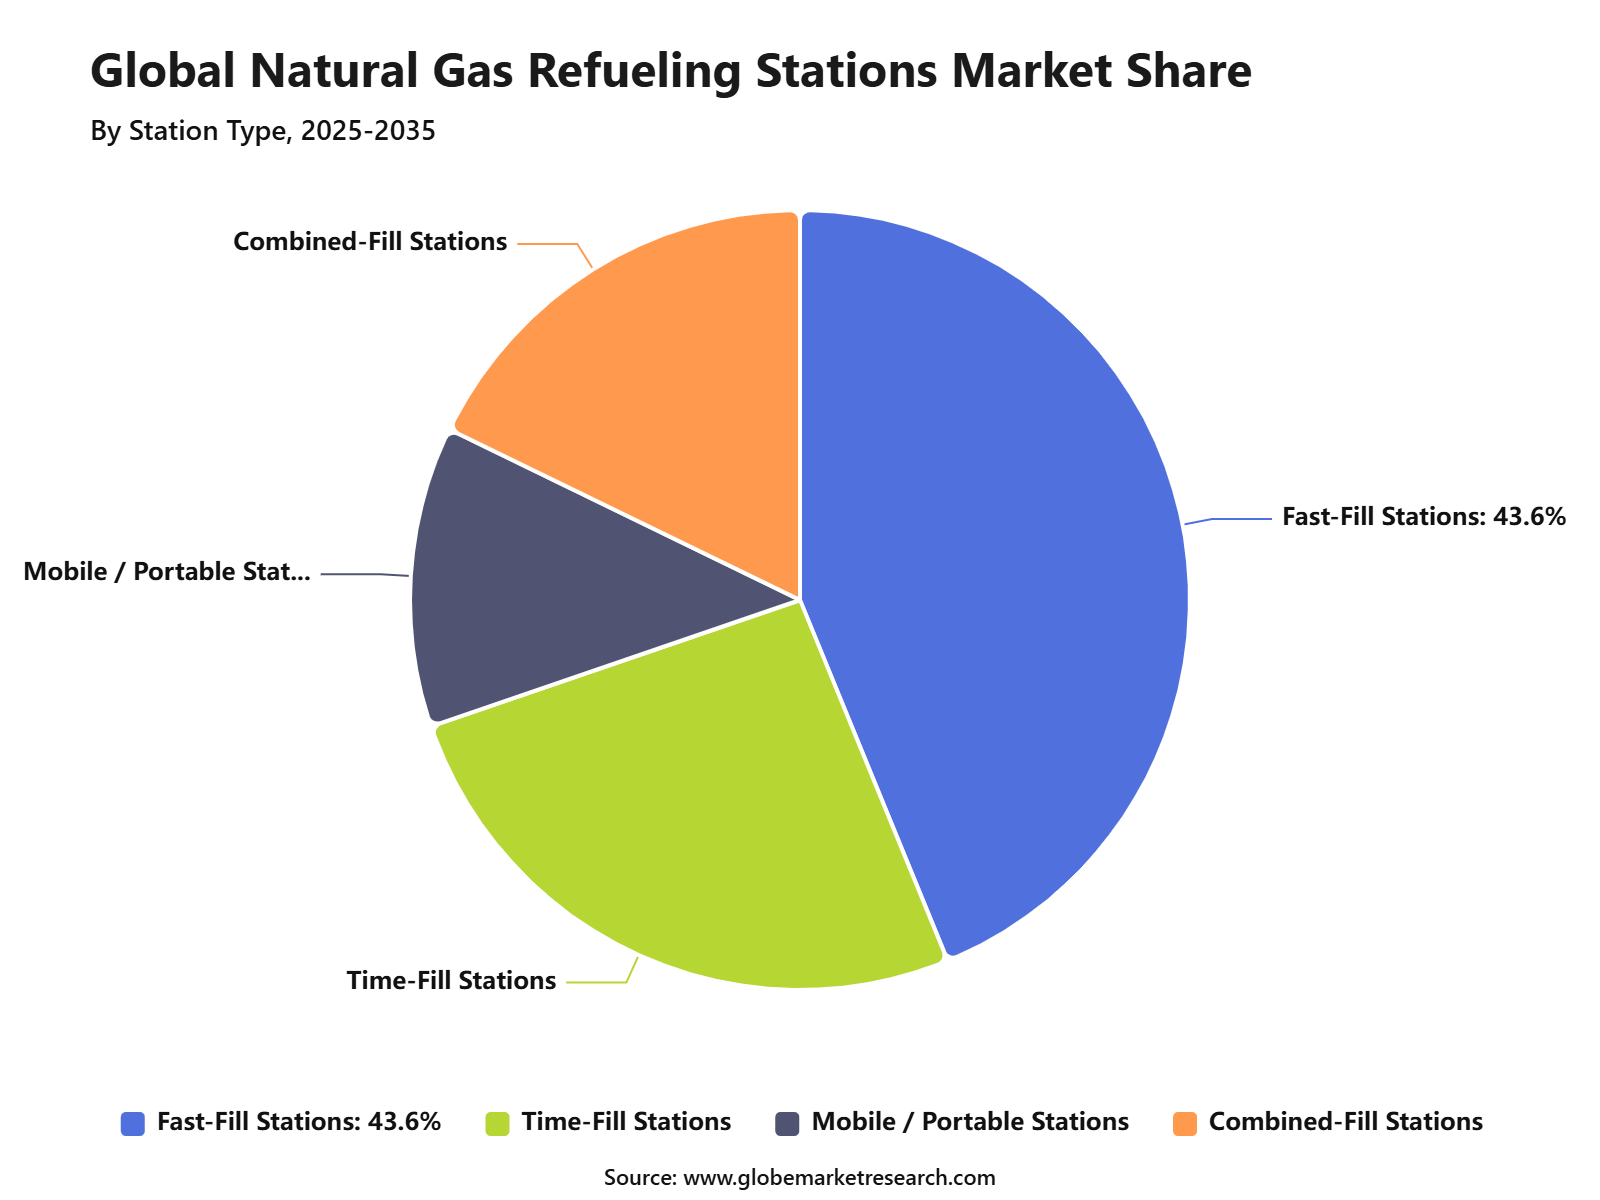
Fast-fill stations accounted for 43.6% share, driven by their ability to refuel vehicles quickly, making them suitable for public transport fleets, logistics operators, and high-traffic urban refueling points.
Public transportation and fleet applications held 55.9% share, supported by growing adoption of CNG buses, municipal vehicles, delivery fleets, and commercial transport systems.
Asia Pacific led the natural gas refueling stations market with 46.2% share, valued at USD 13.0 billion, supported by expanding public transport networks, rising clean fuel adoption, and strong CNG infrastructure development across China, India, and Southeast Asia.
Top Funding and Investment
Top Investments
Purba Bharati Gas advanced a broader city gas distribution investment of Rs 2,616.95 crore across Assam, covering pipeline buildout, household gas access, and CNG station expansion. The project includes 765 km of MDPE pipeline, 43 km of steel pipeline, more than 30,000 registered households, and new CNG station development in additional districts.
India launched a city gas distribution project worth over Rs 1,010 crore for Alipurduar and Cooch Behar in West Bengal. The project is expected to establish around 19 CNG stations, while also providing PNG access to more than 2.5 lakh households and over 100 commercial and industrial users.
Ultra Gas & Energy planned a Rs 900 crore investment to scale its LNG retail outlet network to 100 stations across India. The company already operated six LNG refueling outlets, and each outlet was described with scalable 50-tonne capacity, supporting LNG truck refueling along major freight corridors.
Roadgas announced the rollout of 12 new Bio-LNG refueling stations across key U.K. freight routes on behalf of Pretoria Energy. The investment value was not publicly disclosed, but the rollout is expected to roughly double heavy-fuel gas access in the U.K. and support Bio-LNG use in long-haul logistics.
Metropolitan Transport Corporation Chennai partnered with Torrent Gas Chennai and THINK Gas to set up CNG filling stations at Ambattur and Varadharajapuram depots. The plan supports the conversion of 240 buses initially, with another 1,000 buses planned later, while THINK Gas’ Varadharajapuram station is designed to serve up to 125 buses per day with 7,000 kg per day CNG supply capacity.
Top Funding
GreenLine Mobility announced a USD 275 million equity investment to expand its green logistics network. The funding supports deployment of more than 10,000 LNG and electric trucks, along with a nationwide network of 100 LNG refueling stations, EV charging stations, and battery swapping facilities.
Nigeria’s CNG transition attracted about USD 500 million in investment within one year, linked with CNG vehicle conversion, refueling infrastructure, and clean transport adoption. The programme reported around 50,000 vehicle conversions, showing rising funding support for CNG mobility infrastructure and gas-based refueling capacity.
Nigeria’s Midstream and Downstream Gas Infrastructure Fund backed a government-supported SPV, CAM InfraCo, with BOI, Endurance Group, and Séquor Investment Partners. The funding value was not publicly disclosed, but the platform is planned to deploy 500 integrated CNG refueling stations, LCNG supply infrastructure, CNG and LNG transport trucks, and truck-mounted cascades across Nigeria.
Top Acquisitions
Trillium completed the acquisition of U.S. Energy’s CNG dispensing network. What it acquired includes 41 CNG stations across 15 U.S. states and 3 stations in Canada, expanding Trillium’s North American network to 107 locations. Trillium also took over operation, monitoring, and maintenance of the acquired CNG assets.
innogy, a Czech subsidiary owned by MVM, acquired 32 CNG filling stations from E.ON. What it acquired was a CNG refueling station portfolio that expanded innogy’s network from 75 to 107 stations. The acquired stations had sold around 2 million kg of CNG in the previous year, while innogy’s existing network sales exceeded 19 million kg.
By Natural Gas Type
Compressed natural gas accounted for 63.5% share of the Natural Gas Refueling Stations Market. This leading position is supported by its wider use in buses, taxis, municipal fleets, delivery vehicles, light commercial vehicles, and short-haul transport applications.
CNG is preferred because it is easier to store and dispense compared with liquefied natural gas for many urban and fleet-based operations. It also offers lower fuel cost, reduced tailpipe emissions, and strong suitability for vehicles that return to a fixed base for refueling.
Demand for CNG refueling stations is expected to remain strong as cities and fleet operators focus on cleaner fuel alternatives. Its established vehicle base, practical infrastructure needs, and suitability for public transport continue to support segment leadership.
By Station Type
Fast-fill stations held 43.6% share of the Natural Gas Refueling Stations Market. This dominance is driven by their ability to refuel vehicles quickly, making them suitable for public stations, bus depots, taxi fleets, delivery fleets, and commercial transport hubs.
These stations are preferred where vehicle turnaround time is important. Fast-fill systems store compressed gas at high pressure and deliver fuel in a shorter time compared with time-fill systems, which improves fleet productivity and station throughput.
Demand for fast-fill stations is expected to remain strong as commercial fleets and public transport agencies expand natural gas vehicle operations. Their role in supporting high-volume refueling makes them an important station type in urban and fleet-focused markets.
 iThe graph shows projected market growth until 2035 based on CAGR analysis. Actual outcomes may vary depending on changing demand, competition, and economic factors.To gain greater insights - request a sample report PDF
By Application
Public transportation and fleet applications accounted for 55.9% share of the Natural Gas Refueling Stations Market. This leading share is supported by high fuel consumption across buses, taxis, municipal vehicles, delivery vans, refuse trucks, and commercial fleets.
Fleet operators prefer natural gas refueling infrastructure because vehicles operate on fixed routes and can refuel at centralized depots. This makes station planning easier and improves fuel cost control, especially for large fleets with predictable daily usage.
The segment is expected to remain the largest application area as cities focus on cleaner public transport and lower operating emissions. Demand will remain supported by bus fleet conversion, urban logistics growth, and municipal efforts to reduce diesel dependence.
By Region
Asia Pacific accounted for 46.2% share of the Natural Gas Refueling Stations Market, reaching USD 13.0 billion. The region’s leadership is supported by strong public transport demand, rising urbanization, and growing use of natural gas vehicles across major economies.
China, India, Thailand, Pakistan, Indonesia, and other regional markets are key contributors to station deployment. The region benefits from large bus and fleet operations, government support for cleaner fuels, and expanding city-level transport infrastructure.
Asia Pacific is expected to maintain its leading position as fleet operators, transport agencies, and fuel retailers invest in CNG refueling networks. Demand will remain supported by lower fuel cost, cleaner urban mobility goals, and the need for reliable refueling access across high-density transport corridors.
 iThe graph shows projected market growth until 2035 based on CAGR analysis. Actual outcomes may vary depending on changing demand, competition, and economic factors.To gain greater insights - request a sample report PDF
Regional Impact Analysis
Asia Pacific leads the Natural Gas Refueling Stations Market with 46.2% share in 2025, valued at around USD 13.0 billion, supported by large CNG vehicle fleets, growing public transport demand, urban air quality initiatives, and expanding gas-based mobility infrastructure. China and India remain major regional contributors due to large transport networks and strong policy support for cleaner fuels.
North America remains important because of commercial fleet fueling, renewable natural gas adoption, refuse trucks, transit buses, and LNG applications in heavy-duty transport. Europe supports value growth through low-emission transport policies, bio-CNG adoption, and LNG refueling corridors for freight movement.
Impact Factor | Estimated CAGR Impact | Regional Relevance | Market Impact |
|---|---|---|---|
Asia Pacific market leadership | +2.5% | Asia Pacific, 46.2% share in 2025 | Leads global value demand. |
China CNG and LNG transport demand | +1.6% | China | Drives regional scale. |
India public transport and CNG expansion | +1.3% | India | Supports future station growth. |
North America fleet and RNG fueling | +0.9% | U.S. and Canada | Adds premium station value. |
Europe LNG and bio-CNG corridors | +0.8% | Germany, Italy, France, Spain | Supports cleaner freight mobility. |
Go-To-Market and Sales Economics
Natural gas refueling stations are commercialized through city gas distributors, fuel retailers, fleet operators, transit agencies, logistics corridors, municipalities, and station equipment suppliers. The strongest route is fleet-led demand because CNG and LNG stations work best where buses, refuse trucks, taxis, delivery fleets, and long-haul trucks return regularly for refueling.
Sales economics depend on throughput, compression capacity, dispenser uptime, gas procurement cost, and fleet contracts. In the U.S., the natural gas refueling network entering 2026 included 1,385 CNG stations and 81 LNG stations, showing a mature but fleet-focused infrastructure base rather than a broad consumer retail model.
Renewable natural gas is improving station economics by supporting lower-carbon fleet fuel programs. Clean Energy Fuels reported Q1 2026 revenue of USD 117.6 million and 67.4 million RNG gallons sold, while its network included more than 600 fueling locations across North America serving heavy-duty vehicles.
Risk Factors & Market Barriers
The main barrier is station utilization because CNG and LNG sites require compressors, storage, dispensers, dryers, safety systems, grid power, and regular maintenance. AFDC notes that CNG station counts fell after 2016 due to station closures, high repair and operating costs, and some fleets moving away from CNG.
Fuel price and gas supply volatility can also affect demand. IEA’s Q2 2026 Gas Market Report stated that natural gas demand in key LNG import markets fell in March because of weather, higher prices, and demand-side policy measures. This can pressure station margins when fuel procurement costs rise faster than retail pricing.
Regulatory approvals, land access, cylinder safety, compressor permits, and pipeline connections can delay station rollout. India fast-tracked more than 467 applications for CNG and CBG dispensing stations after March 25, 2026, showing that approval speed is now central to network expansion and fuel availability.
Revenue Potential Analysis
Revenue Landscape Across
Revenue is spread across public CNG outlets, private fleet depots, LNG truck stations, bio-CNG stations, airport fleets, bus depots, refuse fleets, last-mile delivery, and highway freight corridors. Clean Energy said more than 100 of its public-access fast-fill stations are tractor-trailer friendly, supporting heavy-duty corridor demand.
India is a major revenue landscape because CNG passenger vehicles and city gas infrastructure are expanding together. FADA’s June 2026 data showed passenger vehicle alternative-fuel share crossed 40.35%, with CNG at 24.33%, hybrid at 8.27%, and EV at 7.75%, supporting station-level fuel demand.
Bio-CNG and compressed biogas are becoming additional revenue pools. India granted approvals for 41 biogas cylinder filling and storage plants in 2026, while its CNG and CBG station approvals were accelerated to stabilize cleaner fuel supply. This supports local waste-to-fuel projects and distributed refueling models.
Financial Impact
Natural gas refueling stations create financial value through fuel margin, fleet contracts, compression services, station maintenance, and renewable fuel credits where available. The strongest returns are expected where station throughput is secured by buses, refuse fleets, port trucks, taxis, and long-haul freight users instead of low-frequency private vehicles.
RNG can improve financial performance by adding environmental value to fuel sales. Clean Energy placed its East Valley dairy RNG project into service in Q1 2026, with expected annual production of about 3.5 million gallons of RNG. This strengthens integrated production-to-station economics.
The strongest financial impact is expected from fast-fill CNG stations, LNG freight corridors, depot fueling, RNG blending, and CBG-linked city gas networks. However, returns depend on gas sourcing, station uptime, compressor efficiency, fleet density, and policy support. Stations with long-term fleet demand are better positioned than standalone low-volume outlets.
Drivers Impact Analysis
The Natural Gas Refueling Stations Market is driven by rising demand for cleaner transport fuels, fleet conversion to CNG and LNG, public transport modernization, logistics decarbonization, and lower fuel cost compared with conventional fuels. Natural gas refueling stations support buses, trucks, taxis, delivery fleets, and industrial mobility users that need reliable and cost-efficient fueling.
Asia Pacific leads the market due to high urban transport demand, expanding CNG vehicle fleets, government support for cleaner fuels, and strong use of natural gas in public mobility. China, India, Pakistan, Thailand, and other regional markets continue to support station deployment through fleet expansion and urban air quality programs.
Impact Factor | Estimated CAGR Impact | Regional Relevance | Market Impact |
|---|---|---|---|
Growth in CNG vehicle fleets | +1.9% | Asia Pacific, Latin America, Middle East | Drives core station demand. |
Public transport fuel conversion | +1.6% | India, China, Southeast Asia | Supports high-volume refueling use. |
Lower fuel cost compared with diesel | +1.3% | Fleet and logistics operators | Improves operating economics. |
Urban air quality improvement programs | +1.1% | Asia Pacific and Europe | Supports cleaner fuel adoption. |
Expansion of commercial fleet operations | +0.9% | Logistics and municipal fleets | Builds steady fueling demand. |
Restraints Impact Analysis
The market faces restraints from high station setup cost, land availability issues, pipeline access limitations, permitting delays, and competition from electric vehicle charging infrastructure. Natural gas stations need compression equipment, storage systems, dispensers, safety systems, and reliable gas supply.
Another restraint is uncertainty around long-term fuel transition pathways. While CNG and LNG offer cleaner alternatives to diesel in many use cases, some fleet operators may delay investment due to rising interest in battery-electric and hydrogen mobility.
Impact Factor | Estimated CAGR Impact | Regional Relevance | Market Impact |
|---|---|---|---|
High station development cost | -0.9% | Global station developers | Slows network expansion. |
Limited pipeline and gas supply access | -0.8% | Emerging and remote markets | Restricts site selection. |
Competition from EV charging networks | -0.7% | Urban and developed markets | Affects long-term fuel planning. |
Permitting and safety compliance burden | -0.6% | Regulated transport markets | Delays project execution. |
Vehicle conversion cost concerns | -0.5% | Fleet operators and SMEs | Limits faster adoption. |
Opportunities Impact Analysis
Opportunities are strong in fast-fill CNG stations, LNG truck fueling corridors, public transport depots, fleet-based private stations, mobile refueling units, and bio-CNG integration. These areas benefit from growing demand for cleaner fuels in buses, taxis, logistics fleets, and long-haul transport.
Higher-value opportunities are also emerging in renewable natural gas stations, smart station management, digital payment systems, fleet fueling contracts, and combined CNG-LNG station formats. Operators that secure fleet partnerships and gas supply agreements can capture stronger long-term value.
Impact Factor | Estimated CAGR Impact | Regional Relevance | Market Impact |
|---|---|---|---|
Fast-fill CNG station expansion | +1.8% | Asia Pacific, Latin America, Europe | Builds high-throughput demand. |
LNG fueling for heavy trucks | +1.4% | China, India, Europe, U.S. | Supports long-haul transport. |
Public transport depot stations | +1.2% | Urban Asia Pacific markets | Adds stable fleet demand. |
Renewable natural gas and bio-CNG stations | +1.0% | Europe, North America, India | Improves low-carbon positioning. |
Fleet-based private refueling networks | +0.8% | Logistics and municipal operators | Strengthens recurring revenue. |
Challenges Impact Analysis
The main challenge is building a dense and reliable refueling network that matches fleet routes and vehicle demand. Station operators need the right location, gas supply, compressor capacity, safety systems, and fleet partnerships to maintain strong utilization.
Another challenge is maintaining station uptime and safety. Compressors, storage systems, dispensers, and pressure control equipment require regular maintenance, skilled technicians, and strict operating standards to avoid service disruption.
Impact Factor | Estimated CAGR Impact | Regional Relevance | Market Impact |
|---|---|---|---|
Building route-based station density | -0.8% | Fleet corridors and urban regions | Affects vehicle adoption. |
Maintaining compressor and equipment uptime | -0.7% | High-use stations | Protects service reliability. |
Ensuring safety and pressure compliance | -0.6% | CNG and LNG station networks | Supports public trust. |
Managing station utilization risk | -0.5% | New refueling locations | Affects project returns. |
Skilled maintenance workforce shortage | -0.4% | Emerging station markets | Raises operating risk. |
Segment Covered in the Report
By Natural Gas Type
Liquefied Natural Gas
Renewable / Bio-CNG
By Station Type
Fast-Fill Stations
Time-Fill Stations
Mobile / Portable Stations
Combined-Fill Stations
By Application
Public Transportation and Commercial Fleets
Freight and Logistics
Private Vehicles
Industrial Mobility
By Region
North America
Europe
Asia Pacific
Latin America
Middle East and Africa
Market Trend Analysis
The market trend is moving toward fast-fill CNG stations, LNG fueling corridors, depot-based fleet refueling, mobile stations, bio-CNG supply, and digital station monitoring. Fleet operators are focusing on refueling reliability, fuel cost savings, and lower emissions.
Asia Pacific remains the largest value region because of high CNG vehicle penetration, expanding public transport fleets, and strong demand for affordable cleaner fuel. North America and Europe support value growth through renewable natural gas, fleet fueling, and LNG heavy-duty transport applications.
Impact Factor | Estimated CAGR Impact | Regional Relevance | Market Impact |
|---|---|---|---|
Fast-fill station adoption rises | +1.7% | Asia Pacific, Europe, North America | Supports high-volume refueling. |
LNG corridor development grows | +1.3% | China, India, Europe, U.S. | Adds heavy-duty transport value. |
Bio-CNG and RNG fueling gains attention | +1.1% | Europe, India, North America | Improves emissions profile. |
Fleet depot refueling expands | +0.9% | Public transport and logistics fleets | Builds stable utilization. |
Digital station monitoring increases | +0.7% | Developed and high-use networks | Improves uptime and service control. |
Investor Type Impact Matrix
Investors should focus on station operators with strong locations, fleet contracts, reliable gas supply, compressor uptime, and safety compliance. Utilization rate, fuel margin, maintenance quality, and route coverage are key success factors.
Strategic investors can also target CNG station developers, LNG fueling corridor operators, compressor suppliers, bio-CNG project developers, digital station software firms, and fleet fueling service providers. Companies that connect refueling infrastructure with long-term fleet demand are better positioned for steady growth.
Investor Type | Estimated CAGR Impact | Regional Relevance | Market Impact |
|---|---|---|---|
Natural Gas Station Operators | +1.4% | Global | Expands refueling network supply. |
Fast-Fill CNG Infrastructure Developers | +1.2% | Asia Pacific, Europe, Latin America | Supports high-volume fleet use. |
LNG Refueling Corridor Operators | +1.0% | China, India, Europe, North America | Builds heavy-duty transport demand. |
Compressor and Equipment Suppliers | +0.8% | Global station infrastructure markets | Supports station reliability. |
Strategic Clean Mobility Investors | +0.7% | Global transport fuel markets | Funds network expansion and fleet contracts. |
Recent Developments
April 2026: Galileo equipped a new CNG service station in San José de la Dormida, Córdoba, using Microbox compressors and EMB dispensers to support daily natural gas vehicle fueling.
March 2026: Shell updated its LNG business outlook, stating its integrated gas and LNG portfolio met around 16% of global LNG demand in 2025, supporting broader LNG supply availability.
October 2025: Parker highlighted its natural gas product range covering CNG, LNG and LPG fuel conveyance, regulation and dispensing, supporting vehicle fueling systems and related station equipment requirements.
Competitive Landscape
The market is characterized by intense competition among established players and emerging companies. Strategic partnerships, mergers and acquisitions, and product innovation are key strategies employed by market participants.
Key Market Players
Clean Energy Fuels Corp.
Linde plc
Air Liquide S.A.
Chart Industries, Inc.
Parker Hannifin Corporation
Cryostar SAS
Hexagon Composites ASA
Galileo Technologies S.A.
ANGI Energy Systems LLC
Trillium CNG
Shell plc
TotalEnergies
Other Key Players
Research Methodology
This market study is prepared using a combination of primary and secondary research. Primary research includes discussions with manufacturers, suppliers, distributors, consultants, industry experts, and end users. Secondary research covers company reports, government databases, trade associations, technical publications, regulatory sources, and trusted industry documents. The collected information is used to assess market demand, pricing trends, technology adoption, competitive activity, and regional performance.
AI language models are not used as primary data sources, and publicly available AI-generated content is not treated as market evidence. Computational tools may be used to support data processing, translation, data classification, and pattern identification. However, every published assessment is supported by verified sources, human review, and primary market discussions.
Market estimates are developed through top-down and bottom-up approaches and validated using data triangulation. Revenue, production, shipment, pricing, and application-level data are compared across multiple sources. Forecasts consider economic conditions, regulatory changes, investment activity, innovation, supply chain developments, and industry risks. All findings are reviewed through source verification and internal quality checks before publication.
Part I
Source Management & Input Data Standards
Who provides data, how sources are qualified, and what types of evidence are admissible.
Part II
Research Scope & Market Coverage
How we define the markets we assess and the parameters that govern each product.
Part III
Data Collection, Verification & Submission
The mechanics of gathering, cross-checking, and hierarchically ranking evidence.
Part IV
Assessment Determination & Quality Controls
How raw data becomes a published assessment — normalisation, expert judgement, and outlier exclusion.
Part V
Publication, Corrections & Revision
Our publication schedule, corrections policy, and methodology review cycle.
Part VI
Independence, Ethics & Complaints
Conflict-of-interest policies, editorial independence, and how clients raise concerns.
Google · Preferred Sources
Don't miss the latest market research insights and industry updates on Google.
Add Globe Market Research as a preferred source in the Google app to see our reports, analysis, and market stories in your news suggestions.
Meet the Team
This report was prepared by our expert analysts with deep industry knowledge and research experience.
Prashant S. is a Research Analyst at Globe Market Research with more than four years of experience in market research and industry analysis. He specializes in the Aerospace and Defence, Automotive and Transportation, Semiconductor and Electronics, Information and Technology sectors, with expertise in market sizing, trend analysis, competitive assessment, and industry forecasting. He applies primary and secondary research, data validation, company analysis, and market estimation methods to deliver reliable insights for strategic planning and business decision-making.
Pratiksha K. is a Senior Research Analyst with more than five years of experience in market research, industry analysis, competitive intelligence, and business strategy. She has contributed to detailed market reports, customized research studies, company profiling, market sizing, trend analysis, and strategic consulting projects for clients across different regions. Her industry expertise covers Chemical and Material, Consumer Goods, Food & Beverages and Energy & Power. She closely evaluates changing customer requirements, technology developments, regulatory conditions, supply chain structures, investment activity, and competitive strategies to provide clear and practical market insights.
Sayali brings more than 7 years of experience to Globe Market Research, supporting the accuracy, clarity, and relevance of research content across multiple industries. She reviews market data, segment analysis, competitive insights, and industry trends to ensure each report meets strong quality standards and provides practical value to business decision-makers. Her expertise spans healthcare, information technology, consumer goods, and diverse cross-industry domains. With a strong focus on data reliability, structured analysis, and clear presentation, Sayali helps ensure that each research output delivers well-reviewed insights for clients, investors, consultants, and industry stakeholders.
Frequently Asked Questions
Related Reports
More in Energy and Power
Oil and Gas Turbomachinery Market to Hit USD 26.9 Billion by 2035
Oil and Gas Turbomachinery Market Size, Share, Analysis By Type (Gas Compressors, Gas and Steam Turbines, Pumps, Other Types), By Deployment (Onshore, Offshore), By Industry (Upstream, Midstream, Downstream), By Regional Insights, Business plan and Project Report, Investment Opportunities, Profitability, Industry Trends, Leading Companies and Growth Forecasts by 2025-2035
Liquefied Natural Gas (LNG) Bunkering Market to Hit USD 51.7 Billion by 2035
Liquefied Natural Gas (LNG) Bunkering Market Size, Share, Analysis By Product Type (Ship-to-Ship, Truck-to-Ship, Port-to-Ship, Portable Tanks), By Application (Cargo Fleet, Tanker Fleet, Container Fleet, Ferries, Inland Vessels, Others), By Regional Insights, Business plan and Project Report, Investment Opportunities, Profitability, Industry Trends, Leading Companies and Growth Forecasts by 2025-2035
Wind Energy Market to Hit USD 348.1 Billion by 2035
Wind Energy Market Size, Share, Analysis By Location (Onshore, Offshore), By Application (Utility, Non-Utility), By Component(Turbine, Support Structure, Electrical Infrastructure, Others), By Regional Insights, Business plan and Project Report, Investment Opportunities, Profitability, Industry Trends, Leading Companies and Growth Forecasts by 2025-2035
Power EPC Market to Hit USD 1,516.1 Billion by 2035
Power EPC Market Size, Share, Analysis By Type of Power Generation (Thermal Power, Renewable Energy, Nuclear Power, Hydropower, Others), By Service Type (Engineering, Procurement, Construction), By Equipment Type (Steam Turbines, Gas Turbines, Solar PV Systems, Wind Turbines, Boilers, Generators, Others), By Regional Insights, Business plan and Project Report, Investment Opportunities, Profitability, Industry Trends, Leading Companies and Growth Forecasts by 2025-2035