

Revenue, 2025
USD 6.9 Bn
Forecast, 2035
USD 12.1 Bn
CAGR, 2025-2035
5.8%
Report Coverage
Global
Market Size and Forecast
The Global Natural Gas Compressor Market was worth USD 6.9 billion in 2025 and is expected to reach USD 12.1 billion by 2035, growing at a CAGR of 5.8% from 2025 to 2035. Based on this growth rate, the market is estimated to reach around USD 7.4 billion in 2026. North America held the largest regional share of 36.8% in 2025, valued at around USD 2.5 billion, supported by strong natural gas production, pipeline infrastructure, LNG activity, and demand for reliable gas transmission systems.
The Natural Gas Compressor Market includes equipment used to increase gas pressure for transportation, storage, processing, and distribution across the energy value chain. These compressors are widely used in upstream production sites, midstream pipelines, gas gathering systems, LNG facilities, storage terminals, refineries, and industrial gas networks. The market is closely linked with natural gas supply reliability, energy security, and pipeline efficiency.
Key Parameter | Report Details |
|---|---|
Market Revenue, 2025 | USD 6.9 Billion |
Projected Revenue, 2035 | USD 12.1 Billion |
CAGR (2025-2035) | 5.8% |
Largest Region | Asia Pacific (37.8% Share) |
Market Concentration | Medium |
Base Year | 2024 |
Forecast Period | 2025-2035 |
The market outlook remains steady as natural gas continues to play an important role in power generation, industrial heating, LNG exports, and backup energy supply. Growth can be attributed to expanding gas infrastructure, rising LNG trade, modernization of aging compressor stations, and increasing demand for energy-efficient compression systems. The expansion of North American shale gas production, pipeline upgrades, and low-emission compressor technologies is expected to support long-term market demand.
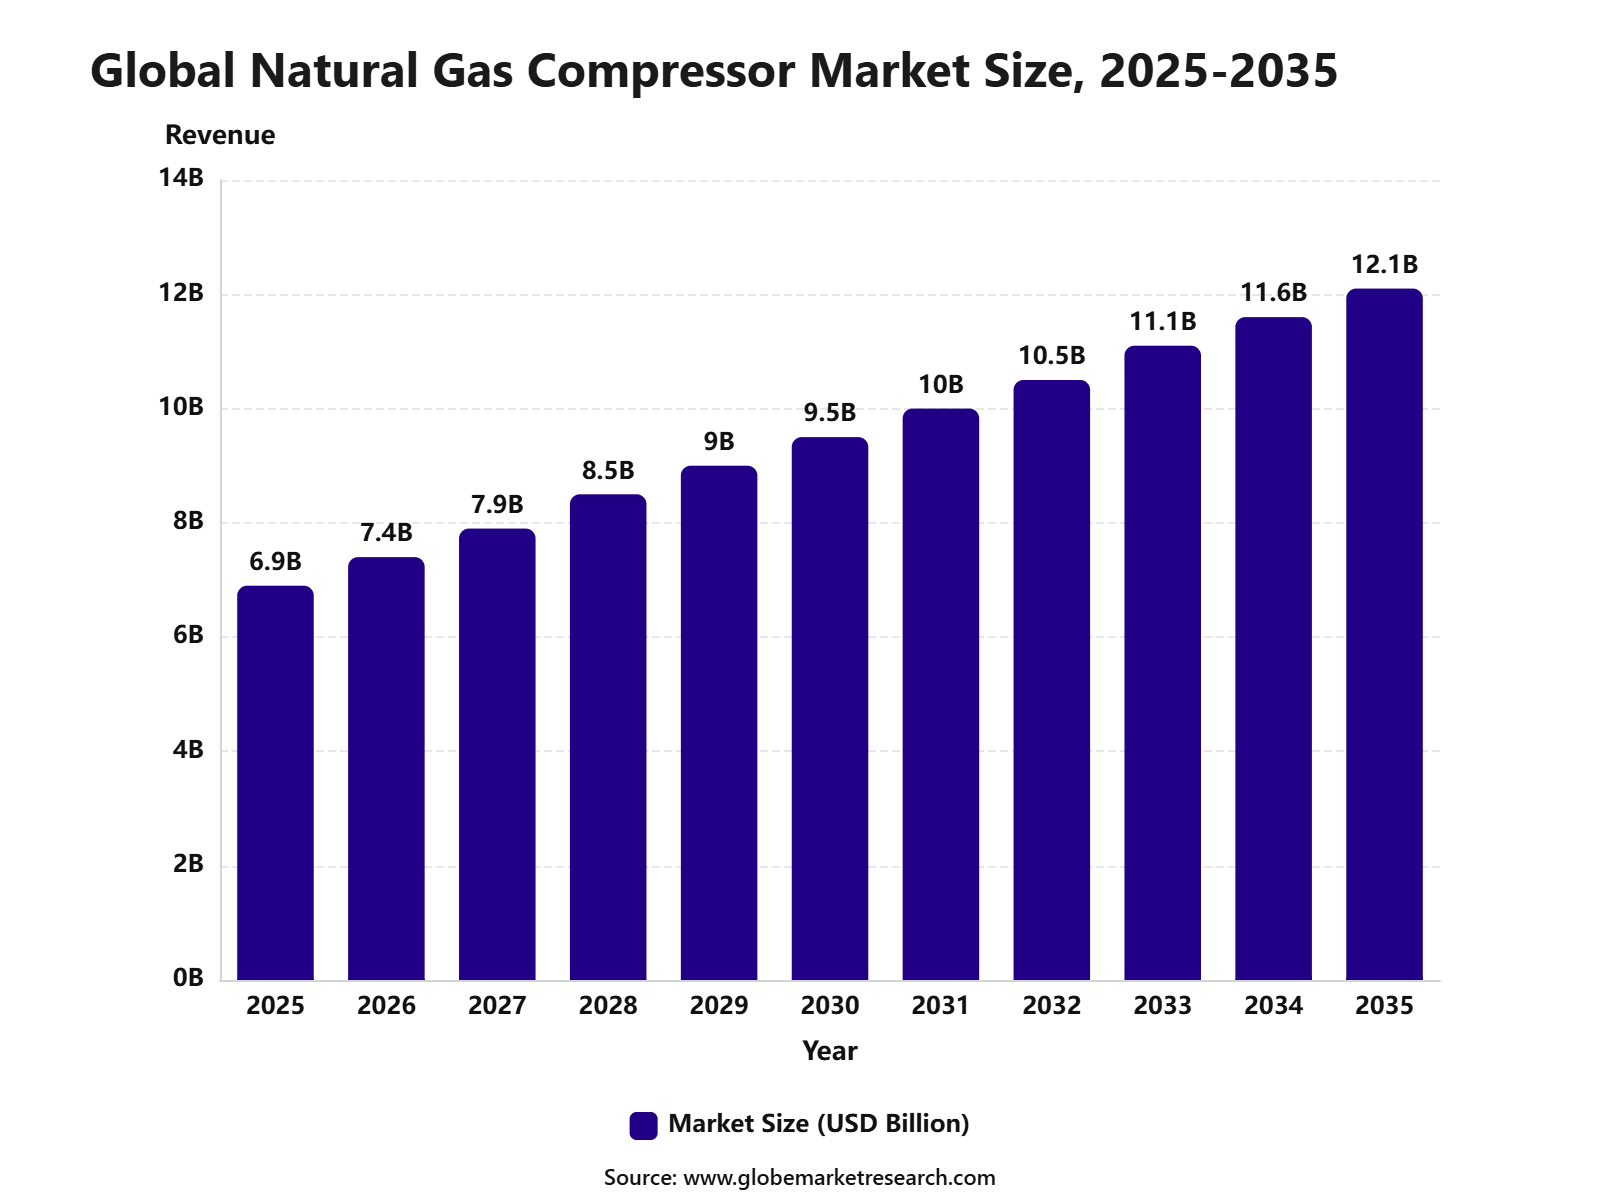 iThe graph shows projected market growth until 2035 based on CAGR analysis. Actual outcomes may vary depending on changing demand, competition, and economic factors.To gain greater insights - request a sample report PDF
Key Market Insights
Centrifugal compressors led the compressor type segment with 47.5% share, supported by their high flow capacity, reliable performance, and strong use in gas transmission, processing, and pipeline operations.
Dynamic displacement compressors accounted for 58.2% share, driven by their suitability for continuous gas movement, large-volume compression, and efficient operation in midstream and industrial gas systems.
Oil and gas held 57.8% share by end user, supported by strong demand for compressors in natural gas extraction, gathering, processing, transportation, storage, and LNG-related applications.
North America led the natural gas compressor market with 36.8% share, valued at USD 2.5 billion, supported by large shale gas production, extensive pipeline infrastructure, and strong investment in gas processing and transmission systems.
Top Funding and Investment
Top Investments
Energy Transfer announced the Desert Southwest pipeline expansion project, with an estimated cost of about USD 5.3 billion, including USD 0.6 billion of allowance for funds used during construction. The project includes 516 miles of pipeline and nine compressor stations across Arizona, New Mexico, and Texas. It is designed to move 1.5 Bcf/d of natural gas from the Permian Basin to fast-growing Southwest markets.
Kinder Morgan advanced the South System Expansion 4 project, estimated at about USD 3.5 billion, with Kinder Morgan’s share at around USD 1.8 billion. The project is designed to add roughly 1.3 Bcf/d of capacity on Southern Natural Gas’ South Main Line. It is mainly based on brownfield looping and horsepower compression additions across SNG and Elba Express pipeline systems.
ARM Energy and PIMCO announced a USD 2.3 billion investment in the Mustang Express Pipeline in Texas. The 236-mile, 42-inch pipeline is planned to transport up to 2.5 Bcf/d of natural gas to Gulf Coast LNG demand centers. Solar Turbines will supply turbines for three gas-driven compressor stations with total capacity of 300,000 horsepower.
TC Energy completed its Wisconsin Reliability Project, a USD 700 million natural gas pipeline enhancement project. The project supported pipeline reliability, compressor station work, and system modernization across Wisconsin and northern Illinois. TC Energy stated that construction generated about USD 1.1 billion in economic output, supported more than 4,300 jobs, and contributed USD 68 million in tax revenue.
Enbridge reached final investment decision on the Algonquin Gas Transmission Enhancement project and expects to invest about USD 300 million in system upgrades. The project is planned to add around 75 MMcf/d of incremental natural gas capacity for customers in the U.S. Northeast. The investment is focused on reliability, winter price stability, and upgrades within or near existing rights-of-way.
Top Funding Developments
Kodiak Gas Services priced USD 1.2 billion of senior unsecured notes. Kodiak is a major provider of contract natural gas compression services, and the debt raise supported its capital structure and repayment of borrowings. In a later filing, Kodiak stated that proceeds from the 2035 notes offering were used to repay part of the debt outstanding under its ABL facility.
Archrock priced an upsized private offering of USD 800 million of 6.000% senior notes due 2034. The company is a pure-play natural gas compression services provider, and the financing supported debt refinancing and general corporate financing needs. The offering closed on January 21, 2026.
USA Compression Partners priced a USD 750 million senior notes offering. The partnership provides compression services across major U.S. natural gas and oil producing regions. Its later 2026 report showed USD 750 million outstanding under the 6.250% senior notes due 2033, confirming the financing remained part of its capital structure.
Top Acquisitions
Archrock completed the acquisition of Natural Gas Compression Systems, Inc. and NGCSE, Inc. in May 2025. The transaction was valued at about USD 357 million, including a cash portion of about USD 299 million at closing and Archrock common shares. What it acquired was a contract gas compression services business that strengthened Archrock’s natural gas compression fleet and operating position across key U.S. regions.
Natural Gas Services Group acquired Flatrock Compression Holdings for USD 120 million, consisting of USD 110 million in cash and USD 10 million in newly issued NGS common stock. What it acquired was a rental compression services business with operations in the Permian Basin and Eagle Ford, including about 86,000 horsepower of rented fleet capacity, mostly large-horsepower and electric motor-driven units, with around 95% utilization. The deal also increased NGS’s committed credit facility from USD 400 million to USD 500 million.
By Compressor Type
Centrifugal compressors accounted for 47.5% share of the Natural Gas Compressor Market. This leading position is supported by their strong use in high-flow natural gas transmission, processing plants, LNG facilities, refineries, and pipeline networks.
The segment is widely preferred because centrifugal compressors can handle large gas volumes with continuous and efficient operation. They are suitable for applications where stable pressure, lower maintenance needs, and high operational reliability are required.
Demand for centrifugal compressors is expected to remain strong as natural gas infrastructure, LNG trade, and gas processing capacity continue to expand. Their role in long-distance pipeline movement and large-scale industrial gas handling will continue to support segment leadership.
By Displacement Type
Dynamic displacement compressors held 58.2% share of the Natural Gas Compressor Market. This dominance is driven by their ability to move large volumes of gas through continuous velocity-based compression.
These compressors are commonly used in gas transmission pipelines, processing facilities, petrochemical plants, and LNG operations. Dynamic displacement systems are preferred where high flow rates, steady operation, and efficient gas movement are more important than very high compression ratios.
The segment is expected to maintain strong demand as energy companies invest in reliable gas transport and processing systems. Growth will be supported by rising demand for pipeline compression, LNG export capacity, and industrial natural gas use.
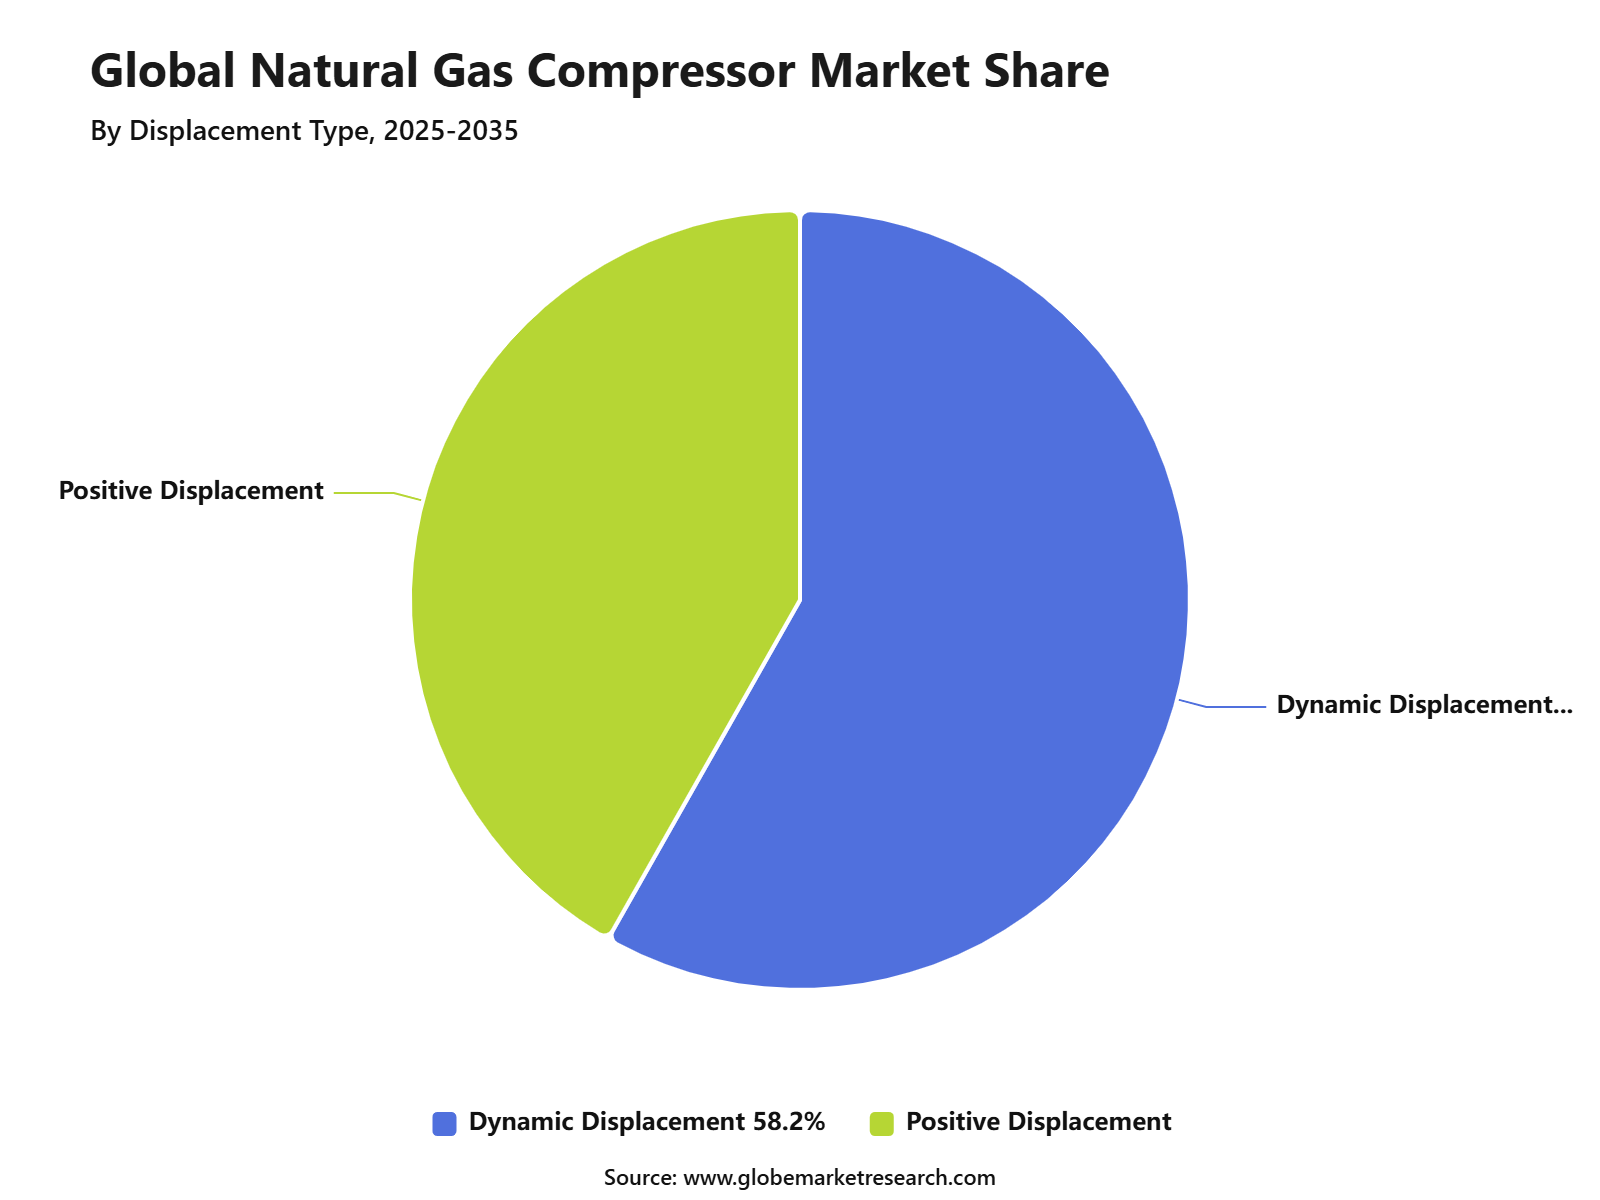 iThe graph shows projected market growth until 2035 based on CAGR analysis. Actual outcomes may vary depending on changing demand, competition, and economic factors.To gain greater insights - request a sample report PDF
By End User
The oil and gas industry accounted for 57.8% share of the Natural Gas Compressor Market. This leading share is supported by heavy use of compressors in upstream production, gas gathering, processing, transmission, storage, and refining operations.
Natural gas compressors are essential for maintaining gas pressure, moving gas through pipelines, separating gas streams, and supporting LNG and petrochemical operations. They help improve production efficiency, reduce pressure losses, and support continuous gas supply across the value chain.
The segment is expected to remain the largest end-user category as natural gas continues to play an important role in energy supply and industrial fuel use. Demand will remain supported by gas field development, pipeline expansion, LNG projects, and modernization of aging compression assets.
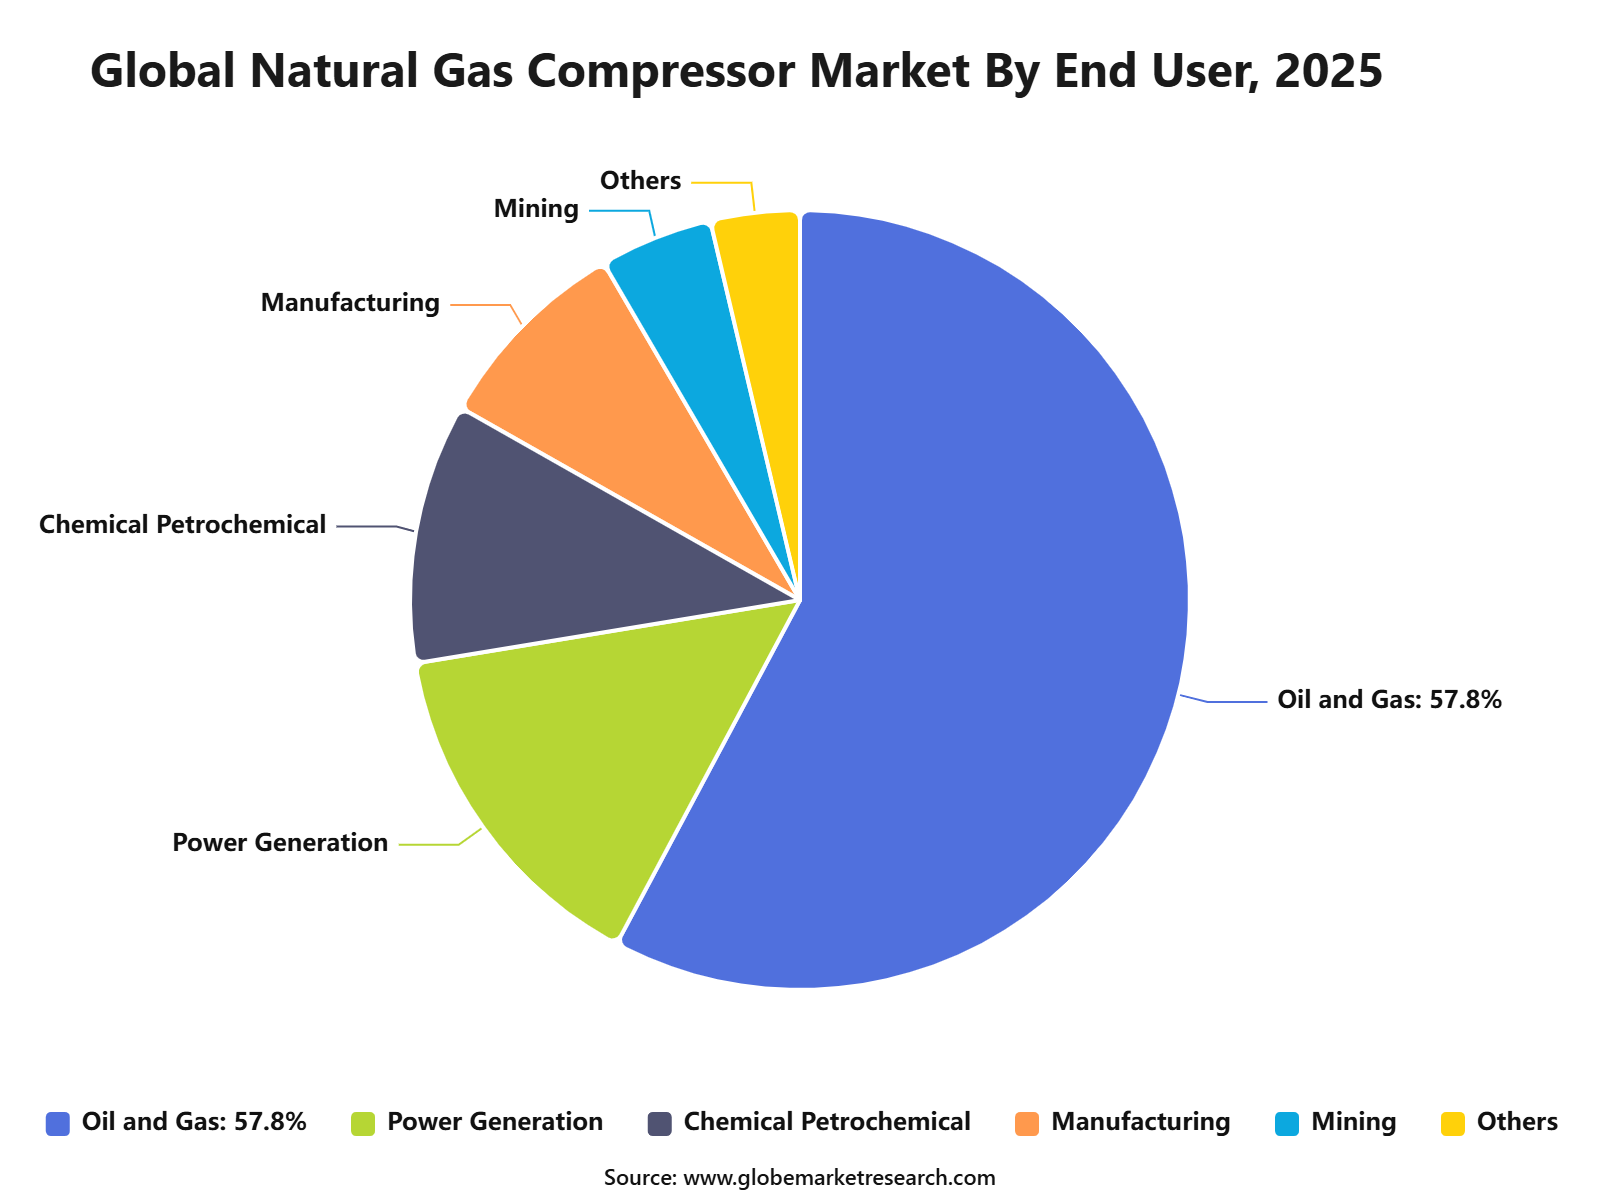 iThe graph shows projected market growth until 2035 based on CAGR analysis. Actual outcomes may vary depending on changing demand, competition, and economic factors.To gain greater insights - request a sample report PDF
By Region
North America accounted for 36.8% share of the Natural Gas Compressor Market, reaching USD 2.5 billion. The region’s leadership is supported by strong natural gas production, mature pipeline infrastructure, LNG export growth, and active oil and gas operations.
The United States and Canada are key contributors due to large shale gas reserves, extensive midstream networks, and strong demand from power generation, petrochemicals, and industrial users. Compressors are widely used across gas gathering systems, processing plants, transmission pipelines, underground storage, and LNG terminals.
North America is expected to maintain a strong position as gas infrastructure investment and compressor replacement activity continue. Demand will be supported by pipeline reliability needs, export-oriented LNG development, and the need for efficient gas movement across large production and consumption regions.
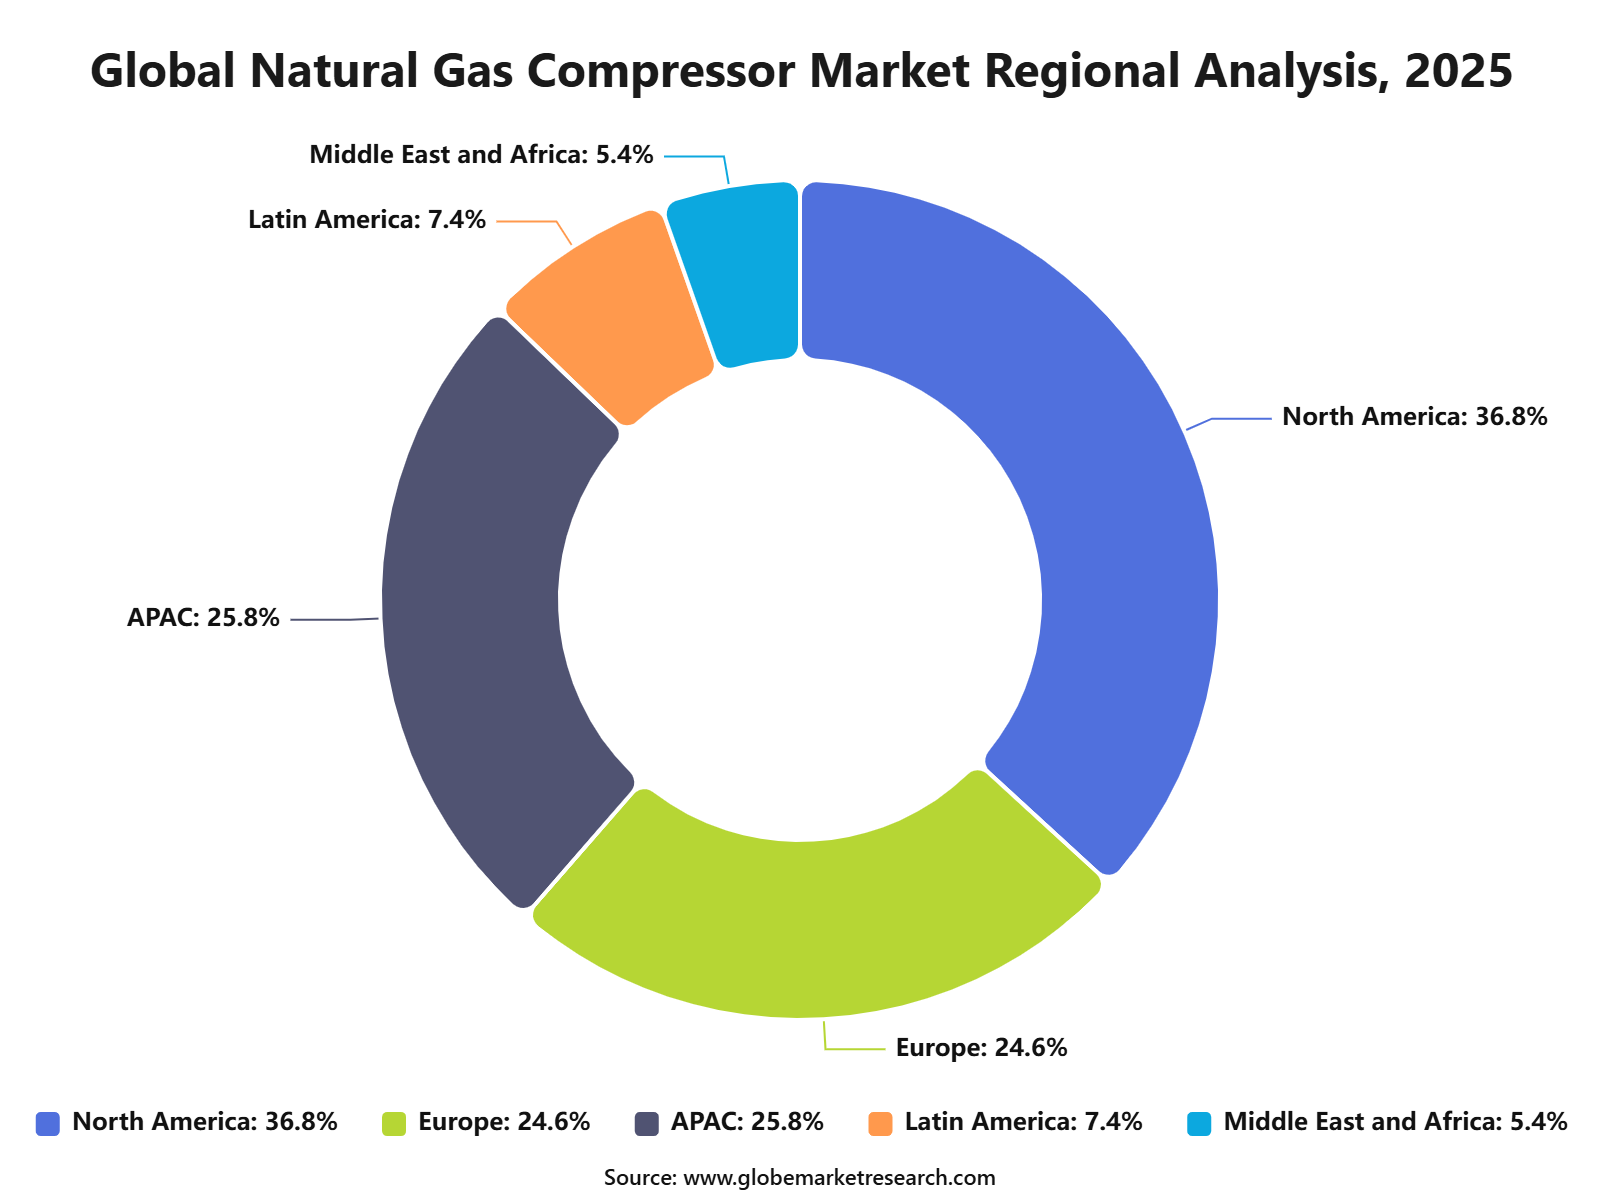 iThe graph shows projected market growth until 2035 based on CAGR analysis. Actual outcomes may vary depending on changing demand, competition, and economic factors.To gain greater insights - request a sample report PDF
Regional Impact Analysis
North America leads the Natural Gas Compressor Market with 36.8% share in 2025, valued at around USD 2.5 billion, supported by shale gas production, LNG export facilities, pipeline infrastructure, gas storage, and compressor replacement demand. The U.S. remains the main regional driver due to strong upstream and midstream gas activity.
Asia Pacific remains important because of rising natural gas consumption, LNG imports, gas-fired power generation, and pipeline development. Europe supports value growth through gas storage reliability, infrastructure modernization, emission reduction upgrades, and energy security planning.
Impact Factor | Estimated CAGR Impact | Regional Relevance | Market Impact |
|---|---|---|---|
North America market leadership | +1.9% | North America, 36.8% share in 2025 | Leads global value demand. |
U.S. shale gas and LNG activity | +1.4% | U.S. | Drives regional growth. |
Canada gas production and pipeline demand | +0.8% | Canada | Supports steady equipment use. |
Asia Pacific LNG and gas demand | +0.9% | China, India, Japan, South Korea | Builds future expansion. |
Europe infrastructure modernization | +0.6% | Germany, UK, Italy, Netherlands | Supports replacement demand. |
Go-To-Market and Sales Economics
Natural gas compressors are commercialized through midstream operators, pipeline companies, gas processors, LNG facilities, upstream producers, EPC firms, rental fleets, and OEM service contracts. Demand is supported by gas supply growth, as EIA forecasts U.S. marketed natural gas production to rise 3.3% in 2026, equal to about 3.9 Bcf/d.
Sales economics are strongest in gathering, processing, transmission, storage, and LNG feedgas applications where pressure control protects throughput. EIA reported that developers plan about 44.9 Bcf/d of new U.S. pipeline capacity during 2026 and 2027, with around 70% already under construction and most additions originating in Texas.
OEM and service revenue is supported by new equipment, parts, overhauls, controls, and field service. Baker Hughes reported Q1 2026 Industrial & Energy Technology revenue of USD 3.35 billion, up 14% year over year, with Gas Technology Equipment up 14% and Gas Technology Services up 34%.
Risk Factors & Market Barriers
The main barrier is project timing because compressor demand depends on drilling activity, pipeline approvals, LNG start-ups, and midstream capital spending. Permitting, land access, environmental review, and construction bottlenecks can delay station additions. This affects equipment bookings, rental fleet planning, spare parts demand, and service crew utilization.
Commodity price volatility also affects purchasing decisions. EIA expects natural gas prices to remain relatively flat in 2026 as supply growth outpaces demand, even as production increases. Lower or uncertain prices can reduce upstream urgency, while high power and LNG demand can still support midstream compression investment.
Emission rules and reliability concerns create another barrier. Compressor stations face methane, NOx, noise, and local permitting scrutiny, while electrified compression requires reliable grid access. FERC’s 2025 to 2026 winter assessment highlighted pipeline expansions with new compressor stations, showing that infrastructure growth must still pass regulatory and reliability review.
Revenue Potential Analysis
Revenue Landscape Across
Revenue is spread across upstream wellhead compression, gas gathering, processing plants, transmission pipelines, underground storage, LNG export terminals, and gas-fired power supply chains. EIA forecasts U.S. LNG exports to rise by 1.9 Bcf/d in 2026 to average 17.0 Bcf/d, supporting compression demand near liquefaction and feedgas infrastructure.
Rental and contract compression remain high-value revenue pools. Archrock reported Q1 2026 contract operations revenue of USD 330.9 million, up 10% year over year, with total operating horsepower rising to 4.5 million and fleet utilization ending at 95%. This shows strong recurring demand for outsourced compression services.
Large-horsepower compression is also expanding with Permian, Eagle Ford, Haynesville, and LNG-linked gas flows. Kodiak Gas Services reported Q1 2026 contract services revenue of USD 307.0 million, up 6.2% year over year, while revenue-generating horsepower reached 4.39 million and fleet utilization was 98.0%.
Financial Impact
Natural gas compressors create financial impact by increasing gas flow, reducing downtime, supporting pressure stability, and enabling higher pipeline utilization. For operators, compressor reliability directly affects throughput revenue and delivery obligations. Financial value is strongest where compression supports LNG exports, power demand, shale production, and gas processing capacity.
Supplier profitability depends on horsepower utilization, service margins, fuel cost, maintenance intensity, and contract duration. USA Compression reported 90.0% horsepower utilization at March 31, 2026, while Enerflex stated that customer contracts in its Engineered Systems product line will generate around USD 1.3 billion over their remaining terms.
The strongest financial returns are expected from high-horsepower rental fleets, digital monitoring, electric-drive compression, LNG-linked projects, and long-term service agreements. EIA expects U.S. natural gas pipeline exports to grow 4% in 2026 and 2% in 2027, adding another demand layer for compression assets and maintenance services.
Drivers Impact Analysis
The Natural Gas Compressor Market is driven by rising natural gas production, pipeline expansion, LNG infrastructure, gas processing facilities, storage systems, and demand from oil and gas operations. Compressors are essential for moving gas through pipelines, maintaining pressure, supporting processing plants, and improving field productivity.
North America leads the market due to strong shale gas production, large pipeline networks, LNG export projects, and well-developed midstream infrastructure. The U.S. remains the main regional contributor because of its high natural gas output, gathering systems, transmission pipelines, and export terminal activity.
Impact Factor | Estimated CAGR Impact | Regional Relevance | Market Impact |
|---|---|---|---|
Growth in natural gas production | +1.6% | North America, Middle East, Asia Pacific | Drives core compressor demand. |
Expansion of pipeline infrastructure | +1.3% | U.S., Canada, China, India | Supports transmission and distribution. |
LNG export and import terminal growth | +1.1% | North America, Asia Pacific, Europe | Adds compression equipment demand. |
Demand from gas processing facilities | +0.9% | Oil and gas producing regions | Supports field and plant operations. |
Rising gas storage and balancing needs | +0.7% | North America and Europe | Improves supply reliability. |
Restraints Impact Analysis
The market faces restraints from high equipment cost, maintenance requirements, emission regulations, and volatility in oil and gas investment cycles. Compressors operate under demanding pressure, temperature, and flow conditions, so buyers must invest in reliable equipment and regular servicing.
Another restraint is the gradual shift toward lower-carbon energy systems. Natural gas remains important for energy security and power generation, but long-term decarbonization policies may limit new fossil fuel infrastructure investment in some regions.
Impact Factor | Estimated CAGR Impact | Regional Relevance | Market Impact |
|---|---|---|---|
High capital and installation cost | -0.8% | Global oil and gas operators | Slows replacement and new purchases. |
Maintenance and downtime risk | -0.7% | Pipeline and processing facilities | Raises operating cost. |
Methane emission regulations | -0.6% | North America and Europe | Increases compliance pressure. |
Oil and gas investment volatility | -0.5% | Upstream and midstream markets | Affects order cycles. |
Competition from cleaner energy systems | -0.4% | Long-term energy transition markets | Limits some infrastructure growth. |
Opportunities Impact Analysis
Opportunities are strong in LNG facilities, gas gathering systems, pipeline compressor stations, gas storage sites, petrochemical feedstock supply, and replacement of aging compressor units. These applications benefit from steady demand for reliable gas movement and pressure control.
Higher-value opportunities are also emerging in low-emission compressors, electric-drive compressors, predictive maintenance, digital monitoring, and efficiency upgrades. Companies that reduce emissions, improve reliability, and lower lifecycle cost can capture stronger long-term demand.
Impact Factor | Estimated CAGR Impact | Regional Relevance | Market Impact |
|---|---|---|---|
LNG infrastructure expansion | +1.5% | North America, Asia Pacific, Middle East | Builds high-value demand. |
Electric-drive compressor adoption | +1.2% | North America and Europe | Supports lower-emission operations. |
Replacement of aging compressor fleets | +1.0% | Mature gas infrastructure markets | Adds recurring demand. |
Digital monitoring and predictive maintenance | +0.8% | Pipeline and processing operators | Improves uptime. |
Gas storage and balancing projects | +0.6% | North America, Europe, Asia Pacific | Supports supply stability. |
Challenges Impact Analysis
The main challenge is improving compressor efficiency while meeting stricter emission and reliability standards. Operators want equipment that reduces methane leakage, lowers fuel use, and performs well across variable gas flow conditions.
Another challenge is managing supply chain and service availability. Compressors require precision components, skilled technicians, spare parts, and field service support, especially in remote upstream and pipeline locations.
Impact Factor | Estimated CAGR Impact | Regional Relevance | Market Impact |
|---|---|---|---|
Meeting emission reduction requirements | -0.7% | North America, Europe, LNG markets | Raises technology upgrade needs. |
Improving energy efficiency | -0.6% | Gas processing and pipeline operators | Affects operating economics. |
Managing remote field service needs | -0.5% | Upstream and midstream sites | Impacts equipment uptime. |
Supply chain delays for critical parts | -0.4% | Global compressor manufacturers | Slows project delivery. |
Skilled technician shortage | -0.4% | Oil and gas service markets | Increases maintenance risk. |
Segment Covered in the Report
By Compressor Type
Centrifugal
Reciprocating
Rotary Screw
Others
By Displacement Type
Dynamic Displacement
Positive Displacement
By End User
Oil and Gas
Power Generation
Chemical and Petrochemical
Manufacturing
Others
By Region
North America
Europe
Asia Pacific
Latin America
Middle East and Africa
Market Trend Analysis
The market trend is moving toward electric-drive compressors, low-emission designs, remote monitoring, modular compressor packages, and predictive maintenance systems. Operators are focusing on equipment that improves reliability while reducing fuel consumption and emissions.
North America remains the value leader because of shale gas production, LNG exports, and extensive pipeline infrastructure. Asia Pacific and the Middle East are also expanding through rising gas demand, LNG trade, and investment in gas-based power and industrial systems.
Impact Factor | Estimated CAGR Impact | Regional Relevance | Market Impact |
|---|---|---|---|
Electric-drive compressor use increases | +1.4% | North America, Europe, LNG facilities | Supports cleaner operation. |
Low-emission compressor packages grow | +1.1% | Regulated gas markets | Improves compliance value. |
Remote monitoring adoption rises | +0.9% | Pipeline and field operators | Reduces downtime. |
Modular compressor systems expand | +0.7% | Upstream and midstream projects | Speeds installation. |
LNG-linked compression demand strengthens | +0.6% | North America, Asia Pacific, Middle East | Supports export and import growth. |
Investor Type Impact Matrix
Investors should focus on compressor companies with strong product reliability, low-emission technology, aftermarket service networks, digital monitoring capability, and exposure to LNG and pipeline infrastructure. Equipment durability, service quality, and regulatory compliance are key success factors.
Strategic investors can also target compressor manufacturers, component suppliers, electric-drive system providers, sealing technology firms, field service companies, and digital compressor monitoring platforms. Companies that reduce emissions and improve operating efficiency are better positioned for long-term growth.
Investor Type | Estimated CAGR Impact | Regional Relevance | Market Impact |
|---|---|---|---|
Natural Gas Compressor Manufacturers | +1.3% | Global | Expands core equipment supply. |
Electric-Drive Compressor Providers | +1.0% | North America, Europe, LNG markets | Supports lower-emission operations. |
Compressor Aftermarket Service Firms | +0.8% | Mature gas infrastructure markets | Builds recurring service revenue. |
Sealing and Control System Suppliers | +0.7% | Pipeline and processing applications | Improves reliability and compliance. |
Strategic Oil and Gas Equipment Investors | +0.6% | Global gas infrastructure markets | Funds modernization and scale. |
Recent Developments
April 2026: CATL unveiled Naxtra sodium-ion batteries and said full-scale mass production would start by end-2026, after solving key barriers in water control, gas generation, foil adhesion and anode formation.
April 2026: Tesla said it began ramping new battery and battery-materials factories and prepared production lines for Megapack 3, supporting energy storage growth and future manufacturing expansion.
April 2026: Samsung SDI signed a multi-year agreement with Mercedes-Benz to supply batteries for next-generation electric vehicles, marking its first EV battery supply contract with the automaker.
February 2026: LG Energy Solution agreed to acquire Stellantis’ 49% stake in NextStar Energy, taking full ownership of Canada’s large-scale battery manufacturing facility after more than CAD 5 billion investment.
Competitive Landscape
The market is characterized by intense competition among established players and emerging companies. Strategic partnerships, mergers and acquisitions, and product innovation are key strategies employed by market participants.
Key Market Players
Atlas Copco
Baker Hughes
Siemens Energy
Ariel Corporation
Ingersoll Rand
Burckhardt Compression
Howden
Kobelco Compressors
MAN Energy Solutions
Mitsubishi Heavy Industries Compressor
Hanwha Power Systems
Gardner Denver
Other Key Players
Research Methodology
This market study is prepared using a combination of primary and secondary research. Primary research includes discussions with manufacturers, suppliers, distributors, consultants, industry experts, and end users. Secondary research covers company reports, government databases, trade associations, technical publications, regulatory sources, and trusted industry documents. The collected information is used to assess market demand, pricing trends, technology adoption, competitive activity, and regional performance.
AI language models are not used as primary data sources, and publicly available AI-generated content is not treated as market evidence. Computational tools may be used to support data processing, translation, data classification, and pattern identification. However, every published assessment is supported by verified sources, human review, and primary market discussions.
Market estimates are developed through top-down and bottom-up approaches and validated using data triangulation. Revenue, production, shipment, pricing, and application-level data are compared across multiple sources. Forecasts consider economic conditions, regulatory changes, investment activity, innovation, supply chain developments, and industry risks. All findings are reviewed through source verification and internal quality checks before publication.
Part I
Source Management & Input Data Standards
Who provides data, how sources are qualified, and what types of evidence are admissible.
Part II
Research Scope & Market Coverage
How we define the markets we assess and the parameters that govern each product.
Part III
Data Collection, Verification & Submission
The mechanics of gathering, cross-checking, and hierarchically ranking evidence.
Part IV
Assessment Determination & Quality Controls
How raw data becomes a published assessment — normalisation, expert judgement, and outlier exclusion.
Part V
Publication, Corrections & Revision
Our publication schedule, corrections policy, and methodology review cycle.
Part VI
Independence, Ethics & Complaints
Conflict-of-interest policies, editorial independence, and how clients raise concerns.
Google · Preferred Sources
Don't miss the latest market research insights and industry updates on Google.
Add Globe Market Research as a preferred source in the Google app to see our reports, analysis, and market stories in your news suggestions.
Meet the Team
This report was prepared by our expert analysts with deep industry knowledge and research experience.
Pratiksha K. is a Senior Research Analyst with more than five years of experience in market research, industry analysis, competitive intelligence, and business strategy. She has contributed to detailed market reports, customized research studies, company profiling, market sizing, trend analysis, and strategic consulting projects for clients across different regions. Her industry expertise covers Chemical and Material, Consumer Goods, Food & Beverages and Energy & Power. She closely evaluates changing customer requirements, technology developments, regulatory conditions, supply chain structures, investment activity, and competitive strategies to provide clear and practical market insights.
Sayali brings more than 7 years of experience to Globe Market Research, supporting the accuracy, clarity, and relevance of research content across multiple industries. She reviews market data, segment analysis, competitive insights, and industry trends to ensure each report meets strong quality standards and provides practical value to business decision-makers. Her expertise spans healthcare, information technology, consumer goods, and diverse cross-industry domains. With a strong focus on data reliability, structured analysis, and clear presentation, Sayali helps ensure that each research output delivers well-reviewed insights for clients, investors, consultants, and industry stakeholders.
Frequently Asked Questions
Related Reports
More in Energy and Power
Oil and Gas Turbomachinery Market to Hit USD 26.9 Billion by 2035
Oil and Gas Turbomachinery Market Size, Share, Analysis By Type (Gas Compressors, Gas and Steam Turbines, Pumps, Other Types), By Deployment (Onshore, Offshore), By Industry (Upstream, Midstream, Downstream), By Regional Insights, Business plan and Project Report, Investment Opportunities, Profitability, Industry Trends, Leading Companies and Growth Forecasts by 2025-2035
Liquefied Natural Gas (LNG) Bunkering Market to Hit USD 51.7 Billion by 2035
Liquefied Natural Gas (LNG) Bunkering Market Size, Share, Analysis By Product Type (Ship-to-Ship, Truck-to-Ship, Port-to-Ship, Portable Tanks), By Application (Cargo Fleet, Tanker Fleet, Container Fleet, Ferries, Inland Vessels, Others), By Regional Insights, Business plan and Project Report, Investment Opportunities, Profitability, Industry Trends, Leading Companies and Growth Forecasts by 2025-2035
Wind Energy Market to Hit USD 348.1 Billion by 2035
Wind Energy Market Size, Share, Analysis By Location (Onshore, Offshore), By Application (Utility, Non-Utility), By Component(Turbine, Support Structure, Electrical Infrastructure, Others), By Regional Insights, Business plan and Project Report, Investment Opportunities, Profitability, Industry Trends, Leading Companies and Growth Forecasts by 2025-2035
Power EPC Market to Hit USD 1,516.1 Billion by 2035
Power EPC Market Size, Share, Analysis By Type of Power Generation (Thermal Power, Renewable Energy, Nuclear Power, Hydropower, Others), By Service Type (Engineering, Procurement, Construction), By Equipment Type (Steam Turbines, Gas Turbines, Solar PV Systems, Wind Turbines, Boilers, Generators, Others), By Regional Insights, Business plan and Project Report, Investment Opportunities, Profitability, Industry Trends, Leading Companies and Growth Forecasts by 2025-2035