

Revenue, 2026
USD 0.6 Bn
Forecast, 2035
USD 1.6 Bn
CAGR, 2026-2035
7.8%
Report Coverage
Global
Market Size and Forecast
The Global Paraben Market was worth USD 0.6 billion in 2026 and is expected to reach USD 1.6 billion by 2035, growing at a CAGR of 7.8% from 2026 to 2035. Asia Pacific held the largest regional share of 40.6% in 2026, valued at around USD 0.2 billion, supported by strong demand from cosmetics, personal care, pharmaceuticals, food processing, and industrial preservative applications.
The Paraben Market includes methylparaben, ethylparaben, propylparaben, butylparaben, and related preservative compounds used to prevent microbial growth and extend product shelf life. Parabens are widely used in skincare products, haircare products, cosmetics, topical medicines, oral care products, processed foods, and pharmaceutical formulations. Their use is linked with product safety, stability, preservation, and cost-effective formulation performance.
Key Parameter | Report Details |
|---|---|
Market Revenue, 2026 | USD 0.6 Billion |
Projected Revenue, 2035 | USD 1.6 Billion |
CAGR (2026-2035) | 7.8% |
Largest Region | Asia Pacific (40.6%, USD 0.2 Bn) |
Market Concentration | Medium |
Forecast Period | 2026-2035 |
Market growth is being supported by rising demand for stable and longer-lasting personal care and pharmaceutical products. Manufacturers use parabens because they are effective at low concentrations, compatible with many formulations, and help protect products from bacteria, yeast, and mold. Demand is also increasing in emerging economies where packaged personal care, beauty, hygiene, and healthcare products are expanding quickly.
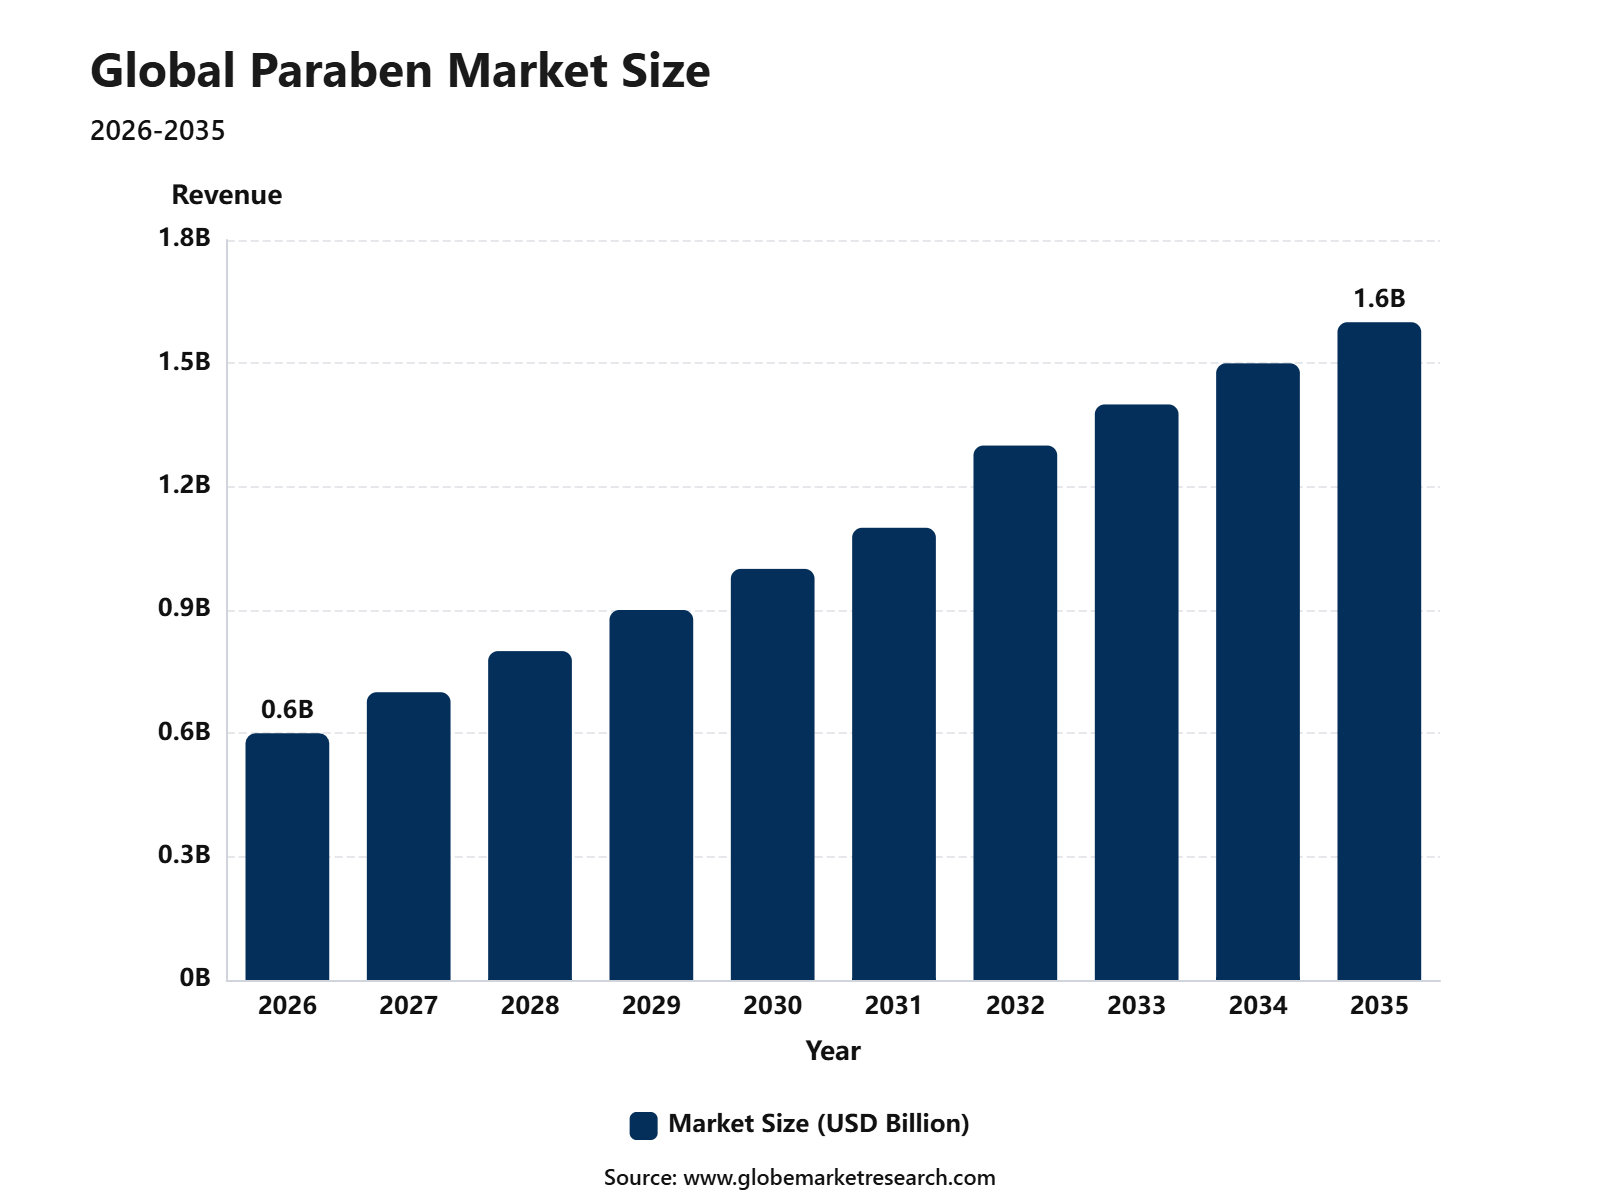 iThe graph shows projected market growth until 2035 based on CAGR analysis. Actual outcomes may vary depending on changing demand, competition, and economic factors.To gain greater insights - request a sample report PDF
Key Market Insights
Methyl paraben led the product type segment with 40.2% share, supported by its wide use as an effective preservative in cosmetics, personal care products, pharmaceuticals, and food formulations.
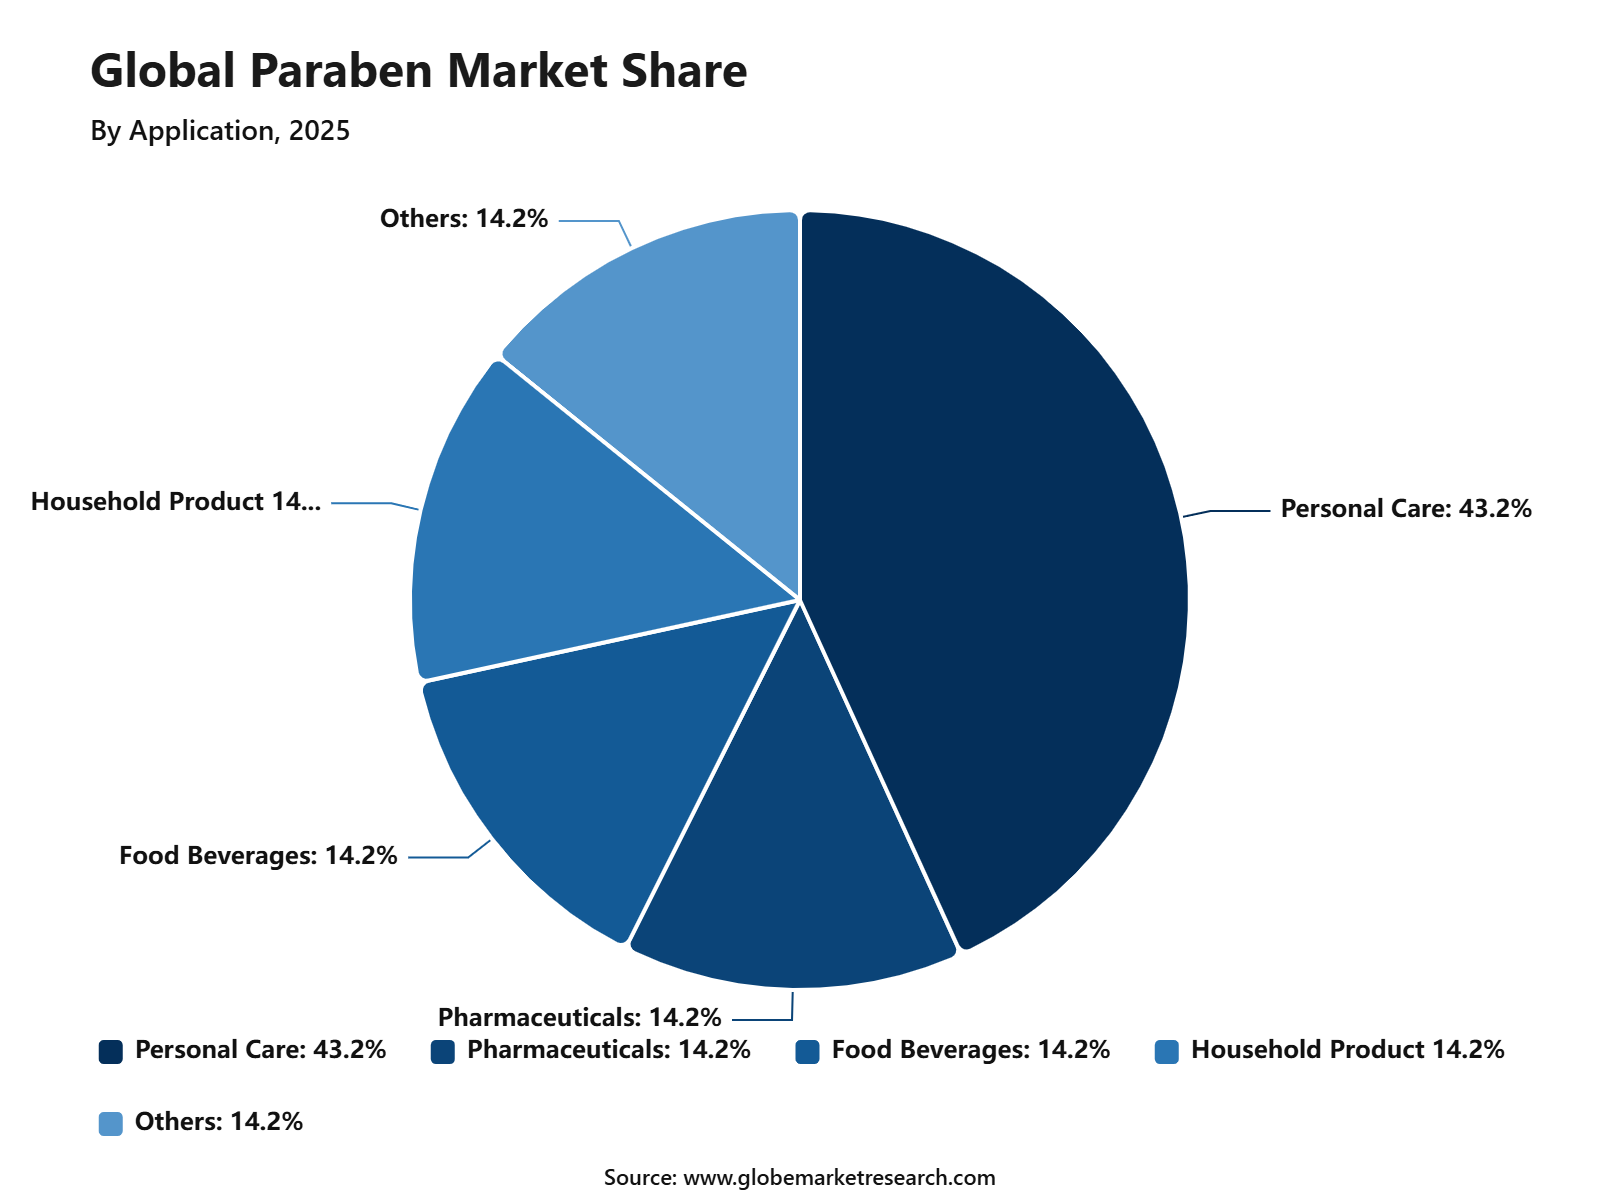
Cosmetics and personal care accounted for 43.2% share by application, driven by strong demand for preservatives in creams, lotions, shampoos, makeup, deodorants, and skincare products.
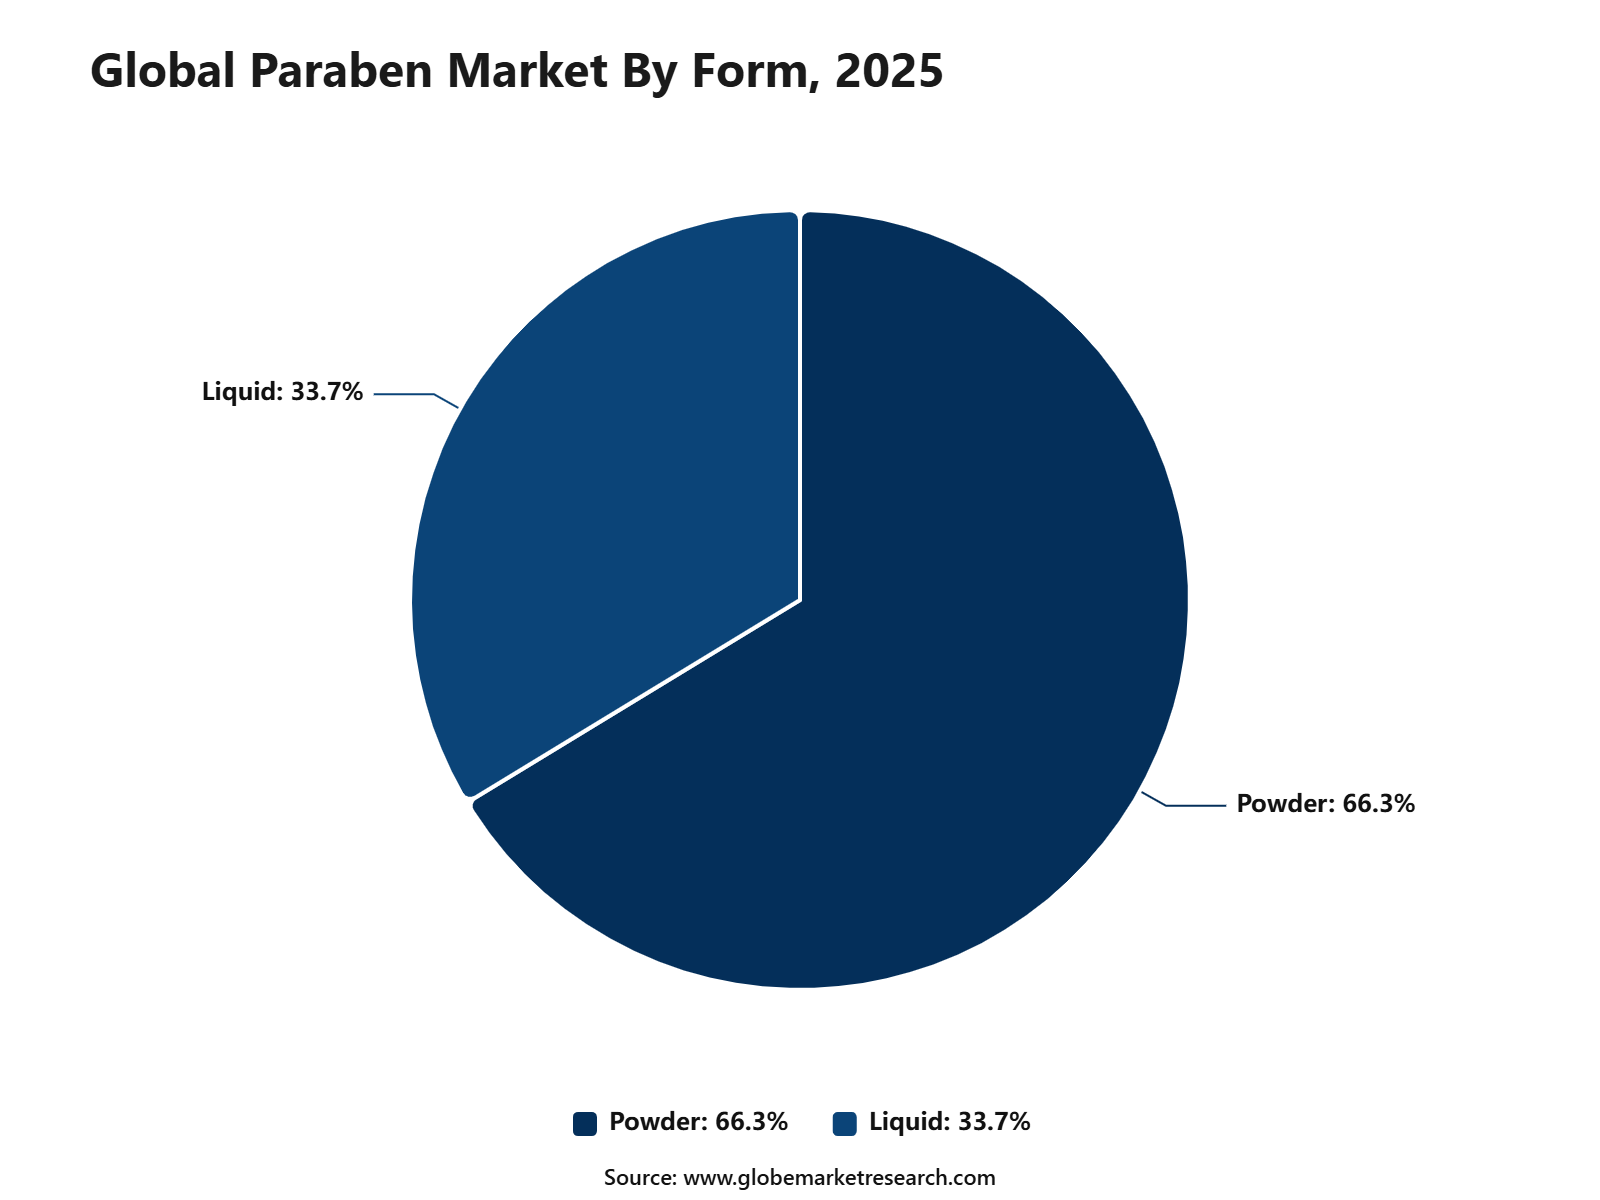
Powder form held 66.3% share, supported by easier handling, longer shelf life, better formulation control, and strong use in industrial-scale product manufacturing.
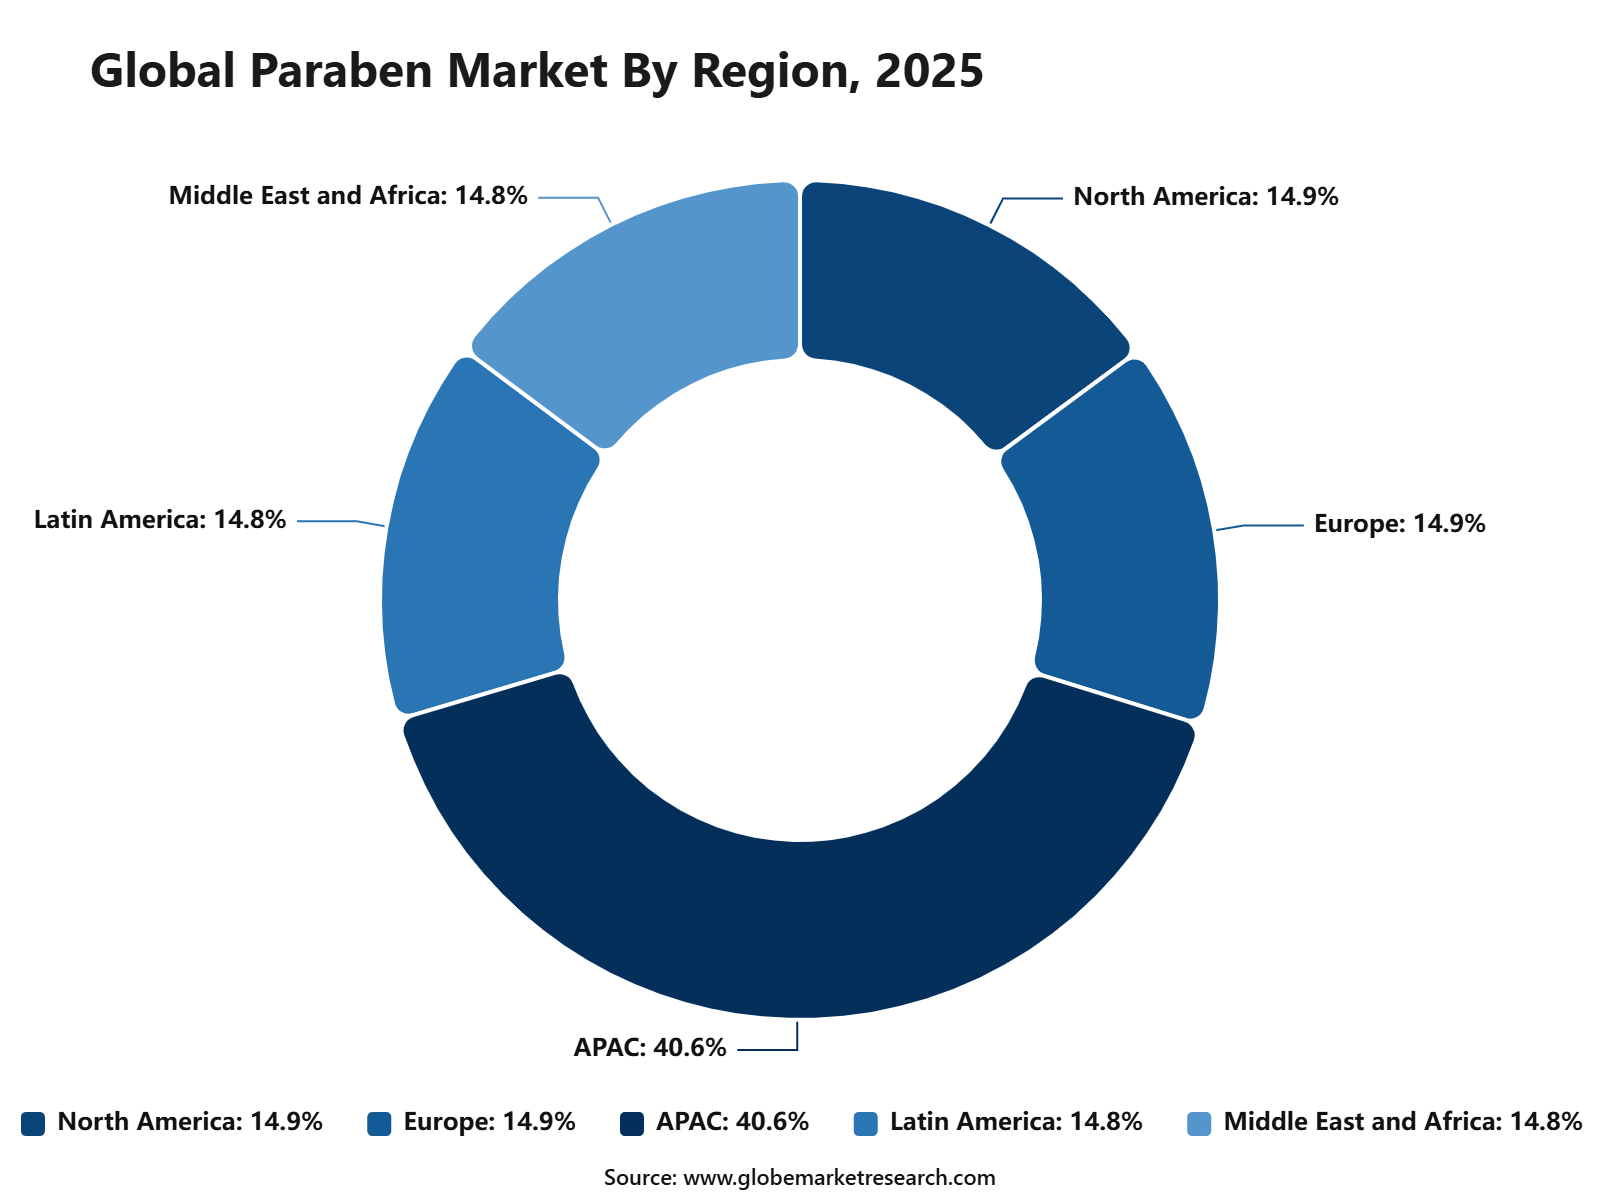
Asia Pacific led the paraben market with 40.6% share, valued at USD 0.2 billion, supported by strong cosmetics production, expanding personal care consumption, and rising demand across China, India, Japan, and Southeast Asia.
Top Funding and Investment
Top Investments
In 2025, Ashland continued expanding and optimizing its Hopewell, Virginia manufacturing complex supporting specialty ingredients and microbial protection products used in cosmetics and personal care preservatives, including paraben-based formulations. The company expects USD 50–55 million in annual pre-tax savings, with approximately USD 20 million already realized during fiscal 2025 through manufacturing improvements and operational efficiency.
During 2026, Ashland continued investing in production improvements and operational scale-up at its Calvert City, Kentucky facility. The site manufactures specialty additives and preservative-related intermediates supplied to pharmaceutical and personal care industries, strengthening production reliability despite startup challenges.
By Product Type
Methyl paraben accounted for 40.2% share of the Paraben Market. This leading position is supported by its wide use as a preservative in cosmetics, personal care products, pharmaceuticals, food products, and topical formulations.
The segment is widely preferred because methyl paraben offers effective antimicrobial protection, good formulation compatibility, and stable performance at low concentrations. It helps prevent microbial growth and supports longer product shelf life in creams, lotions, shampoos, conditioners, makeup, and skincare products.
Demand is expected to remain steady as manufacturers continue to require reliable preservative systems for product safety and stability. Its cost efficiency, easy blending, and long-standing use across regulated formulations will continue to support segment leadership.
By Application
Cosmetics and personal care accounted for 43.2% share of the Paraben Market. This dominance is driven by the strong use of parabens in skincare, haircare, makeup, fragrances, deodorants, body care, and hygiene products.
Parabens are used in this application because personal care products often contain water, oils, botanical extracts, and active ingredients that require preservation. They help protect formulations from bacteria, yeast, and mold while maintaining product quality during storage and use.
Demand from cosmetics and personal care is expected to remain strong as beauty and grooming product consumption continues to rise. Growth will be supported by skincare routines, haircare demand, premium beauty products, and the need for safe, stable, and longer-lasting formulations.
 iThe graph shows projected market growth until 2035 based on CAGR analysis. Actual outcomes may vary depending on changing demand, competition, and economic factors.To gain greater insights - request a sample report PDF
By Form
Powder form accounted for 66.3% share of the Paraben Market. This leading position is supported by easier handling, longer storage stability, accurate dosing, and strong suitability for industrial formulation processes.
Powder parabens are widely preferred by manufacturers because they can be measured, blended, and incorporated into cosmetic, pharmaceutical, and personal care formulations with consistency. The form also supports efficient packaging, transportation, and inventory management.
Demand for powder form is expected to remain strong as producers continue to prioritize formulation control and shelf stability. Its compatibility with large-scale production and preservative blending will continue to support its dominant position in the market.
 iThe graph shows projected market growth until 2035 based on CAGR analysis. Actual outcomes may vary depending on changing demand, competition, and economic factors.To gain greater insights - request a sample report PDF
By Region
Asia Pacific accounted for 40.6% share of the Paraben Market, reaching USD 0.2 billion. The region’s leadership is supported by strong cosmetics manufacturing, expanding personal care consumption, pharmaceutical production, and rising demand for affordable preservative ingredients.
China, India, Japan, South Korea, Indonesia, Thailand, and Vietnam are key contributors to regional demand. The region benefits from large consumer populations, growing beauty product usage, cost-efficient manufacturing, and strong supply chains for cosmetic and personal care ingredients.
Asia Pacific is expected to maintain its leading position as personal care, skincare, haircare, and pharmaceutical formulation activity continues to expand. Demand will remain supported by methyl paraben, powder forms, and strong use of preservatives in cosmetics and personal care products.
 iThe graph shows projected market growth until 2035 based on CAGR analysis. Actual outcomes may vary depending on changing demand, competition, and economic factors.To gain greater insights - request a sample report PDF
Regional Impact Analysis
Asia Pacific leads the Paraben Market with 40.6% share in 2026, valued at around USD 0.24 billion, supported by strong cosmetics production, pharmaceutical manufacturing, personal care consumption, and chemical supply chains. China and India remain major contributors due to large formulation and ingredient manufacturing capacity.
North America remains important because of demand from pharmaceuticals, personal care, and specialty formulations, although paraben-free beauty trends affect some cosmetic applications. Europe supports demand through regulated use, pharmaceutical quality standards, and advanced personal care formulation.
Impact Factor | Estimated CAGR Impact | Regional Relevance | Market Impact |
|---|---|---|---|
Asia Pacific market leadership | +2.2% | Asia Pacific, 40.6% share in 2026 | Leads global value demand. |
China cosmetics manufacturing scale | +1.6% | China | Drives large-volume preservative use. |
India pharmaceutical formulation growth | +1.3% | India | Supports regulated paraben demand. |
North America specialty formulation demand | +1.0% | U.S. and Canada | Adds premium and pharma use. |
Europe regulatory-led quality demand | +0.8% | Germany, France, UK, Italy | Supports compliant supply. |
Go-To-Market and Sales Economics
Paraben suppliers should prioritize cosmetics, personal care, pharmaceuticals, and selected food applications where microbial protection and long shelf life remain essential. FDA identifies methylparaben, propylparaben, butylparaben, and ethylparaben as the parabens most commonly used in cosmetics. Commercial offers should be organized by purity, solubility, dosage, formulation type, and regulatory destination.
Large cosmetic and pharmaceutical manufacturers should be served through direct technical sales, supply agreements, formulation trials, and detailed compliance support. Smaller producers can be reached through specialty chemical distributors offering local inventory and low minimum quantities. FDA’s Cosmetics Direct system added facility registration status and renewal-date fields in February 2026, increasing customer attention to supplier documentation.
Sales economics should be based on preservation performance, effective dosage, compatibility, stability, and avoided product losses rather than price per kilogram alone. Parabens protect formulations against harmful bacteria and mould, helping preserve product safety and usability. Suppliers that provide microbial challenge testing, formulation guidance, and regulatory files can defend higher margins and longer customer relationships.
Risk Factors & Market Barriers
Consumer preference for products promoted as paraben-free creates a significant commercial barrier, particularly in premium skincare, baby care, and natural personal care. Suppliers must clearly explain permitted usage, safety assessments, and preservation benefits without overstating claims. Portfolio diversification into alternative preservatives or blended systems can protect revenue when customers reformulate products for marketing or retailer requirements.
Regulatory conditions vary by paraben type, concentration, product category, and country. European rules list permitted cosmetic preservatives in Annex V, while methylparaben has been considered safe at concentrations up to 0.4% alone and within mixtures not exceeding 0.8% as acid. Suppliers require destination-specific specifications, labels, certificates, and technical dossiers.
Compliance costs are increasing as authorities strengthen cosmetic registration, notification, safety, and ingredient oversight. FDA updated MoCRA information in March 2026, while Health Canada maintained a prohibited and restricted ingredient Hotlist updated in March 2026. Producers must monitor changing requirements, impurities, concentration limits, product listings, and adverse-event documentation across every target market.
Revenue Potential Analysis
Revenue Landscape Across
North America provides revenue opportunities across lotions, creams, shampoos, cleansers, makeup, pharmaceuticals, and other water-based formulations requiring microbial stability. U.S. cosmetic facilities must manage registration and product-listing obligations under MoCRA, with biennial registration processes supported through updated FDA systems in 2026. Suppliers offering complete documentation can become preferred partners for regulated manufacturers.
Europe remains commercially important for methylparaben, propylparaben, specialized blends, and high-purity pharmaceutical grades. However, market access depends on compliance with permitted concentrations and application restrictions. The European Commission maintains an official list of authorized cosmetic preservatives, while scientific assessments continue to define safe conditions for individual parabens and sensitive product categories.
Canada offers revenue through personal care and cosmetic manufacturing, but suppliers must follow ingredient disclosure and notification changes. Beginning April 12, 2026, Canada requires 24 fragrance allergens to be declared above specified thresholds, expanding to 81 allergens for new cosmetics from August 1, 2026. This broader compliance environment favors technically capable ingredient suppliers.
Financial Impact
Parabens can support manufacturer profitability because effective preservation reduces microbial spoilage, discarded batches, consumer complaints, and premature product expiry. Their financial value is strongest in high-volume water-based products where contamination can affect complete production runs. Cost analysis should include dosage efficiency, testing expenditure, packaging compatibility, shelf-life performance, and the cost of alternative preservation systems.
Reformulating away from parabens may increase development expenditure through additional stability testing, challenge testing, ingredient combinations, packaging changes, and sensory evaluation. Alternative preservatives can require different concentrations or formulation conditions. Companies should compare total finished-product cost and recall risk rather than making decisions only from ingredient price or front-label marketing considerations.
Regulatory readiness directly affects revenue timing and customer retention. FDA requires facility registrations to be renewed every two years, and its 2026 portal updates added automated reminders and clearer status information. Accurate documentation, renewal planning, traceability, and product records can prevent delayed launches, interrupted supply agreements, and avoidable expenditure on corrective compliance work.
Preservative Safety Drives Market Decisions
Preservative safety is the most important factor influencing the Paraben Market because manufacturers must balance microbial protection with ingredient exposure. The European Commission’s 2025 assessment evaluated butylparaben at a maximum concentration of 0.14% and concluded that combined exposure across products was not safe for children. It identified lower levels of 0.002% in leave-on products and 0.092% in oral-care products as acceptable within the evaluated exposure conditions.
Regulatory transparency is also increasing across the broader cosmetics supply chain. FDA data available in 2026 showed 16,398 active cosmetic facility registrations and 1,298,361 active cosmetic product listings. Each marketed cosmetic product listing must include its ingredients and receive annual updates, while manufacturing and processing facilities must renew registration every two years. These requirements increase demand for accurate formulation records, ingredient traceability and reliable preservative documentation.
Active Cosmetic Facilities | 16,398 |
Active Cosmetic Product Listings | 1,298,361 |
Facility Renewal Frequency | Every 2 Years |
Product Listing Update | Annually |
Evaluated Butylparaben Limit | 0.14% |
Leave-On Product Level | 0.002% |
Oral-Care Product Level | 0.092% |
Safe Aggregate Exposure Limit | 245 µg/kg body weight/day |
Drivers Impact Analysis
The Paraben Market is driven by steady demand from cosmetics, personal care products, pharmaceuticals, food applications, and industrial formulations. Parabens are widely used as preservatives because they help prevent microbial growth, improve product shelf life, and maintain formulation stability.
Asia Pacific leads the market due to strong cosmetics manufacturing, rising personal care consumption, growing pharmaceutical production, and cost-effective chemical supply chains. China, India, Japan, South Korea, and Southeast Asia remain important demand centers for methyl paraben, propyl paraben, and other paraben-based preservatives.
Impact Factor | Estimated CAGR Impact | Regional Relevance | Market Impact |
|---|---|---|---|
Growth in cosmetics and personal care demand | +2.2% | Asia Pacific, Europe, North America | Drives core paraben consumption. |
Rising pharmaceutical formulation use | +1.7% | India, China, Europe, U.S. | Supports preservative demand in regulated products. |
Demand for longer product shelf life | +1.4% | Global consumer goods markets | Improves formulation stability. |
Cost efficiency versus alternatives | +1.1% | Emerging and mass-market brands | Supports continued usage. |
Expansion of beauty manufacturing | +0.9% | China, India, South Korea | Builds regional demand. |
Restraints Impact Analysis
The market faces restraints from consumer concerns over synthetic preservatives, clean-label beauty trends, regulatory scrutiny, and rising preference for paraben-free products. Many cosmetic and personal care brands are reformulating products to appeal to health-conscious buyers.
Another restraint is brand perception risk. Even when approved within regulatory limits, parabens can face negative consumer sentiment, especially in premium skincare, baby care, natural beauty, and organic personal care categories.
Impact Factor | Estimated CAGR Impact | Regional Relevance | Market Impact |
|---|---|---|---|
Paraben-free product trend | -1.0% | North America, Europe, urban Asia | Limits growth in premium beauty. |
Consumer safety perception concerns | -0.9% | Global personal care markets | Affects brand acceptance. |
Regulatory scrutiny on preservatives | -0.7% | Europe, U.S., export markets | Increases compliance pressure. |
Shift toward natural alternatives | -0.6% | Clean-label beauty brands | Reduces synthetic preservative demand. |
Reformulation by large brands | -0.5% | Cosmetics and personal care | Slows traditional paraben usage. |
Opportunities Impact Analysis
Opportunities are strong in regulated pharmaceutical formulations, mass-market personal care, cost-sensitive cosmetics, industrial preservatives, and emerging-market beauty products. Parabens remain useful where stability, antimicrobial performance, affordability, and long shelf life are important.
Higher-value opportunities are emerging in low-dose preservative blends, improved safety documentation, pharmaceutical-grade parabens, and application-specific preservative systems. Suppliers that support compliance, purity, and technical formulation can capture stronger demand.
Impact Factor | Estimated CAGR Impact | Regional Relevance | Market Impact |
|---|---|---|---|
Pharmaceutical-grade paraben demand | +2.0% | Asia Pacific, Europe, North America | Adds regulated high-value use. |
Preservative blend innovation | +1.6% | Cosmetics and personal care | Supports lower-dose formulation. |
Emerging-market personal care growth | +1.3% | India, China, Southeast Asia | Expands mass-market demand. |
Methyl paraben use in cosmetics | +1.0% | Asia Pacific and global beauty brands | Supports stable product formulations. |
Cost-effective preservation systems | +0.8% | Mass-market manufacturers | Strengthens value positioning. |
Challenges Impact Analysis
The main challenge is maintaining demand in a market where “paraben-free” claims are widely used as a marketing tool. Suppliers and manufacturers must manage consumer communication carefully while staying aligned with permitted regulatory limits.
Another challenge is balancing preservative performance with brand positioning. Natural alternatives may improve label appeal, but parabens often provide strong antimicrobial performance and cost advantages, creating a difficult formulation tradeoff.
Impact Factor | Estimated CAGR Impact | Regional Relevance | Market Impact |
|---|---|---|---|
Negative consumer perception | -0.9% | Premium cosmetics markets | Impacts product positioning. |
Replacement by natural preservatives | -0.8% | Clean-label and organic beauty | Reduces demand in niche categories. |
Regulatory variation by region | -0.6% | Export-oriented manufacturers | Adds compliance complexity. |
Formulation compatibility issues | -0.5% | Cosmetics and pharma products | Requires technical testing. |
Price competition among suppliers | -0.4% | Asia Pacific chemical markets | Pressures margins. |
Segment Covered in the Report
By Product Type
Methyl Paraben
Propyl Paraben
Butyl Paraben
Ethyl Paraben
Others
By Application
Cosmetics and Personal Care
Household Products
Others
By Form
Powder
Liquid
By Region
North America
Europe
Asia Pacific
Latin America
Middle East and Africa
Market Trend Analysis
The market trend is moving toward controlled-use parabens, pharmaceutical-grade quality, preservative blends, lower concentration systems, and stronger compliance documentation. While clean-label pressure affects cosmetics, demand remains stable in applications where proven preservative performance is required.
Asia Pacific remains the largest value region because of strong beauty, pharmaceutical, and chemical manufacturing activity. North America and Europe continue to influence product positioning through paraben-free trends, stricter labeling expectations, and premium personal care reformulation.
Impact Factor | Estimated CAGR Impact | Regional Relevance | Market Impact |
|---|---|---|---|
Controlled-use preservative systems | +1.8% | Global cosmetics and pharma | Supports compliant formulation. |
Pharmaceutical-grade purity demand | +1.5% | India, China, Europe, U.S. | Adds premium supply opportunity. |
Preservative blend adoption | +1.2% | Personal care formulations | Improves performance at lower levels. |
Paraben-free claims increase | -0.8% | North America and Europe | Shifts premium product strategy. |
Asia Pacific manufacturing growth | +1.0% | China, India, South Korea | Supports regional demand base. |
Investor Type Impact Matrix
Investors should focus on companies with strong chemical synthesis capability, high-purity production, regulatory expertise, formulation support, and reliable supply chains. Product quality, compliance documentation, cost control, and customer application support are key success factors.
Strategic investors can also target paraben manufacturers, pharmaceutical excipient suppliers, specialty chemical distributors, preservative blend companies, quality testing providers, and personal care ingredient firms. Companies that combine compliance with cost-efficient production are better positioned for long-term growth.
Investor Type | Estimated CAGR Impact | Regional Relevance | Market Impact |
|---|---|---|---|
Paraben Manufacturers | +1.5% | Asia Pacific, Europe, North America | Expands core preservative supply. |
Pharmaceutical Excipient Suppliers | +1.2% | Regulated healthcare markets | Supports stable pharma demand. |
Specialty Chemical Distributors | +1.0% | Global ingredient supply chains | Improves market access. |
Preservative Blend Companies | +0.8% | Cosmetics and personal care | Adds formulation-led value. |
Strategic Chemical Investors | +0.6% | Global specialty chemicals | Funds capacity and quality upgrades. |
Recent Developments
July 2026: BASF inaugurated a Düsseldorf specialty-emollients plant after a mid-double-digit-million-euro investment, expanding European and global capacity for skin-care and sun-protection ingredients while strengthening technical support for customer formulation development.
June 2026: Evonik opened its first Asia Beauty Science and Innovation Center in Shanghai, integrating biotechnology, formulation laboratories, testing, and scale-up capabilities to accelerate locally developed cosmetic and product-protection solutions for regional customers.
October 2025: Sasol commercialised LIVINEX IO 7, an insect-oil-based nonionic surfactant positioned as a drop-in oleochemical replacement for care formulations, while preparing a related personal-care ingredient for development within twelve months.
March 2025: Clariant launched Nipaguard SCE Vita, a fully naturally derived, broad-spectrum preservation blend for cosmetics, offering a 100% Renewable Carbon Index and an alternative for formulations avoiding controversial synthetic preservatives.
Competitive Landscape
The market is characterized by intense competition among established players and emerging companies. Strategic partnerships, mergers and acquisitions, and product innovation are key strategies employed by market participants.
Key Market Players
Ashland Inc.
Clariant AG
Sasol Limited
Solvay SA
Lonza Group
BASF SE
Evonik Industries
Ueno Fine Chemicals
Salicylates and Chemicals
Chemipol
Sharon Laboratories
Zhejiang Shengxiao Chemicals
Jiangsu Huanxin High-Tech Materials
Hangzhou Top Chemical
Muby Chemicals
Other key Players
Research Methodology
This market study is prepared using a combination of primary and secondary research. Primary research includes discussions with manufacturers, suppliers, distributors, consultants, industry experts, and end users. Secondary research covers company reports, government databases, trade associations, technical publications, regulatory sources, and trusted industry documents. The collected information is used to assess market demand, pricing trends, technology adoption, competitive activity, and regional performance.
AI language models are not used as primary data sources, and publicly available AI-generated content is not treated as market evidence. Computational tools may be used to support data processing, translation, data classification, and pattern identification. However, every published assessment is supported by verified sources, human review, and primary market discussions.
Market estimates are developed through top-down and bottom-up approaches and validated using data triangulation. Revenue, production, shipment, pricing, and application-level data are compared across multiple sources. Forecasts consider economic conditions, regulatory changes, investment activity, innovation, supply chain developments, and industry risks. All findings are reviewed through source verification and internal quality checks before publication.
Part I
Source Management & Input Data Standards
Who provides data, how sources are qualified, and what types of evidence are admissible.
Part II
Research Scope & Market Coverage
How we define the markets we assess and the parameters that govern each product.
Part III
Data Collection, Verification & Submission
The mechanics of gathering, cross-checking, and hierarchically ranking evidence.
Part IV
Assessment Determination & Quality Controls
How raw data becomes a published assessment — normalisation, expert judgement, and outlier exclusion.
Part V
Publication, Corrections & Revision
Our publication schedule, corrections policy, and methodology review cycle.
Part VI
Independence, Ethics & Complaints
Conflict-of-interest policies, editorial independence, and how clients raise concerns.
Google · Preferred Sources
Don't miss the latest market research insights and industry updates on Google.
Add Globe Market Research as a preferred source in the Google app to see our reports, analysis, and market stories in your news suggestions.
Meet the Team
This report was prepared by our expert analysts with deep industry knowledge and research experience.
Kimaya brings more than five years of experience in market research, content review, and industry analysis to Globe Market Research. She plays an important role in maintaining the accuracy, clarity, consistency, and relevance of research content across a wide range of industries. Her responsibilities include reviewing market data, segment analysis, competitive landscapes, industry trends, company developments, and strategic insights. Each report is carefully assessed to ensure that the findings are supported by reliable data, presented in a structured format, and aligned with the information needs of business decision-makers. Kimaya has research experience across healthcare, information technology, consumer goods, and several cross-industry domains.
Pratiksha K. is a Senior Research Analyst with more than five years of experience in market research, industry analysis, competitive intelligence, and business strategy. She has contributed to detailed market reports, customized research studies, company profiling, market sizing, trend analysis, and strategic consulting projects for clients across different regions. Her industry expertise covers Chemical and Material, Consumer Goods, Food & Beverages and Energy & Power. She closely evaluates changing customer requirements, technology developments, regulatory conditions, supply chain structures, investment activity, and competitive strategies to provide clear and practical market insights.
Frequently Asked Questions
Related Reports
More in Food and Beverages
Gourmet Food Market to Hit USD 1,033.1 Billion by 2035
Gourmet Food Market Size, Share, Analysis By Product (Cheese and Dairy, Gourmet Packaged Foods, Meat and Seafood, Bakery and Confectionery, Beverages, Other Products), By Distribution Channel (Supermarkets and Hypermarkets, Specialty Stores, Online and Direct-to-Consumer, Other Channels), By End Use (Household, Foodservice, Hospitality, Gifting), By Regional Insights, Business plan and Project Report, Investment Opportunities, Profitability, Industry Trends, Leading Companies and Growth Forecasts by 2026-2035
Refrigerated Ready Meals Market to Hit USD 355.8 Billion by 2035
Refrigerated Ready Meals Market Size, Share, Analysis By Product (Refrigerated Meals, Frozen Meals, Shelf-Stable Meals, Canned Meals), By Meal Type (Vegetarian, Non-Vegetarian, Vegan), By Distribution Channel (Supermarkets and Hypermarkets, Convenience Stores, Online Retail, Specialty Stores), By Regional Insights, Business plan and Project Report, Investment Opportunities, Profitability, Industry Trends, Leading Companies and Growth Forecasts by 2026-2035
Frozen Desserts Market to Hit USD 298.8 Billion by 2035
Frozen Desserts Market Size, Share, Analysis By Product (Ice Cream, Frozen Yogurt, Gelato, Sorbet, Frozen Cakes, Other Products), By Consumption (Retail Consumption, Foodservice Consumption), By Distribution Channel (Supermarkets and Hypermarkets, Convenience Stores, Specialty Stores, Online Retail), By Regional Insights, Business plan and Project Report, Investment Opportunities, Profitability, Industry Trends, Leading Companies and Growth Forecasts by 2026-2035
Frozen Meat and Seafood Market to Hit USD 181.1 Billion by 2035
Frozen Meat and Seafood Market Size, Share, Analysis By Product (Frozen Meat, Frozen Seafood), By Seafood Form (Whole, Fillets, Processed Seafood, Other Forms), By Seafood End Use (Retail and Household, Foodservice, Industrial), By Regional Insights, Business plan and Project Report, Investment Opportunities, Profitability, Industry Trends, Leading Companies and Growth Forecasts by 2026-2035