

Revenue, 2026
USD 115.8 Bn
Forecast, 2035
USD 181.1 Bn
CAGR, 2026-2035
5.1%
Report Coverage
Global
Market Size and Forecast
The Global Frozen Meat and Seafood Market was worth USD 115.8 billion in 2026 and is expected to reach USD 181.1 billion by 2035, growing at a CAGR of 5.1% from 2026 to 2035. North America held the largest regional share of 35.5% in 2026, valued at around USD 41.1 billion, supported by strong cold-chain infrastructure, high frozen food consumption, organized retail networks, and rising demand for convenient protein products.
The Frozen Meat and Seafood Market includes frozen beef, pork, poultry, lamb, fish, shrimp, crab, lobster, shellfish, and value-added frozen protein products. These products are widely used across households, restaurants, hotels, quick-service chains, institutional foodservice, and retail stores. Frozen formats help extend shelf life, reduce spoilage, maintain protein quality, and improve year-round product availability.
Market growth is being supported by rising demand for ready-to-cook meat and seafood, higher protein consumption, and growing preference for convenient meal solutions. Consumers are choosing frozen products because they are easy to store, portion-controlled, and suitable for quick meal preparation. Demand is also increasing for premium seafood, marinated meats, frozen poultry cuts, and sustainably sourced frozen protein products.
Key Parameter | Report Details |
|---|---|
Market Revenue, 2026 | USD 115.8 Billion |
Projected Revenue, 2035 | USD 181.1 Billion |
CAGR (2026-2035) | 5.1% |
Largest Region | North America (35.5%, USD 41.1 Bn) |
Fastest Growing Region | Asia Pacific |
Market Concentration | Medium |
Forecast Period | 2026-2035 |
North America is expected to remain a leading region due to its mature frozen food industry, strong supermarket presence, advanced refrigeration systems, and high demand from foodservice and household buyers. Regional growth is supported by busy lifestyles, online grocery expansion, and strong consumption of frozen poultry, beef, seafood, and prepared protein items. Long-term market growth will depend on cold-chain efficiency, product freshness, sustainable sourcing, price stability, and food safety compliance.
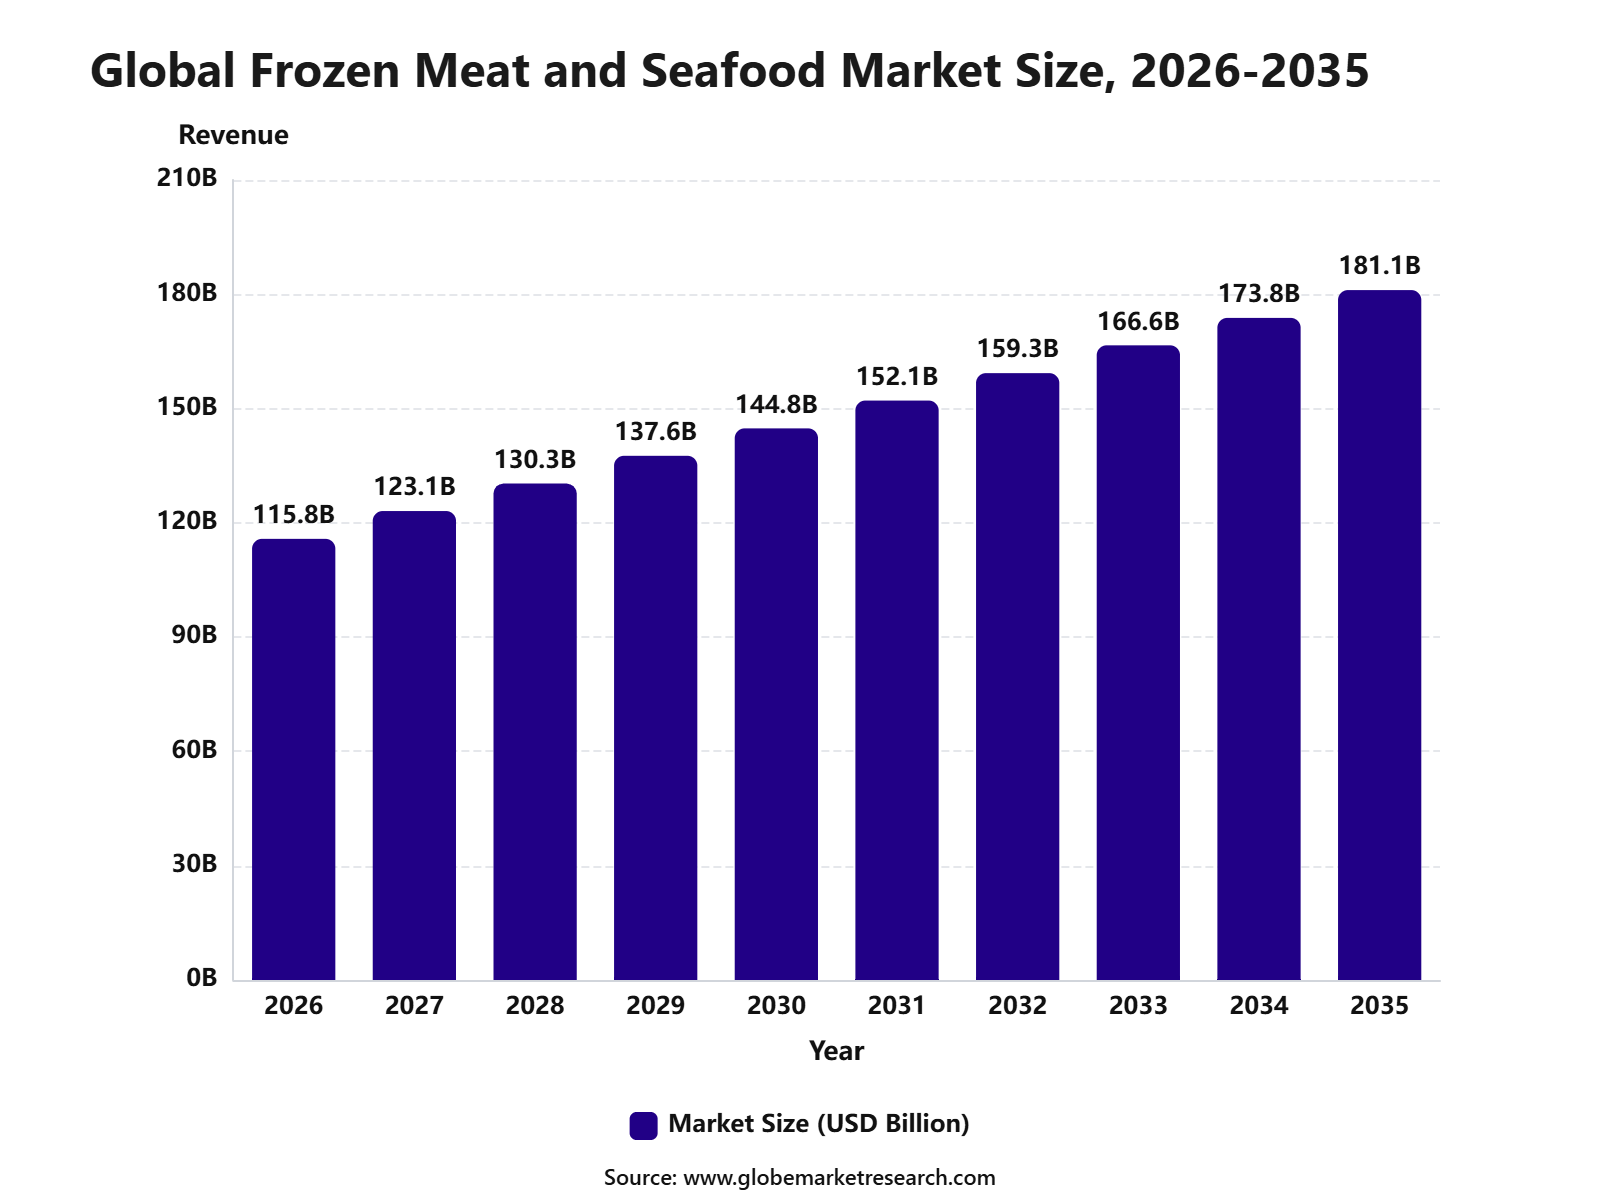 iThe graph shows projected market growth until 2035 based on CAGR analysis. Actual outcomes may vary depending on changing demand, competition, and economic factors.To gain greater insights - request a sample report PDF
Key Market Insights
Frozen meat led the product segment with 57.2% share, supported by longer shelf life, easy storage, bulk purchasing, and strong demand from households, restaurants, and foodservice buyers.
Processed seafood accounted for 43.2% share by seafood form, driven by rising demand for ready-to-cook, cleaned, portioned, and value-added seafood products.
Retail and household end use held 40.8% share, supported by growing consumer preference for convenient protein options, frozen packs, and easy meal preparation at home.
North America led the frozen meat and seafood market with 35.5% share, valued at USD 41.1 billion, supported by mature cold-chain infrastructure, high frozen protein consumption, strong retail availability, and demand for convenient meal solutions.
Top Funding and Investment
Top Investments
In February 2026, Smithfield Foods announced a USD 1.3 billion investment to build a pork processing plant in Sioux Falls, South Dakota, replacing its century-old facility. Scheduled to begin operations by the end of 2028, the plant will employ around 3,000 people and process approximately 20,000 hogs per day, supporting chilled and frozen pork production.
In October 2025, JBS announced a USD 70 million investment to acquire, modernize and expand the Pollos Amanecer poultry processing facility in Paraguay. The upgraded operation is expected to process 100,000 birds daily, employ approximately 1,100 people, expand from 19 to 139 poultry sheds and integrate farms, hatcheries and feed production.
In March 2025, East Coast Seafood installed high-pressure processing technology to expand its value-added seafood capabilities. The system supports longer shelf life, improved food safety and production of retail-ready lobster and seafood products without relying heavily on preservatives. The company did not publicly disclose the equipment investment amount.
In 2026, Safcol progressed a broader AUD 80 million manufacturing investment in Edinburgh, South Australia, designed to replace its existing Elizabeth operation and double production capacity. The company also opened an AUD 11 million seafood market featuring modern refrigeration, digital traceability and upgraded seafood-handling infrastructure.
In November 2025, Sunrise Logistics partnered with Hiperbaric to introduce high-pressure processing at its Pennsylvania logistics centre. The 453,077-square-foot facility includes approximately 360,000 square feet of cold-storage space, frozen-freight services, 89 loading docks and value-added packing capabilities for seafood, meat and other temperature-controlled foods.
Top Funding Developments
In July 2026, the U.S. Department of Agriculture launched the USD 500 million Strengthening Processing for U.S. Ranchers program. Funding is directed toward eligible small and medium-sized, U.S.-owned meat processors to maintain or increase cattle-processing capacity, strengthen competition and reduce further processing-plant closures.
In June 2025, seafood-processing technology company Shinkei Systems raised USD 22 million in Series A funding, bringing its total financing to approximately USD 30 million. The capital supports deployment of automated fish-harvesting and processing systems designed to improve seafood quality, extend freshness, reduce waste and strengthen domestic processing capacity.
In May 2026, Oshi secured USD 3 million from a Latin American seafood company. The financing supports expansion of its whole-cut fish alternatives, broader commercial distribution and development of additional seafood products, including whitefish formats suitable for refrigerated and frozen retail channels.
Top Acquisitions
In July 2025, Mitsubishi Corporation, through Cermaq Group, agreed to acquire Grieg Seafood’s farming businesses in Norway’s Finnmark and British Columbia and Newfoundland in Canada for NOK 10.2 billion, approximately USD 988 million. The acquired farms are expected to increase Cermaq’s annual salmon production from around 200,000 tonnes to 280,000 tonnes by fiscal 2027, expanding raw-material supply for processed and frozen salmon products.
In June 2025, High Liner Foods agreed to acquire the Mrs. Paul’s and Van de Kamp’s frozen seafood brands from Conagra Brands for USD 55 million, including approximately USD 36 million of inventory. High Liner acquired the brands, associated frozen breaded and battered fish products, inventories and related commercial rights.
By Product
Frozen meat accounted for 57.2% share of the Frozen Meat and Seafood Market. This leading position is supported by strong demand for longer-shelf-life protein products across households, supermarkets, foodservice outlets, and institutional buyers.
The segment is widely preferred because frozen meat helps preserve freshness, texture, taste, and nutritional value while reducing spoilage risk. It is commonly used in beef, chicken, pork, lamb, processed meat cuts, ready-to-cook meat products, and bulk foodservice supply.
Demand is expected to remain strong as consumers continue to seek convenient protein options that are easy to store and prepare. Growth will be supported by retail frozen meat packs, quick-service restaurants, cold-chain expansion, and rising demand for ready-to-cook meat products.
By Seafood Form
Processed seafood accounted for 43.2% share of the Frozen Meat and Seafood Market. This leading share is supported by rising demand for cleaned, cut, marinated, breaded, seasoned, and ready-to-cook seafood products.
The segment is widely preferred because processed seafood reduces preparation time and improves convenience for both household and foodservice users. Products such as frozen fish fillets, shrimp, crab products, seafood mixes, nuggets, and value-added seafood packs are gaining strong retail visibility.
Demand is expected to remain steady as consumers seek convenient seafood options with consistent quality and longer storage life. Growth will be supported by frozen seafood innovation, premium seafood packs, ready meals, and stronger cold-chain distribution.
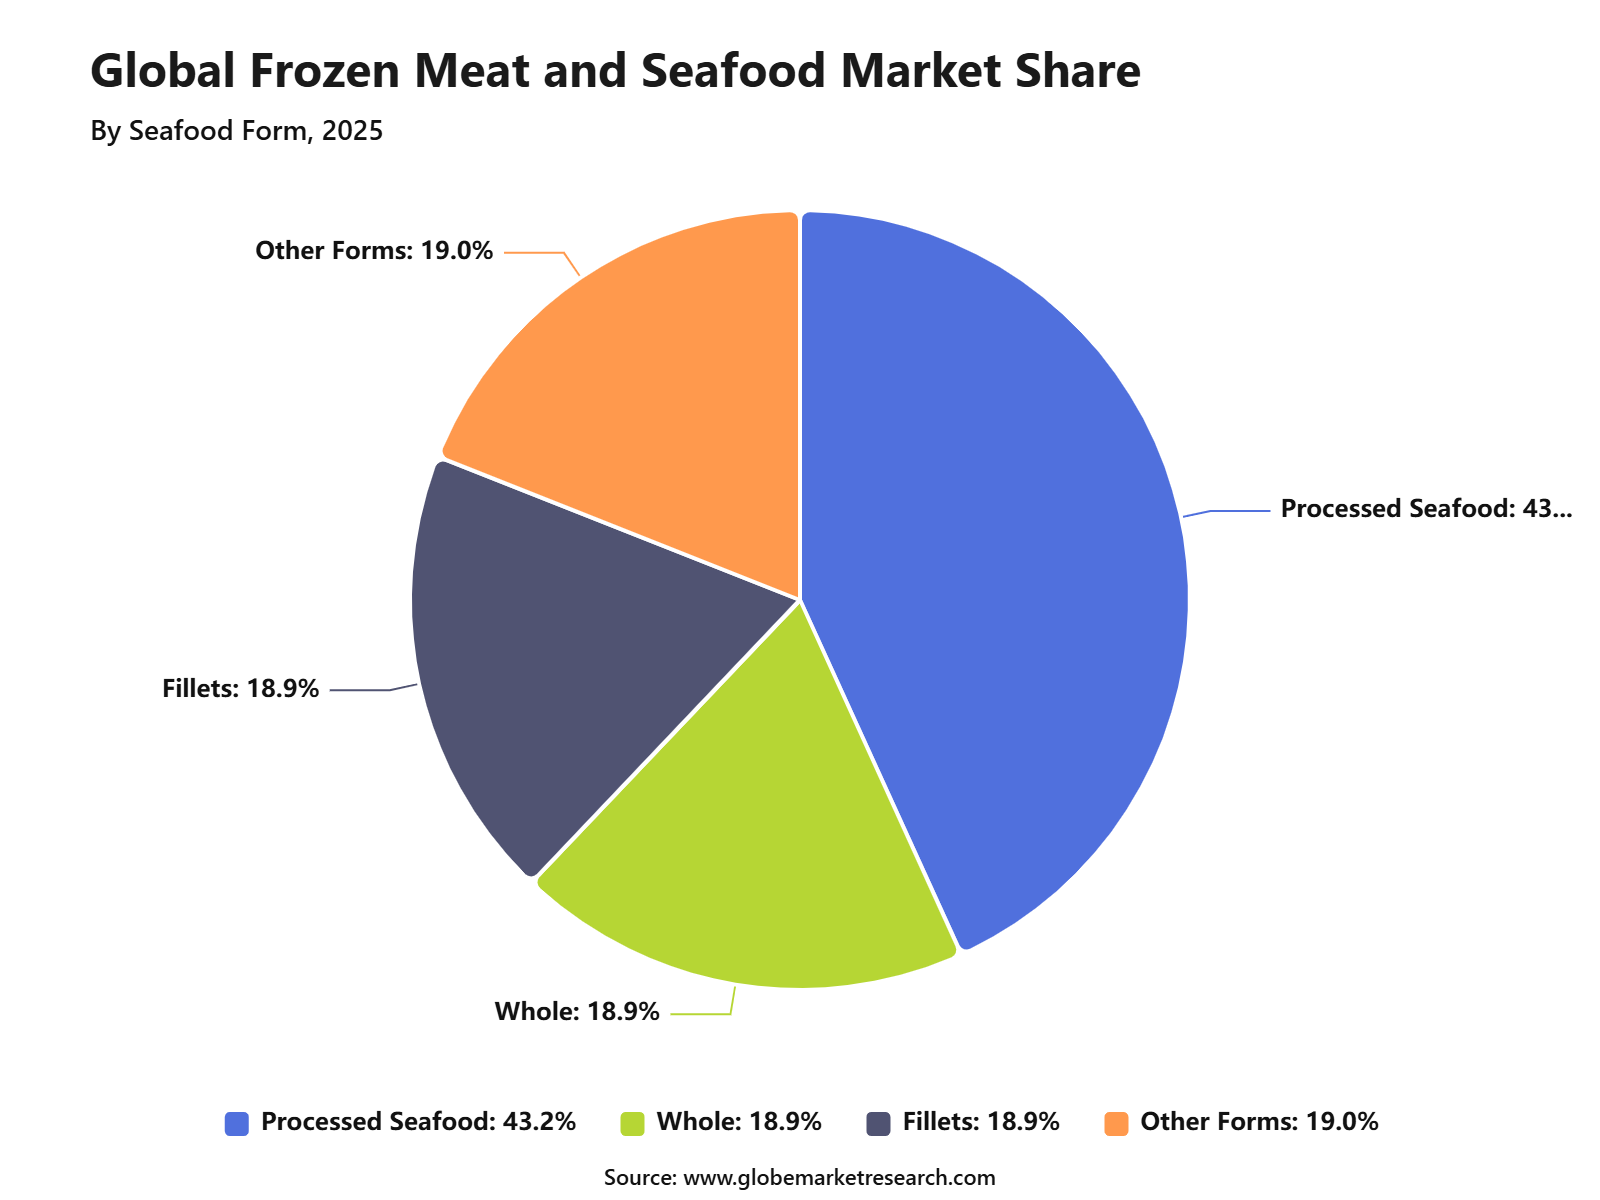 iThe graph shows projected market growth until 2035 based on CAGR analysis. Actual outcomes may vary depending on changing demand, competition, and economic factors.To gain greater insights - request a sample report PDF
By Seafood End Use
Retail and household end use accounted for 40.8% share of the Frozen Meat and Seafood Market. This dominance is driven by strong consumer purchases through supermarkets, hypermarkets, convenience stores, specialty stores, and online grocery platforms.
Households prefer frozen meat and seafood because these products offer convenience, portion control, longer shelf life, and reduced food waste. They are useful for daily cooking, meal planning, quick dinners, weekend meals, and bulk purchasing.
Demand from retail and household users is expected to remain strong as consumers continue to stock frozen protein products at home. Growth will be supported by family packs, single-serve portions, processed seafood, frozen meat cuts, and wider availability through modern retail channels.
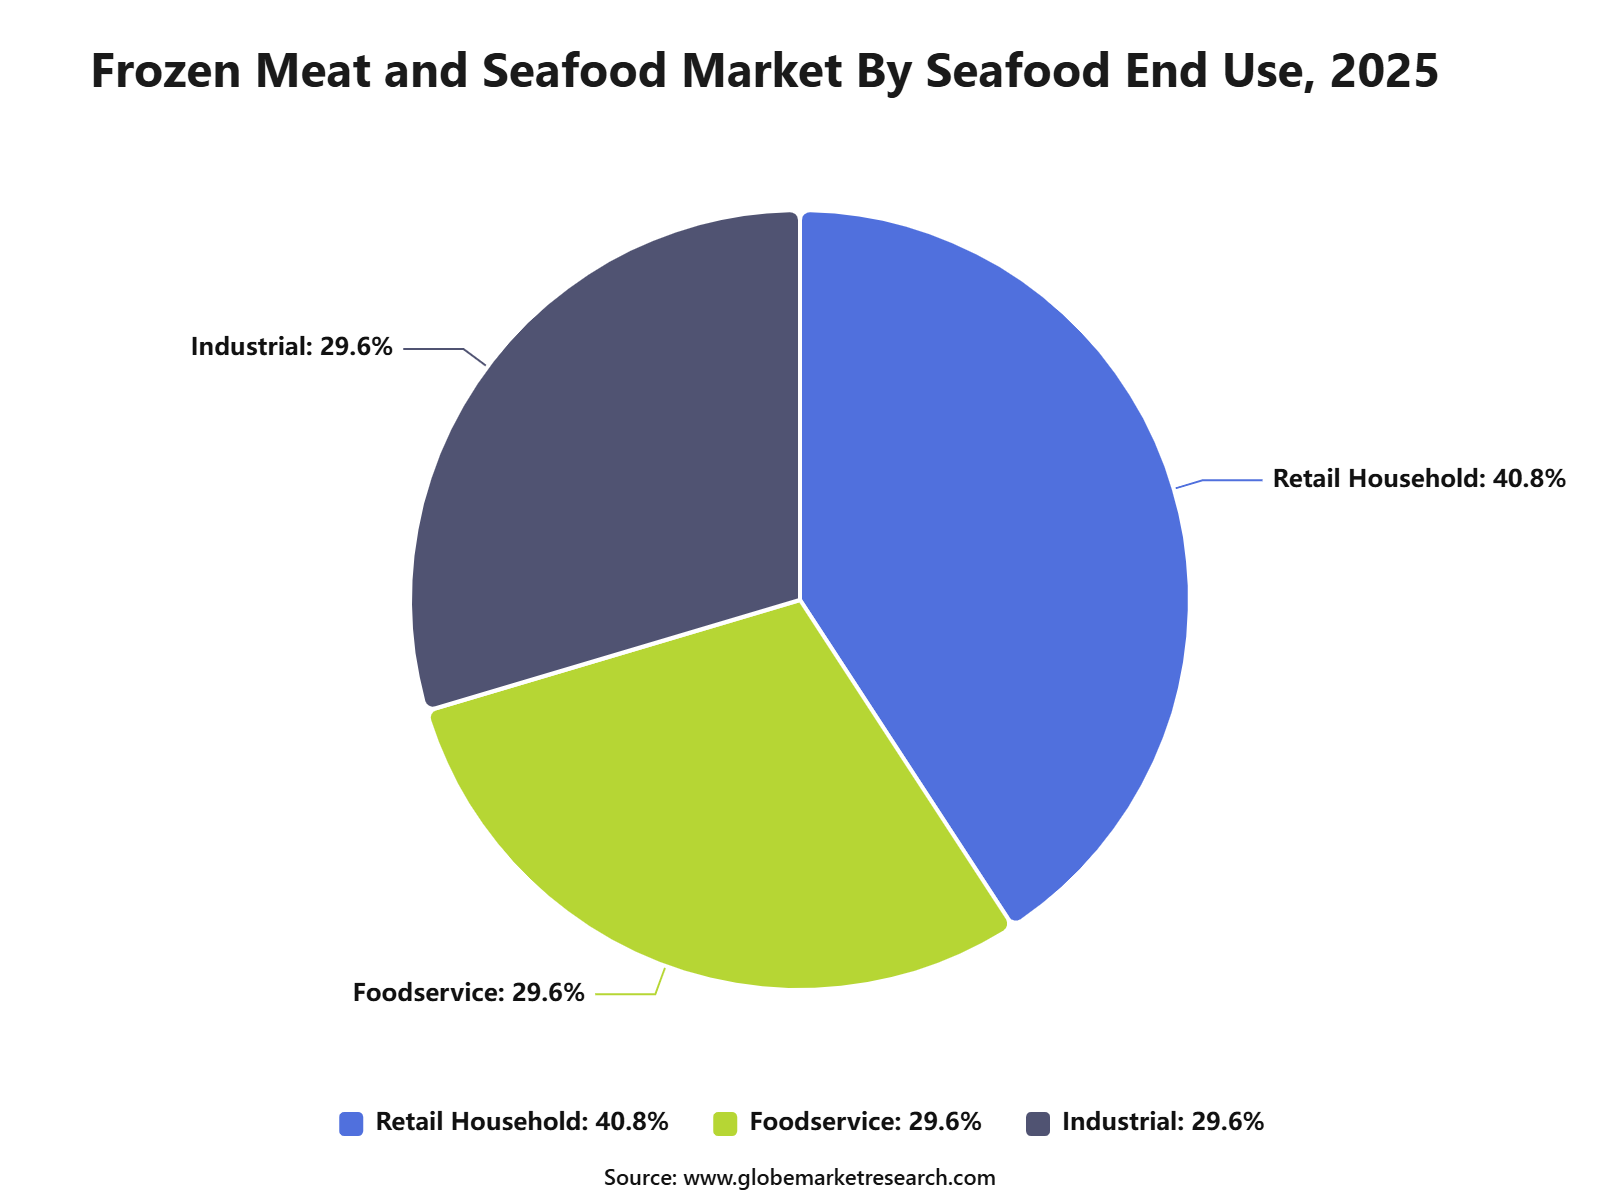 iThe graph shows projected market growth until 2035 based on CAGR analysis. Actual outcomes may vary depending on changing demand, competition, and economic factors.To gain greater insights - request a sample report PDF
By Region
North America accounted for 35.5% share of the Frozen Meat and Seafood Market, reaching USD 41.1 billion. The region’s leadership is supported by high protein consumption, established frozen food retail networks, strong cold-chain infrastructure, and mature supermarket distribution.
The United States and Canada are key contributors to regional demand. The region benefits from strong household freezer penetration, busy lifestyles, demand for convenient meals, and wide availability of frozen meat, processed seafood, and ready-to-cook protein products.
North America is expected to maintain a strong position as consumers continue to prefer convenient, safe, and longer-lasting protein options. Demand will remain supported by frozen meat, processed seafood, retail and household consumption, and continued innovation in value-added frozen protein products.
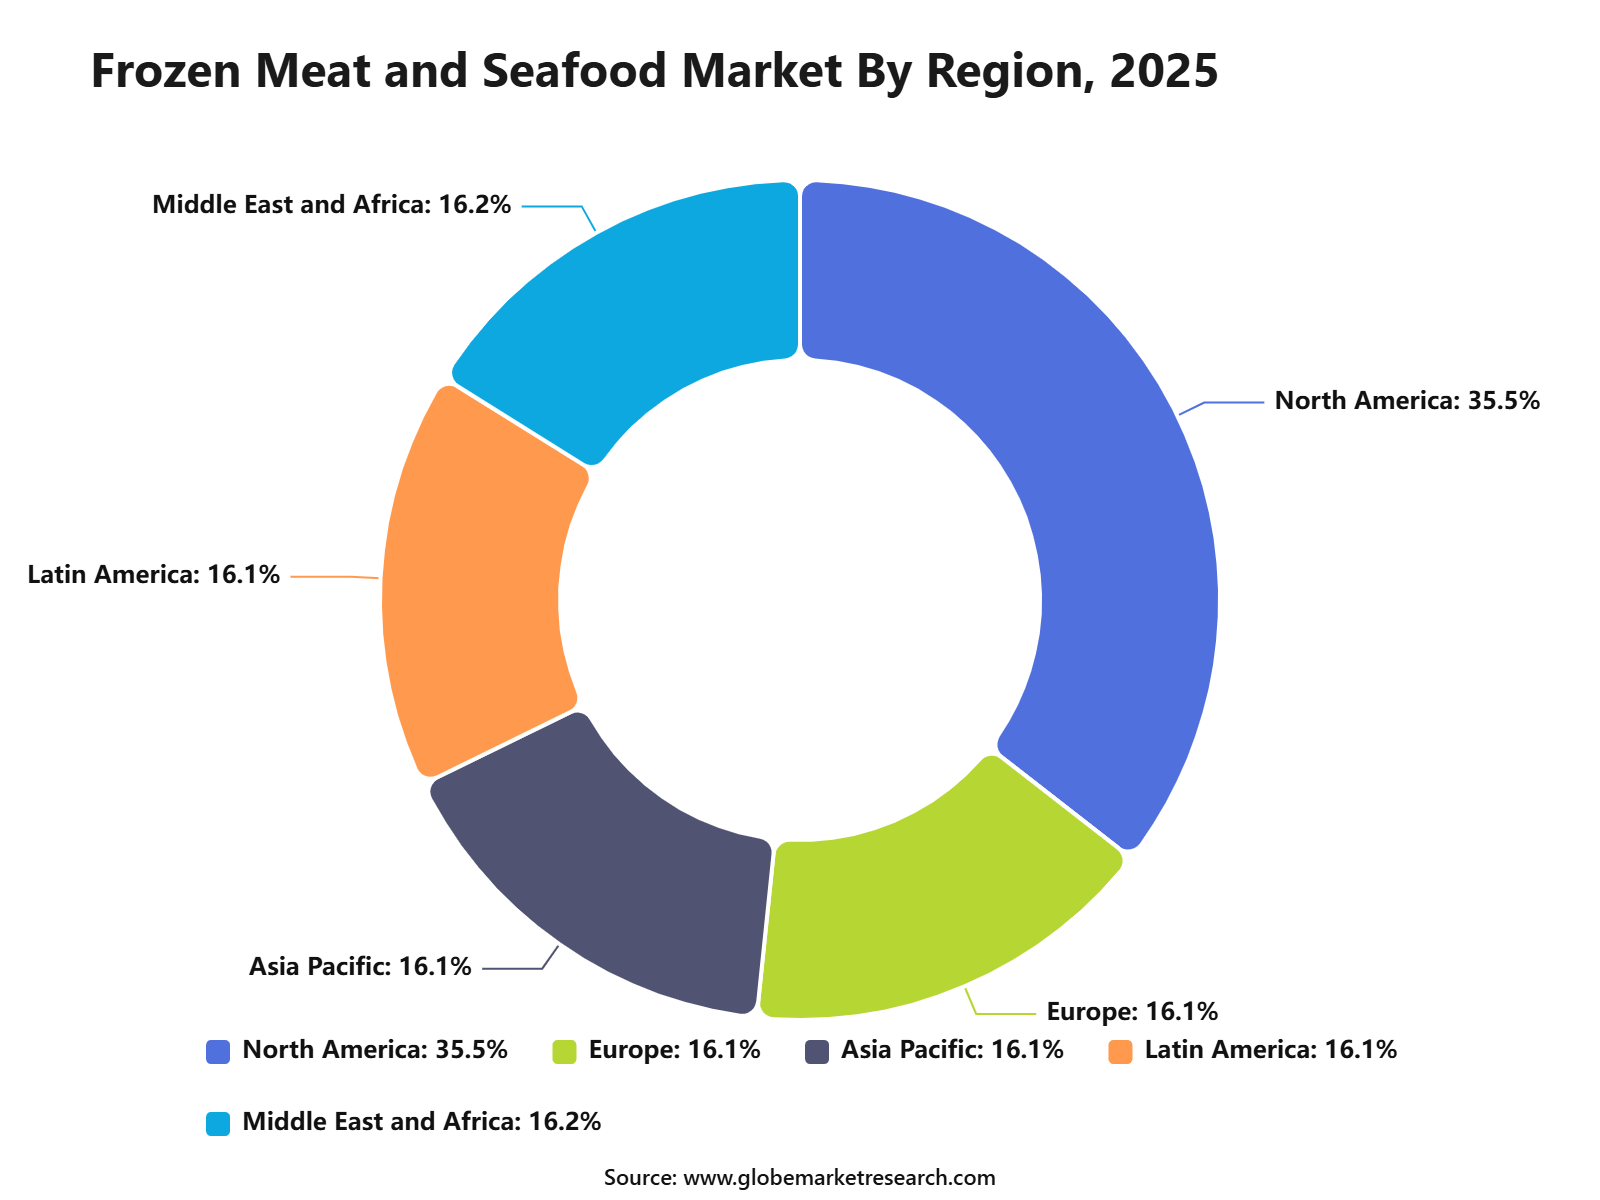 iThe graph shows projected market growth until 2035 based on CAGR analysis. Actual outcomes may vary depending on changing demand, competition, and economic factors.To gain greater insights - request a sample report PDF
Regional Impact Analysis
North America leads the Frozen Meat and Seafood Market with 35.5% share in 2026, valued at around USD 41.1 billion, supported by strong frozen protein consumption, developed cold-chain logistics, mature retail freezer sections, and large meat and seafood processing capacity. The U.S. remains the main contributor due to strong household, retail, and foodservice demand.
Europe remains important because of premium seafood consumption, strict food safety standards, and demand for convenient frozen protein products. Asia Pacific supports future growth through rising seafood intake, urbanization, modern grocery formats, and expanding frozen food infrastructure.
Impact Factor | Estimated CAGR Impact | Regional Relevance | Market Impact |
|---|---|---|---|
North America market leadership | +1.7% | North America, 35.5% share in 2026 | Leads global value demand. |
U.S. frozen protein consumption | +1.3% | U.S. | Drives major regional revenue. |
Canada seafood and meat retail demand | +0.9% | Canada | Supports steady growth. |
Europe premium frozen seafood demand | +0.8% | UK, Germany, France, Spain, Italy | Adds value-led product demand. |
Asia Pacific cold-chain expansion | +0.7% | China, India, Japan, Southeast Asia | Builds future market growth. |
Go-To-Market and Sales Economics
Frozen meat and seafood suppliers should segment customers across supermarkets, food-service distributors, restaurants, processors, and online grocery channels. Product offers should be organized by species, cut, pack size, certification, and preparation convenience. U.S. red meat and poultry availability is projected to reach 227 pounds per person in 2026, supporting broad retail and institutional demand.
Direct account management is suitable for major retailers and food-service groups requiring stable volumes, private-label production, traceability, and scheduled deliveries. Regional distributors can serve independent stores and restaurants with mixed cartons and lower minimum orders. FAO reported that global aquatic-product trade increased 2.1% by volume and 5% by value during 2025.
Pricing should reflect product yield, glazing levels, processing format, freight, storage, and seasonal availability rather than weight alone. Supply contracts can include price-adjustment clauses linked to feed, fuel, catch volumes, and livestock costs. USDA expects U.S. beef and veal prices to rise 7.5% during 2026, increasing pressure on processors and retailers.
Risk Factors & Market Barriers
Cold-chain failure remains a major commercial risk because temperature variation can reduce texture, safety, shelf life, and saleable yield. Exporters and distributors require validated freezing, storage, monitoring, and transport systems. Financial exposure includes rejected loads, insurance claims, recalls, and inventory losses, particularly for high-value seafood and portion-controlled meat products moving across long international routes.
Trade compliance has become more demanding for seafood suppliers entering the United States. From January 1, 2026, products from foreign fisheries without required NOAA comparability findings became ineligible for import. Other shipments sharing origin and tariff classifications with restricted products may require admissibility certification, adding documentation, supplier-verification, and customs-management costs.
Biological supply conditions can reduce availability and disrupt purchasing plans. Disease outbreaks, fishery closures, weather events, quotas, and feed-price movements may affect output and product specifications. NOAA reported that the U.S. Gulf shrimp harvesting industry had lost USD 268 million in revenue since 2021, demonstrating the financial impact of prolonged competitive and operating pressures.
Revenue Potential Analysis
Revenue Landscape Across
Asia provides the largest production and sourcing base for frozen seafood. FAO reported in June 2026 that the region represented 76% of global aquatic-animal and algae production, generating 179 million tonnes in 2024. Nearly 130 million tonnes came from aquaculture, supporting export opportunities in shrimp, fish fillets, shellfish, and processed seafood products.
North America offers revenue through retail packs, food-service portions, private labels, and premium imported species. U.S. fish and seafood exports reached major destinations including China at USD 1.12 billion, Canada at USD 998.42 million, and Japan at USD 771.51 million in 2025, demonstrating the importance of cross-border supply relationships.
China remains an important market for premium seafood and diversified international sourcing. In March 2026, the country removed an additional 25% tariff on Canadian lobster and snow crab. The change increased competition among Canadian, American, Vietnamese, and other exporters, making distributor access, pricing discipline, product authenticity, and digital retail visibility increasingly important.
Financial Impact
Frozen formats can protect revenue by extending storage time, supporting bulk purchasing, and reducing immediate dependence on daily fresh supply. Financial benefits are strongest when freezing, glazing, portioning, and packaging are optimized together. However, electricity, warehouse occupancy, inventory financing, and product shrink must be included when calculating the true contribution margin of each item.
Beef inflation may shift consumer and food-service demand toward poultry, pork, seafood, smaller portions, or blended meals. USDA forecasts 2026 beef and veal prices to rise 7.5%, while total pork production is expected to reach nearly 28 billion pounds, 1.4% above 2025. Flexible product portfolios can help suppliers protect volume and customer retention.
Compliance failures can directly affect revenue by blocking market access, delaying customs clearance, or requiring product redirection. Certain Philippine crab products became ineligible for U.S. entry from June 11, 2026, while specified fisheries in Indonesia, Sri Lanka, and Vietnam retained access. Diversified sourcing and fishery-level traceability can reduce concentration risk and interrupted sales.
Drivers Impact Analysis
The Frozen Meat and Seafood Market is driven by rising demand for convenient protein foods, longer shelf-life products, cold-chain retail growth, online grocery adoption, and higher consumption of poultry, beef, pork, fish, shrimp, and processed seafood. Frozen formats help reduce spoilage while supporting easy storage and meal preparation.
North America leads the market due to strong frozen food consumption, mature supermarket freezer infrastructure, large meat and seafood processing capacity, and high household freezer ownership. The U.S. remains the main regional contributor because frozen protein products are widely used across retail, foodservice, and household meal planning.
Impact Factor | Estimated CAGR Impact | Regional Relevance | Market Impact |
|---|---|---|---|
Rising demand for convenient protein foods | +1.6% | North America, Europe, Asia Pacific | Drives core frozen meat and seafood sales. |
Growth in cold-chain retail networks | +1.3% | U.S., Canada, Europe, China | Improves product access and quality. |
Higher seafood and poultry consumption | +1.1% | North America and Asia Pacific | Supports volume demand. |
Expansion of online grocery delivery | +0.9% | Developed digital retail markets | Increases frozen product reach. |
Demand for longer shelf-life proteins | +0.7% | Global retail and foodservice | Reduces waste and improves storage. |
Restraints Impact Analysis
The market faces restraints from cold-chain cost, product quality concerns, freezer burn, price volatility in meat and seafood, and consumer preference for fresh products in some markets. Frozen proteins require reliable temperature control across processing, storage, transport, retail, and home delivery.
Another restraint is sensitivity to supply disruption. Meat and seafood supply depends on livestock production, aquaculture output, fishing conditions, feed cost, fuel prices, labor availability, and import rules, which can affect pricing and supply stability.
Impact Factor | Estimated CAGR Impact | Regional Relevance | Market Impact |
|---|---|---|---|
High cold-chain logistics cost | -0.8% | Global frozen food supply chains | Raises operating expenses. |
Fresh meat and seafood preference | -0.7% | Premium and traditional retail markets | Limits frozen product conversion. |
Raw material price volatility | -0.6% | Meat, poultry, seafood processors | Pressures margins. |
Freezer burn and quality loss risk | -0.5% | Retail and home storage | Affects repeat purchase. |
Import and trade restrictions | -0.4% | Seafood and meat trade markets | Disrupts supply availability. |
Opportunities Impact Analysis
Opportunities are strong in frozen seafood, value-added meat products, marinated proteins, ready-to-cook frozen items, portion-controlled packs, high-protein meal solutions, and premium frozen fish and shrimp. These formats support both convenience and protein-rich eating trends.
Higher-value opportunities are emerging in sustainable seafood, traceable meat supply, vacuum-sealed frozen packs, IQF technology, online frozen protein subscriptions, and foodservice-ready frozen cuts. Companies that improve freshness perception, packaging, and supply transparency can capture stronger demand.
Impact Factor | Estimated CAGR Impact | Regional Relevance | Market Impact |
|---|---|---|---|
Value-added frozen meat products | +1.5% | North America and Europe | Builds higher-margin demand. |
Frozen seafood premiumization | +1.3% | U.S., Canada, Japan, Europe | Supports premium retail growth. |
Ready-to-cook frozen protein packs | +1.1% | Urban consumer markets | Improves household convenience. |
Sustainable and traceable seafood | +0.9% | Developed retail markets | Builds consumer trust. |
Online frozen protein delivery | +0.7% | North America and digital grocery | Expands direct-to-consumer access. |
Challenges Impact Analysis
The main challenge is maintaining taste, texture, and freshness after freezing, storage, thawing, and cooking. Meat and seafood are quality-sensitive, so poor freezing or temperature abuse can affect texture, moisture, color, and consumer satisfaction.
Another challenge is managing food safety and traceability. Frozen meat and seafood companies must control contamination risk, labeling accuracy, origin claims, allergen information, and cold-chain compliance across multiple markets.
Impact Factor | Estimated CAGR Impact | Regional Relevance | Market Impact |
|---|---|---|---|
Maintaining texture after thawing | -0.7% | Meat and seafood processors | Affects consumer acceptance. |
Temperature abuse during distribution | -0.6% | Retail and online grocery | Reduces quality and safety. |
Food safety compliance burden | -0.5% | Global processors and exporters | Raises operating requirements. |
Traceability and origin verification | -0.4% | Seafood and imported meat markets | Adds documentation needs. |
Private-label price competition | -0.3% | Supermarket channels | Limits branded pricing power. |
Cold Chain Drives Protein Demand
Cold-chain logistics remain the most important factor shaping the Frozen Meat and Seafood Market because frozen animal protein requires uninterrupted temperature control from processing to retail. According to the U.S. Department of Agriculture, U.S. beef and beef product exports reached approximately USD 10.45 billion, while pork and pork product exports exceeded USD 8.63 billion, highlighting the importance of refrigerated storage and international cold-chain infrastructure for global protein trade. These exports depend on efficient freezing, transportation and handling systems to maintain quality and food safety.
Seafood demand also continues to strengthen frozen food distribution. According to the National Oceanic and Atmospheric Administration (NOAA), the United States imported seafood valued at more than USD 31 billion, while commercial fishery landings generated over 8 billion pounds of seafood, demonstrating the scale of temperature-controlled processing and distribution required across the seafood supply chain. Continued investment in cold storage, traceability and logistics efficiency will remain essential for long-term market growth.
Important Data | Numeric Value |
|---|---|
U.S. Beef Export Value | USD 10.45 billion |
U.S. Pork Export Value | USD 8.63 billion |
U.S. Seafood Import Value | USD 31 billion |
Commercial Fishery Landings | 8 billion pounds |
Seafood Import Share of U.S. Consumption | About 80% |
Major Export Protein Categories | 2 |
Temperature-Control Requirement | Continuous Cold Chain |
Segment Covered in the Report
By Product
Frozen Meat
Frozen Seafood
By Seafood Form
Whole
Fillets
Processed Seafood
Other Forms
By Seafood End Use
Retail and Household
Foodservice
Industrial
By Region
North America
Europe
Asia Pacific
Latin America
Middle East and Africa
Market Trend Analysis
The market trend is moving toward premium frozen seafood, processed frozen meat, ready-to-cook protein packs, clean-label marinades, sustainable sourcing, and resealable packaging. Consumers want protein products that are convenient, safe, affordable, and easy to cook at home.
North America remains the largest value region because of strong frozen food acceptance, mature cold-chain systems, and high demand for frozen meat, poultry, fish, and seafood. Europe supports premium and sustainable products, while Asia Pacific grows through urbanization, modern retail, and seafood consumption.
Impact Factor | Estimated CAGR Impact | Regional Relevance | Market Impact |
|---|---|---|---|
Premium frozen seafood grows | +1.4% | North America, Europe, Japan | Supports higher-value product demand. |
Processed frozen meat demand rises | +1.2% | U.S., Canada, Europe | Adds convenience-led growth. |
Sustainable sourcing gains focus | +1.0% | Seafood and premium meat markets | Improves brand trust. |
Resealable and portion packaging expands | +0.8% | Retail frozen aisles | Improves household usability. |
Clean-label marinated proteins increase | +0.6% | Health-aware consumers | Supports better product positioning. |
Investor Type Impact Matrix
Investors should focus on companies with strong processing capacity, cold-chain reliability, retail distribution, food safety systems, product innovation, and sourcing control. Quality preservation, traceability, packaging, and price management are key success factors.
Strategic investors can also target frozen seafood processors, meat processing companies, cold-chain logistics firms, sustainable seafood suppliers, private-label frozen protein manufacturers, and packaging technology providers. Companies that combine convenience, protein quality, and reliable distribution are better positioned for long-term growth.
Investor Type | Estimated CAGR Impact | Regional Relevance | Market Impact |
|---|---|---|---|
Frozen Seafood Processors | +1.3% | North America, Europe, Asia Pacific | Expands premium frozen protein supply. |
Meat Processing Companies | +1.1% | Global retail and foodservice | Supports large-volume demand. |
Cold-Chain Logistics Providers | +0.9% | Frozen food supply chains | Improves market reach and quality control. |
Private-Label Protein Manufacturers | +0.7% | Supermarket and hypermarket channels | Supports value-based retail demand. |
Strategic Food Investors | +0.5% | Global packaged protein markets | Funds capacity, packaging, and innovation. |
Recent Developments
January 2026: Nissui agreed to fully acquire Chilean salmon producer Pesquera Yadran, a transaction expected to expand the group’s South American salmon aquaculture business 2.5-fold and strengthen integrated farming, processing, and sales capabilities.
August 2025: Bumble Bee Seafoods introduced Snackers, its first single-serve flavored tuna cans, offering six varieties designed for convenient meals and snacks without draining or mixing, and expanding the brand’s portable protein portfolio.
April 2025: Dongwon Industries approved a stock-swap restructuring to make Dongwon F&B wholly owned and delist it, supporting the planned integration of food affiliates and faster international expansion across tuna, seafood, and processed-food businesses.
Competitive Landscape
The market is characterized by intense competition among established players and emerging companies. Strategic partnerships, mergers and acquisitions, and product innovation are key strategies employed by market participants.
Key Market Players
JBS S.A.
Tyson Foods, Inc.
Cargill, Incorporated
Marfrig Global Foods S.A.
Mowi ASA
Thai Union Group PCL
Nippon Suisan Kaisha, Ltd.
Dongwon Industries Co., Ltd.
Bumble Bee Foods, LLC
High Liner Foods Incorporated
Other Key Players
Research Methodology
This market study is prepared using a combination of primary and secondary research. Primary research includes discussions with manufacturers, suppliers, distributors, consultants, industry experts, and end users. Secondary research covers company reports, government databases, trade associations, technical publications, regulatory sources, and trusted industry documents. The collected information is used to assess market demand, pricing trends, technology adoption, competitive activity, and regional performance.
AI language models are not used as primary data sources, and publicly available AI-generated content is not treated as market evidence. Computational tools may be used to support data processing, translation, data classification, and pattern identification. However, every published assessment is supported by verified sources, human review, and primary market discussions.
Market estimates are developed through top-down and bottom-up approaches and validated using data triangulation. Revenue, production, shipment, pricing, and application-level data are compared across multiple sources. Forecasts consider economic conditions, regulatory changes, investment activity, innovation, supply chain developments, and industry risks. All findings are reviewed through source verification and internal quality checks before publication.
Part I
Source Management & Input Data Standards
Who provides data, how sources are qualified, and what types of evidence are admissible.
Part II
Research Scope & Market Coverage
How we define the markets we assess and the parameters that govern each product.
Part III
Data Collection, Verification & Submission
The mechanics of gathering, cross-checking, and hierarchically ranking evidence.
Part IV
Assessment Determination & Quality Controls
How raw data becomes a published assessment — normalisation, expert judgement, and outlier exclusion.
Part V
Publication, Corrections & Revision
Our publication schedule, corrections policy, and methodology review cycle.
Part VI
Independence, Ethics & Complaints
Conflict-of-interest policies, editorial independence, and how clients raise concerns.
Google · Preferred Sources
Don't miss the latest market research insights and industry updates on Google.
Add Globe Market Research as a preferred source in the Google app to see our reports, analysis, and market stories in your news suggestions.
Meet the Team
This report was prepared by our expert analysts with deep industry knowledge and research experience.
Kimaya brings more than five years of experience in market research, content review, and industry analysis to Globe Market Research. She plays an important role in maintaining the accuracy, clarity, consistency, and relevance of research content across a wide range of industries. Her responsibilities include reviewing market data, segment analysis, competitive landscapes, industry trends, company developments, and strategic insights. Each report is carefully assessed to ensure that the findings are supported by reliable data, presented in a structured format, and aligned with the information needs of business decision-makers. Kimaya has research experience across healthcare, information technology, consumer goods, and several cross-industry domains.
Pratiksha K. is a Senior Research Analyst with more than five years of experience in market research, industry analysis, competitive intelligence, and business strategy. She has contributed to detailed market reports, customized research studies, company profiling, market sizing, trend analysis, and strategic consulting projects for clients across different regions. Her industry expertise covers Chemical and Material, Consumer Goods, Food & Beverages and Energy & Power. She closely evaluates changing customer requirements, technology developments, regulatory conditions, supply chain structures, investment activity, and competitive strategies to provide clear and practical market insights.
Frequently Asked Questions
Related Reports
More in Food and Beverages
Refrigerated Ready Meals Market to Hit USD 355.8 Billion by 2035
Refrigerated Ready Meals Market Size, Share, Analysis By Product (Refrigerated Meals, Frozen Meals, Shelf-Stable Meals, Canned Meals), By Meal Type (Vegetarian, Non-Vegetarian, Vegan), By Distribution Channel (Supermarkets and Hypermarkets, Convenience Stores, Online Retail, Specialty Stores), By Regional Insights, Business plan and Project Report, Investment Opportunities, Profitability, Industry Trends, Leading Companies and Growth Forecasts by 2026-2035
Frozen Desserts Market to Hit USD 298.8 Billion by 2035
Frozen Desserts Market Size, Share, Analysis By Product (Ice Cream, Frozen Yogurt, Gelato, Sorbet, Frozen Cakes, Other Products), By Consumption (Retail Consumption, Foodservice Consumption), By Distribution Channel (Supermarkets and Hypermarkets, Convenience Stores, Specialty Stores, Online Retail), By Regional Insights, Business plan and Project Report, Investment Opportunities, Profitability, Industry Trends, Leading Companies and Growth Forecasts by 2026-2035
Frozen Meals Market to Hit USD 74.2 Billion by 2035
Frozen Meals Market Size, Share, Analysis By Product (Frozen, Chilled, Canned, Shelf-Stable), By Meal Type (Vegetarian, Non-Vegetarian, Vegan), By Distribution Channel (Supermarkets and Hypermarkets, Online Retail, Convenience Stores, Specialty Stores), By Regional Insights, Business plan and Project Report, Investment Opportunities, Profitability, Industry Trends, Leading Companies and Growth Forecasts by 2026-2035
Food Colorants Market to Hit USD 8.6 Billion by 2035
Food Colorants Market Size, Share, Analysis By Type (Natural, Synthetic, Nature-Identical), By Form (Powder, Liquid, Gel), By Application (Beverages, Bakery and Confectionery, Dairy, Meat Products, Snacks, Other Applications), By Regional Insights, Business plan and Project Report, Investment Opportunities, Profitability, Industry Trends, Leading Companies and Growth Forecasts by 2026-2035