

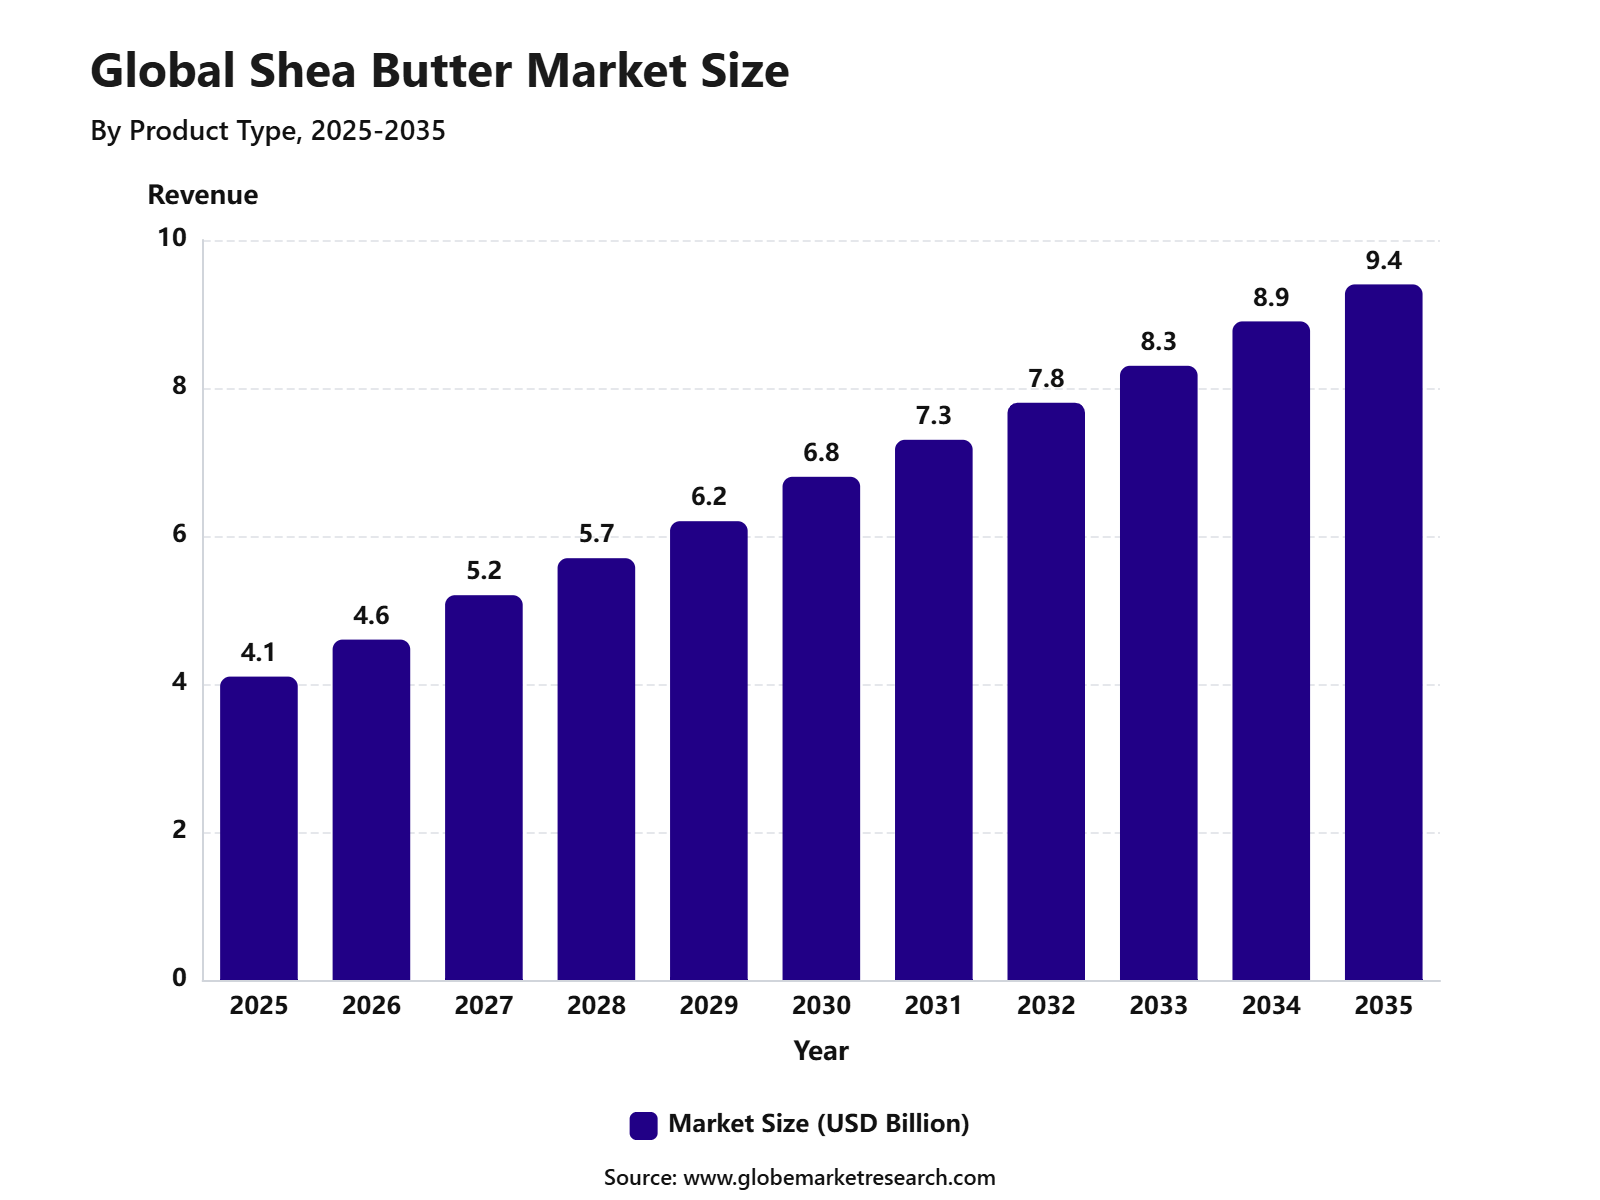
Revenue, 2025
$4.1Bn
Forecast, 2035
$9.4Bn
CAGR, 2025-2035
8.6%
Report Coverage
Global
Market Size and Forecast
The Global Shea Butter Market reached USD 4.1 billion in 2025 and is expected to grow to USD 9.4 billion by 2035, registering a CAGR of 8.6% from 2025 to 2035. Europe held the largest regional share of 35.4% in 2025, driven by strong demand for natural, plant-based, and ethically sourced ingredients across cosmetics, personal care, food, and pharmaceutical applications. Growth in the region is also supported by increasing consumer preference for clean-label beauty products, moisturizing skin care formulations, and sustainable raw materials.
The growth of the shea butter market can be attributed to its wide use in skin care, hair care, confectionery, bakery, and medicinal products. Shea butter is valued for its moisturizing, emollient, anti-inflammatory, and skin-protective properties, making it a preferred ingredient in lotions, creams, lip balms, soaps, conditioners, and body butters. Rising awareness of natural ingredients and growing demand for organic personal care products are further supporting market expansion.
 iThe graph shows projected market growth until 2035 based on CAGR analysis. Actual outcomes may vary depending on changing demand, competition, and economic factors.To gain greater insights - request a sample report PDF
Key Market Insights
Raw or unrefined shea butter led the product type segment with 65.4% share, supported by strong demand for natural, minimally processed, and nutrient-rich ingredients.
Organic shea butter accounted for 64.5% share by nature, driven by rising consumer preference for clean-label, chemical-free, and sustainably sourced personal care ingredients.
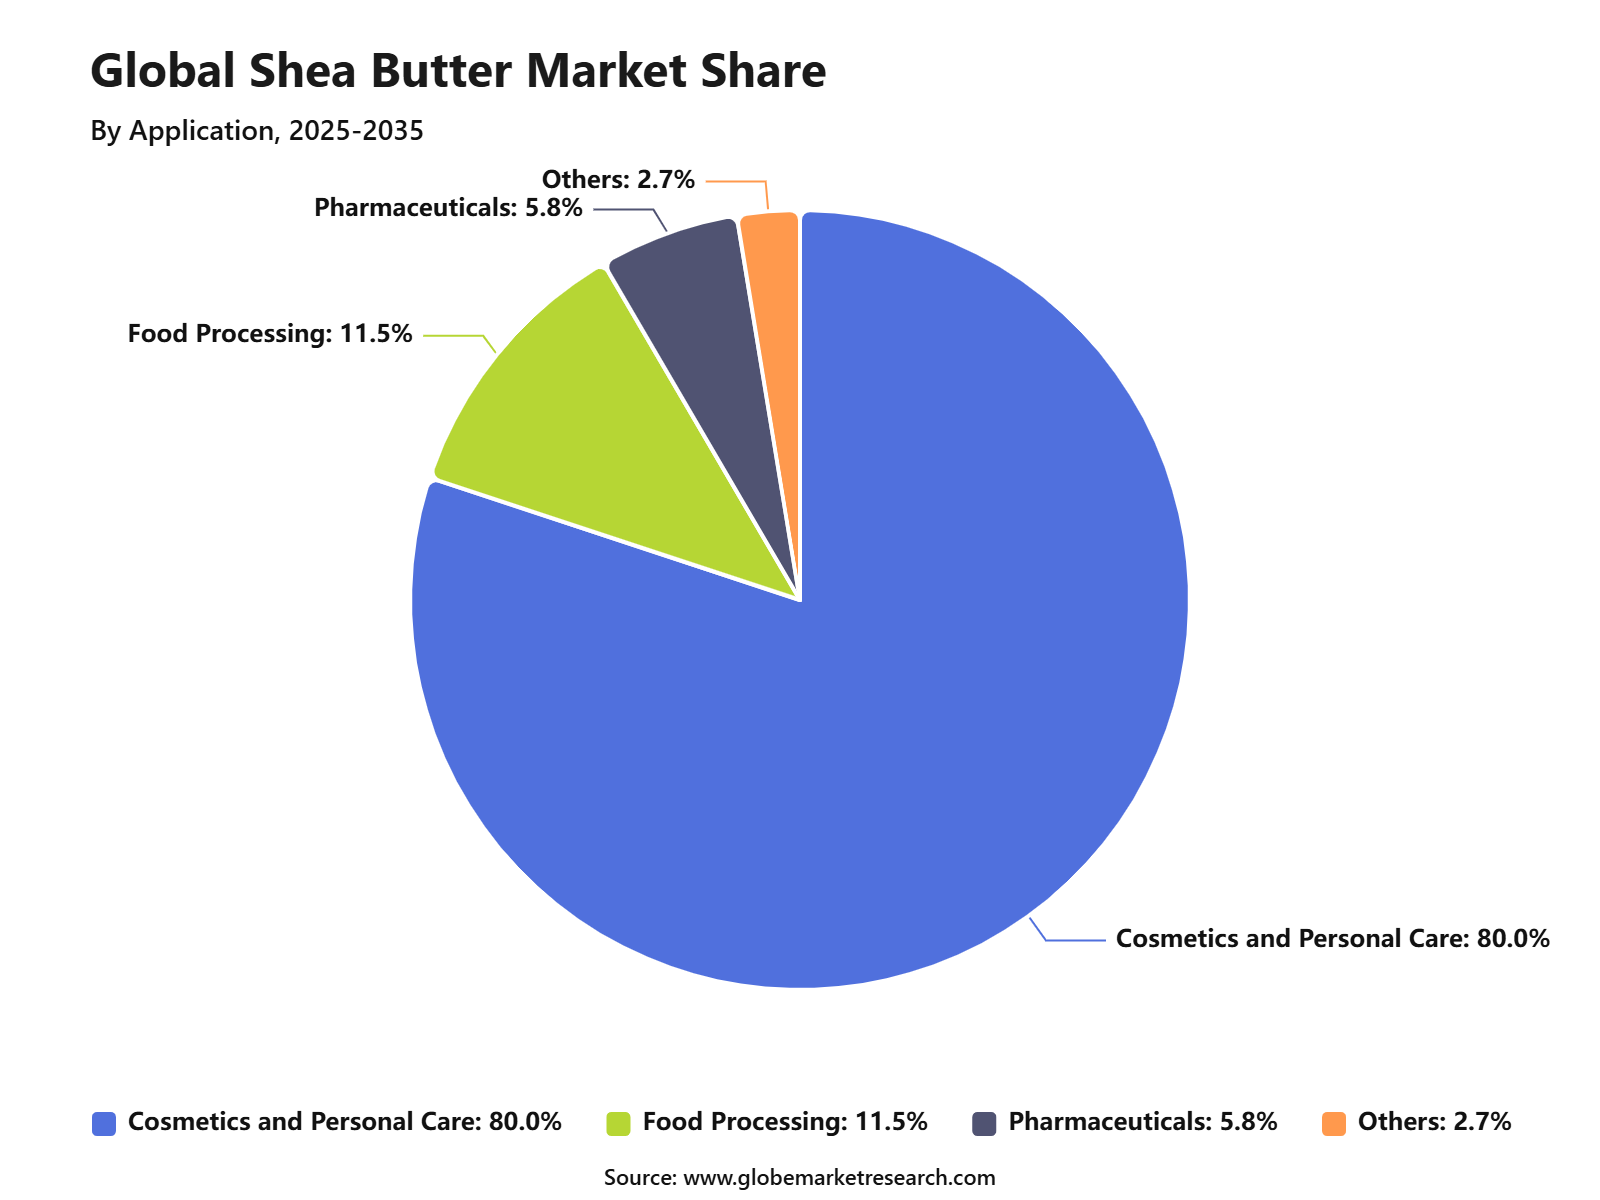
Cosmetics and personal care dominated the application segment with 81.6% share, supported by wide use in moisturizers, body butters, lip balms, hair care products, soaps, and skincare formulations.
Indirect sales held 77.1% share by distribution channel, supported by strong sales through wholesalers, distributors, supermarkets, beauty stores, and online retail platforms.
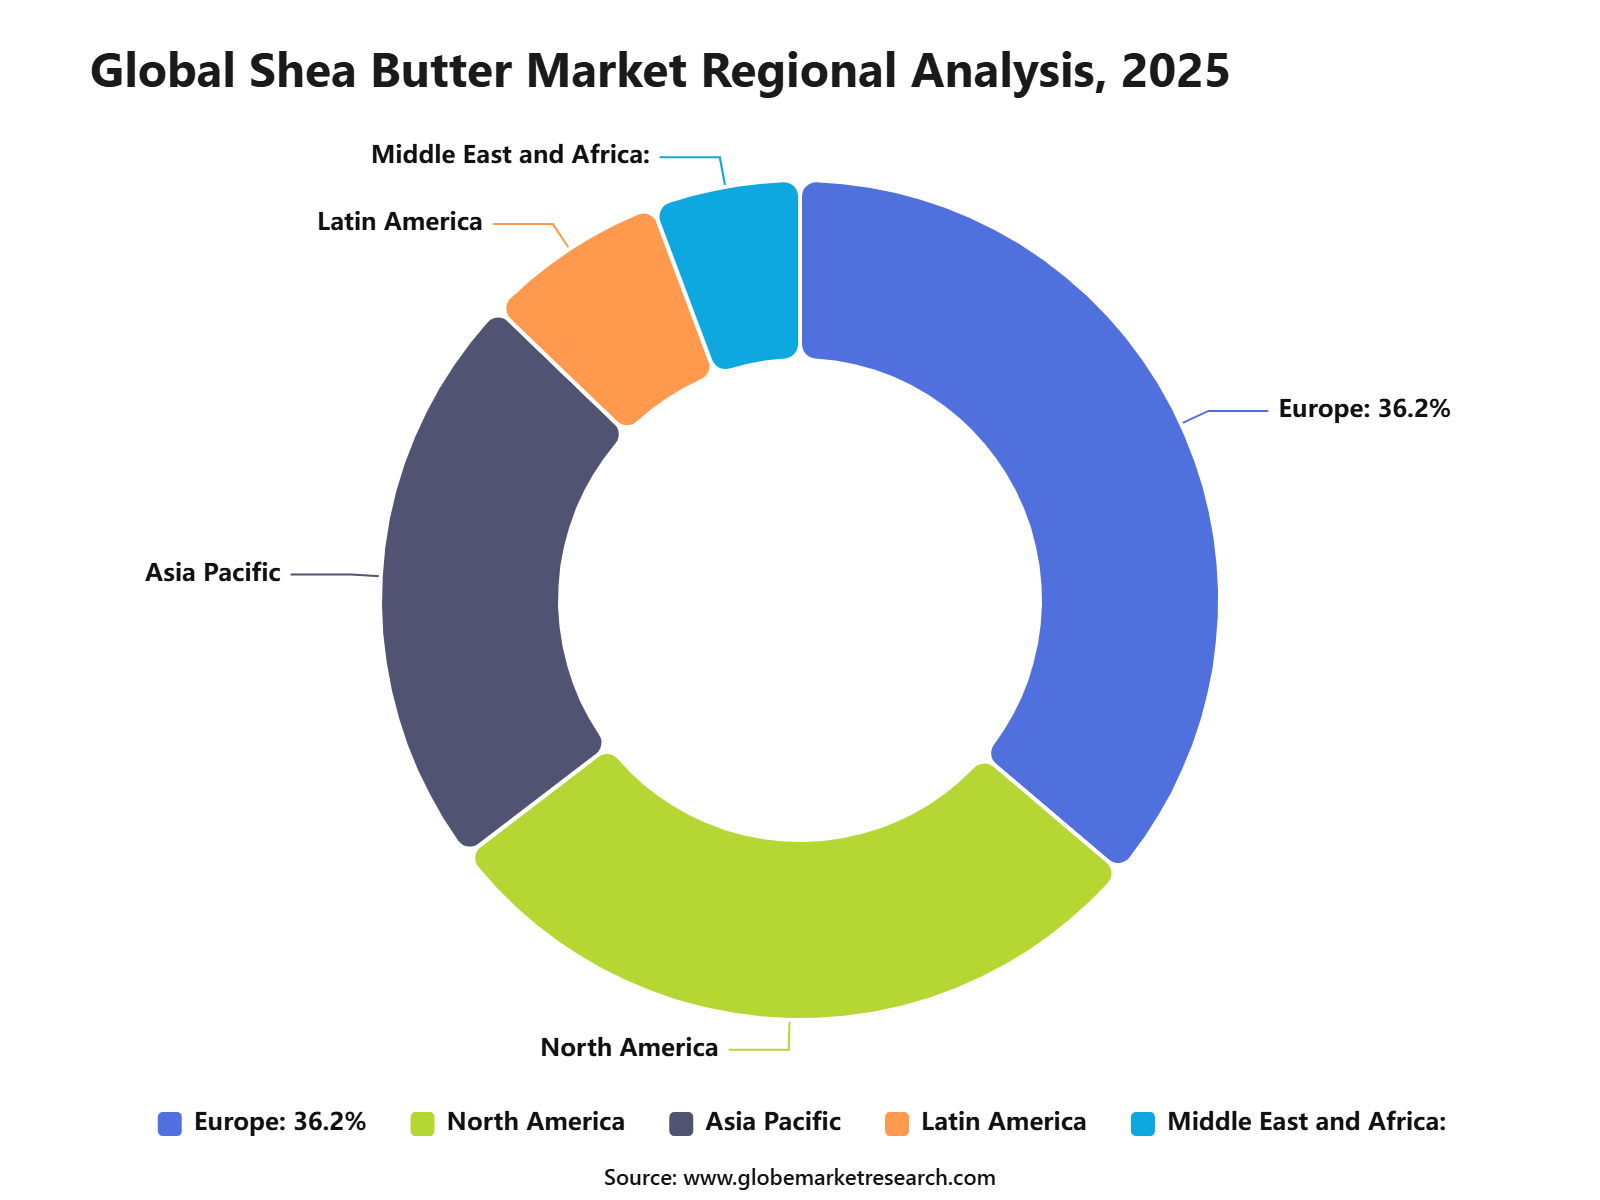
Europe led the shea butter market with 36.2% share, supported by strong demand for natural cosmetics, organic skincare products, and premium personal care formulations.
Go-to-Market and Sales Economics Strategy
The Shea Butter Market needs a quality-led and sourcing-led go-to-market strategy because buyers are focused on purity, traceability, grade consistency, texture, odor, color, and ethical sourcing. Suppliers should separate offerings for cosmetics, personal care, food, confectionery, soaps, hair care, baby care, and pharmaceutical-style topical products. Unrefined shea butter can be positioned for natural and traditional formulations, while refined shea butter, shea olein, and shea stearin are better suited for large-scale cosmetic and food manufacturers that need stable quality and controlled odor.
Sales economics are strongest when shea butter is sold as a value-added ingredient rather than only as a raw commodity. The Global Shea Alliance states that nearly 2 billion shea trees grow naturally across parklands in 21 African countries, while 16 million rural women collect fresh shea fruits and kernels for processing. More than half of shea exports are now processed in West Africa as shea butter, shea stearin, and shea olein, which supports better local value addition and stronger supplier margins.
 iThe graph shows projected market growth until 2035 based on CAGR analysis. Actual outcomes may vary depending on changing demand, competition, and economic factors.To gain greater insights - request a sample report PDF
Product Type Analysis
Raw and unrefined shea butter led the Shea Butter Market with 65.4% share, supported by rising demand for natural, minimally processed, and nutrient-rich ingredients. This product type is preferred in skincare, haircare, soaps, balms, body butters, and wellness formulations because it keeps more of its natural texture, aroma, and composition compared with refined alternatives.
The growth of this segment can be attributed to stronger consumer preference for clean-label and plant-based personal care products. Raw and unrefined shea butter is widely used by cosmetic brands, handmade product manufacturers, and natural skincare companies that want to offer products with traditional sourcing and visible ingredient authenticity.
Nature Analysis
Organic shea butter accounted for 64.5% share, supported by rising demand for certified, chemical-free, and ethically sourced cosmetic ingredients. Consumers are increasingly choosing organic skincare products because they are seen as safer, more natural, and better aligned with sustainability-focused purchasing behavior.
The segment is also supported by premium beauty brands that use organic shea butter in moisturizers, lip balms, body lotions, hair conditioners, baby care products, and repair creams. Demand is expected to remain strong as buyers continue to value traceability, certification, responsible sourcing, and ingredient transparency.
Application Analysis
Cosmetics and personal care led the application segment with 81.6% share, driven by the strong use of shea butter in moisturizers, creams, lotions, lip care, haircare, soaps, sunscreens, and body care products. Shea butter is valued for its emollient texture, skin-softening properties, and ability to support hydration in dry-skin and haircare formulations.
The growth of this segment is being supported by rising demand for natural ingredients in daily-use beauty products. Cosmetics and personal care manufacturers are using shea butter to improve product feel, enhance moisturization claims, and meet consumer demand for plant-based and ethically sourced formulations.
 iThe graph shows projected market growth until 2035 based on CAGR analysis. Actual outcomes may vary depending on changing demand, competition, and economic factors.To gain greater insights - request a sample report PDF
Distribution Channel Analysis
Indirect sales led the Shea Butter Market with 77.1% share, supported by strong distribution through wholesalers, retailers, specialty stores, supermarkets, pharmacies, beauty stores, and online platforms. This channel helps manufacturers reach a wider customer base across personal care, cosmetics, food, and specialty ingredient markets.
The segment is growing because many buyers prefer easy access to packaged shea butter products, branded skincare items, and ready-to-use formulations through retail and e-commerce channels. Indirect sales also help smaller producers and brands expand market reach through distributors, marketplaces, and beauty retail networks.
Regional Analysis
Europe held the leading position in the Shea Butter Market with 36.2% share, supported by strong cosmetics consumption, high demand for natural personal care ingredients, and wider adoption of organic and ethically sourced beauty products. The region has a mature beauty and personal care industry with strong demand for moisturizers, haircare products, lip care, baby care, and premium skincare formulations.
The growth of the European market is also supported by consumer preference for transparent labeling, sustainable sourcing, and plant-based ingredients. Demand is expected to remain strong as beauty brands continue to use shea butter in clean beauty, natural skincare, vegan formulations, and premium personal care products.
 iThe graph shows projected market growth until 2035 based on CAGR analysis. Actual outcomes may vary depending on changing demand, competition, and economic factors.To gain greater insights - request a sample report PDF
Revenue Potential Analysis
Revenue Landscape Across
The revenue landscape for shea butter is spread across cosmetics, skin care, hair care, soaps, lip care, baby care, body lotions, natural balms, food processing, confectionery fats, and cocoa butter equivalents. Cosmetics and personal care remain highly attractive because shea butter is widely recognized as a moisturizing and conditioning ingredient. Demand is supported by clean-label beauty, natural hair care, body care, and products designed for dry skin and textured hair.
Food and confectionery applications offer another important revenue path, especially through shea stearin and shea olein. Ghana is identified by CBI as the largest shea processor and exporter, supported by road infrastructure, seaports, shea collectors, traders, exporters, crushing plants, and fractionation capacity. This gives Ghana and other West African processors a stronger position in value-added exports than countries that mainly export raw shea nuts.
Financial Impact
The financial impact can be positive for suppliers that move from raw nut trading to processed shea butter, fractionated shea, certified ingredients, and buyer-specific grades. Better margins can be achieved when processors offer refined shea butter, organic-certified shea, fair-trade shea, food-grade stearin, cosmetic-grade butter, and consistent bulk supply. Companies that support women-led sourcing networks and provide quality documentation can also attract premium beauty and personal care buyers.
Financial risk remains high for producers that depend on volatile raw nut supply, weak storage systems, manual processing, poor traceability, and limited access to working capital. A strong financial model should include local processing, cooperative training, moisture control, quality testing, export documentation, and diversified buyers across cosmetics and food. The Global Shea Alliance reported that its 2024 activities reached 64,351 women and facilitated USD 174,722 in commercial loans for women cooperatives, showing how finance and capacity building remain important to supply-chain stability.
Market Adoption Barriers
Market adoption barriers are mainly linked to quality consistency, price sensitivity, certification cost, and buyer trust. Many cosmetic and food manufacturers want natural and traceable ingredients, but they also require stable supply, clean odor, consistent color, low impurities, and reliable shipment volumes. Small cooperatives and processors may face difficulty meeting large buyer requirements if they lack equipment, quality testing, documentation, storage, and export compliance support.
Adoption is also affected by competition from cocoa butter, palm-based fats, mango butter, kokum butter, sal butter, synthetic emollients, and other plant-based cosmetic ingredients. In personal care, shea butter has strong consumer recognition, but finished product brands still compare it with lower-cost oils and butters. In food applications, the adoption of shea stearin depends on cocoa butter prices, chocolate labeling rules, melting profile, and the ability to maintain taste and texture without damaging brand positioning.
Market Trend Analysis
Impact Factor | Estimated CAGR Impact | Regional Relevance | Market Impact |
|---|---|---|---|
Clean beauty ingredient adoption | +2.0% | Europe, North America, Asia Pacific | Supports natural formulations. |
Growth of raw and unrefined shea butter | +1.7% | Europe, U.S., Africa | Drives authenticity demand. |
Organic and fair-trade positioning | +1.5% | Europe and North America | Improves premium appeal. |
Shea butter in hair nourishment products | +1.3% | Global | Expands care routines. |
Sustainable sourcing transparency | +1.1% | Europe and North America | Strengthens brand trust. |
Demand Analysis
Impact Factor | Estimated CAGR Impact | Regional Relevance | Market Impact |
|---|---|---|---|
Demand from cosmetics and personal care | +2.4% | Europe, North America, Asia Pacific | Leads market usage. |
Demand for moisturizers and body lotions | +1.8% | Global | Supports daily application. |
Demand for organic shea butter | +1.6% | Europe and North America | Drives premium sales. |
Demand from hair care brands | +1.3% | U.S., Europe, Africa, Brazil | Expands category use. |
Demand from food and confectionery makers | +1.0% | Europe and Asia Pacific | Supports industrial demand. |
Segment covered in the Report
By Product Type
Raw/Unrefined Shea Butter
Refined Shea Butter
By Nature
Organic
Conventional
By Distribution Channel
Direct Sales
Indirect Sales
By Application
Cosmetics and Personal Care
Food Processing
Pharmaceuticals
Others
By Region
Asia Pacific
North America
Europe
Middle East & Africa
Latin America
Drivers Impact Analysis
Impact Factor | Estimated CAGR Impact | Regional Relevance | Market Impact |
|---|---|---|---|
Rising demand for natural skin care ingredients | +2.3% | Europe, North America, Asia Pacific | Drives cosmetic use. |
Growth in organic personal care products | +1.9% | Europe and North America | Supports premium demand. |
Wider use in hair care and body care | +1.6% | Global | Expands daily usage. |
Increasing demand from cosmetics brands | +1.5% | Europe, U.S., South Korea, Japan | Strengthens bulk demand. |
Growth in ethical and fair-trade sourcing | +1.2% | Europe and North America | Builds consumer trust. |
Restraints Impact Analysis
Impact Factor | Estimated CAGR Impact | Regional Relevance | Market Impact |
|---|---|---|---|
Seasonal raw material availability | -1.1% | West Africa supply regions | Affects supply stability. |
Price volatility of shea nuts | -0.9% | Global buyers | Pressures margins. |
Quality variation in raw shea butter | -0.8% | Export and processing markets | Impacts product consistency. |
Limited processing infrastructure | -0.7% | African producer regions | Slows supply scaling. |
Competition from alternative natural butters | -0.6% | Cosmetics and food sectors | Limits substitution growth. |
Opportunities Impact Analysis
Impact Factor | Estimated CAGR Impact | Regional Relevance | Market Impact |
|---|---|---|---|
Expansion of organic shea butter products | +2.1% | Europe, North America | Supports premium growth. |
Growth in clean beauty formulations | +1.8% | Europe, U.S., Asia Pacific | Drives ingredient demand. |
Rising use in hair care products | +1.5% | North America, Africa, Europe | Expands product scope. |
Food and confectionery applications | +1.2% | Europe and Asia Pacific | Opens industrial demand. |
Fair-trade and women-led sourcing programs | +1.1% | Europe, North America, West Africa | Strengthens brand value. |
Challenges Impact Analysis
Impact Factor | Estimated CAGR Impact | Regional Relevance | Market Impact |
|---|---|---|---|
Supply chain dependence on West Africa | -1.0% | Global | Raises sourcing risk. |
Maintaining certified organic supply | -0.8% | Europe and North America | Increases compliance needs. |
Climate impact on shea tree yield | -0.7% | African producing countries | Affects raw material flow. |
Processing and export quality control | -0.6% | Producer and exporter markets | Requires strict standards. |
Counterfeit and diluted products | -0.5% | Online and informal channels | Reduces buyer confidence. |
Recent Developments
February 2026, Nigeria extended raw shea nut export ban
Nigeria extended its ban on raw shea nut exports for one year, the policy was introduced to support domestic processing, increase value-added exports, improve livelihoods in shea-producing communities, and reduce dependence on raw commodity exports. The government also directed that excess raw shea nut supply should be exported only through the Nigerian Commodity Exchange framework.
March 2026, Ghana received modern shea processing support
UNDP Ghana, with funding support from the Government of Japan, handed over two modern shea butter processing facilities to communities in Tempane. The facilities include modern grinders and roasters and are expected to benefit about 150 women in the shea value chain. This development is important because it reduces manual processing time, improves product consistency, and supports better income stability for rural women processors.
March 2026, Global Shea Alliance launched SHEA 2026
The Global Shea Alliance launched SHEA 2026: Beyond Borders in Tamale, Ghana. The event was linked with Ghana’s 24-Hour Economy initiative and was designed to bring together industry leaders, women’s cooperatives, private sector actors, and development partners across the shea value chain. The focus on continuous production, industrial growth, and value addition signals stronger institutional support for processed shea products.
April 2026, Shea 2026 conference focused on value addition
The Global Shea Alliance opened its annual Shea 2026 conference in Ghana with a strong focus on value addition. Ghana’s Vice President highlighted that African countries can earn more by shifting from raw shea nut exports to processed shea products. The conference also noted that demand continues to expand as food, confectionery, and cosmetics industries increase their use of shea derivatives.
Report Scope
Report Highlights | Details |
|---|---|
Market Revenue (2025) | USD 4.1 Billion |
Forecast Revenue (2035) | USD 9.4 Billion |
CAGR (2025-2035) | 8.6% |
Base Year for Estimation | 2025 |
Historic Data | 2020-2024 |
Forecast Period | 2025-2035 |
Report Coverage | AI market impact analysis, market surveys, trade analysis, Industry & competitive intelligence, Revenue projections, company positioning, competitive analysis, growth drivers, and emerging market trends, Strategic Consultation & Advisory Services |
Segments Covered | By Product Type (Raw/Unrefined Shea Butter, Refined Shea Butter), By Nature (Organic, Conventional), By Distribution Channel (Direct Sales, Indirect Sales), By Application (Cosmetics and Personal Care, Food Processing, Pharmaceuticals, Others), By Regional Insights |
Regional Analysis | North America - US, Canada; Europe - Germany, France, The UK, Spain, Italy, Russia, Netherlands, Rest of Europe; Asia Pacific - China, Japan, South Korea, India, New Zealand, Singapore, Thailand, Vietnam, Rest of Latin America; Latin America - Brazil, Mexico, Rest of Latin America; Middle East & Africa - South Africa, Saudi Arabia, UAE, Rest of MEA |
Key companies profiled | BASF SE, Olvea Group, Sophim S.A., Cargill, Inc., Suru Chemicals, Ghana Nuts Company Ltd., Croda International Plc, Agrobotanicals, LLC, Clariant AG, AAK AB, The Savannah Fruits Company, Bunge Loders Croklaan, and Olam International and Other Key Players |
Customization Scope | Tailored insights for specific regions, countries, and market segments can be provided. Additional report customization is available upon request. |
Competitive Landscape
The market is characterized by intense competition among established players and emerging companies. Strategic partnerships, mergers and acquisitions, and product innovation are key strategies employed by market participants.
Key Market Players
BASF SE
Olvea Group
Sophim S.A
Cargill, Inc.
Suru Chemicals
Agrobotanicals
Ghana Nuts Company Ltd
Croda International Plc
Clariant AG
AAK AB
The Savannah Fruits Company
Bunge Loders Croklaan
Other Key Players
Meet the Team
This report was prepared by our expert analysts with deep industry knowledge and research experience.
Pratiksha is market research analyst with strong experience in industry research, market forecasting, and competitive analysis. She specializes in identifying market trends, evaluating growth opportunities, and preparing data-driven insights across global industries. Her work supports businesses in understanding market dynamics, customer demand, regional opportunities, and strategic investment areas.
Sayali brings more than 5 years of experience to Globe Market Research, supporting the accuracy, clarity, and relevance of research content across multiple industries. She reviews market data, segment analysis, competitive insights, and industry trends to ensure each report meets strong quality standards and provides practical value to business decision-makers. Her expertise spans healthcare, information technology, consumer goods, and diverse cross-industry domains. With a strong focus on data reliability, structured analysis, and clear presentation, Sayali helps ensure that each research output delivers well-reviewed insights for clients, investors, consultants, and industry stakeholders.
Frequently Asked Questions
Related Reports
More in Food and Beverages
Dairy Products Market to Exceed USD 919.1 Billion by 2035
Global Dairy Products Market Size, Share Analysis By Product (Milk, Cheese, Yogurt, Butter, Cream, Others), By Distribution Channel (Supermarkets and Hypermarkets, Convenience Stores, Specialty Stores, Online, Others) , By Regional Insights, Business plan and Project Report, Investment Opportunities, Profitability, Industry Trends, Leading Companies and Growth Forecasts by 2025-2035
Meat and Poultry Market to Exceed USD 568.2 Billion by 2035
Global Meat and Poultry Market Size, Share Analysis By Type (Flavoured Meat and Poultry, Unflavoured White Meat and Poultry), By Distribution Channel (Supermarkets/Hypermarkets, Specialty Stores, Convenience Stores, Online Retail), By Regional Insights, Business plan and Project Report, Investment Opportunities, Profitability, Industry Trends, Leading Companies and Growth Forecasts by 2025-2035
Alcoholic Drinks Market to Cross USD 6.6 Trillion by 2035
Global Alcoholic Drinks Market Size By Product Type (Beer, Wine, Spirits, Others), By End User (Male, Female), By Packaging Type (Bottles, Cans, Others), By Distribution Channel(On-Trade, Off-Trade), By Regional Insights, Business plan and Project Report, Investment Opportunities, Profitability, Industry Trends, Leading Companies and Growth Forecasts by 2025-2035
Bottled Water Market to Cross USD 896.0 Billion by 2035
Global Bottled Water Market Size By Product (Spring Water, Purified Water, Mineral Water, Sparkling Water, Others), By Packaging Type (PET, Cans, Others), By Packaging Size (Small, Medium, Bulk), By Price Range (Mass, Premium), By Distribution Channel (On-Trade, Off-Trade), By Regional Insights, Business plan and Project Report, Investment Opportunities, Profitability, Industry Trends, Leading Companies and Growth Forecasts by 2025-2035