
Revenue, 2025
$460.3 Bn
Forecast, 2035
$896.0 Bn
CAGR, 2025-2035
6.9%
Report Coverage
Global
Market Size and Forecast
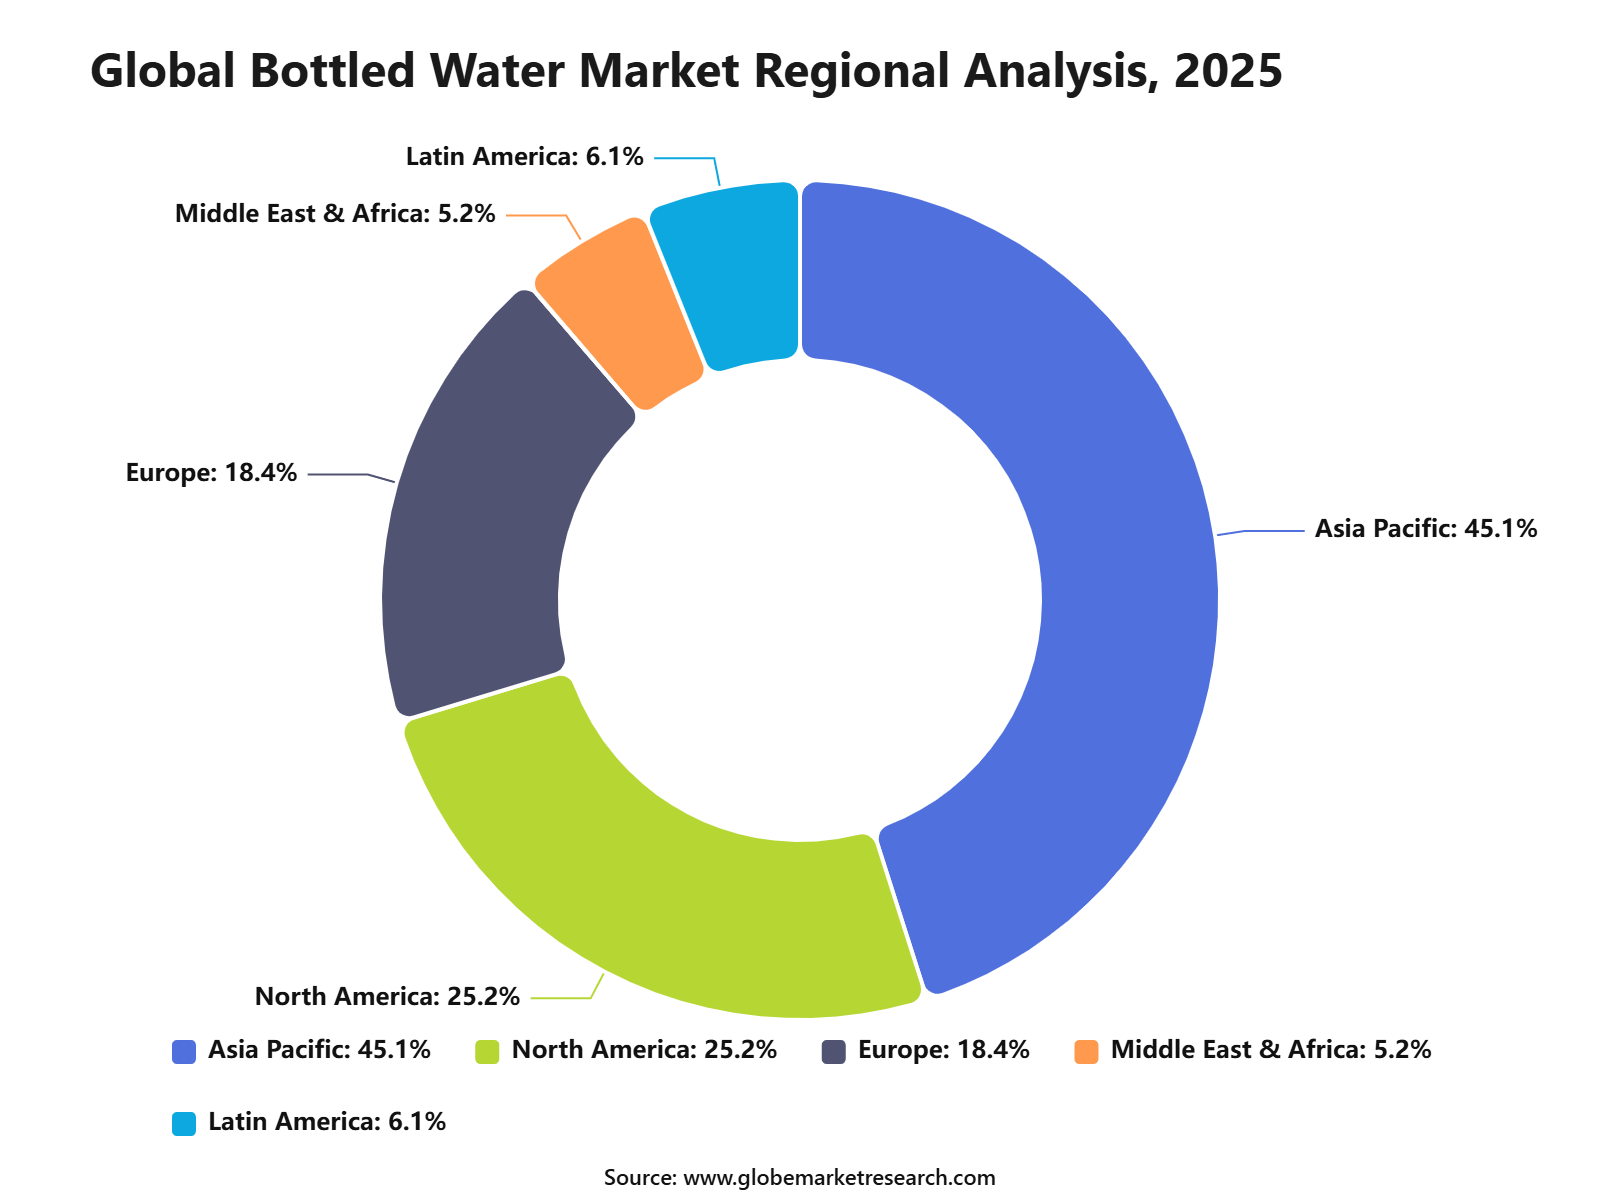
The Global Bottled Water Market was valued at USD 460.3 billion in 2025 and is projected to reach USD 896.0 billion by 2035, growing at a CAGR of 6.9% from 2025 to 2035. Asia Pacific held the largest regional share of 45.1% in 2025, supported by rising urban population, increasing health awareness, expanding retail networks, and growing demand for safe and convenient drinking water.
Bottled water includes still water, sparkling water, mineral water, purified water, spring water, and functional water products. The growth of the market can be attributed to increasing consumer preference for hygienic packaged drinking water, rising concerns over tap water quality, and higher demand for portable hydration across households, offices, travel, fitness, and outdoor activities.
The market outlook remains positive as brands focus on premium water, flavored water, functional hydration, sustainable packaging, and recycled plastic bottles. Asia Pacific is expected to maintain its leading position due to large population base, rising disposable income, expanding convenience retail, and increasing demand for packaged water in both urban and semi-urban areas.
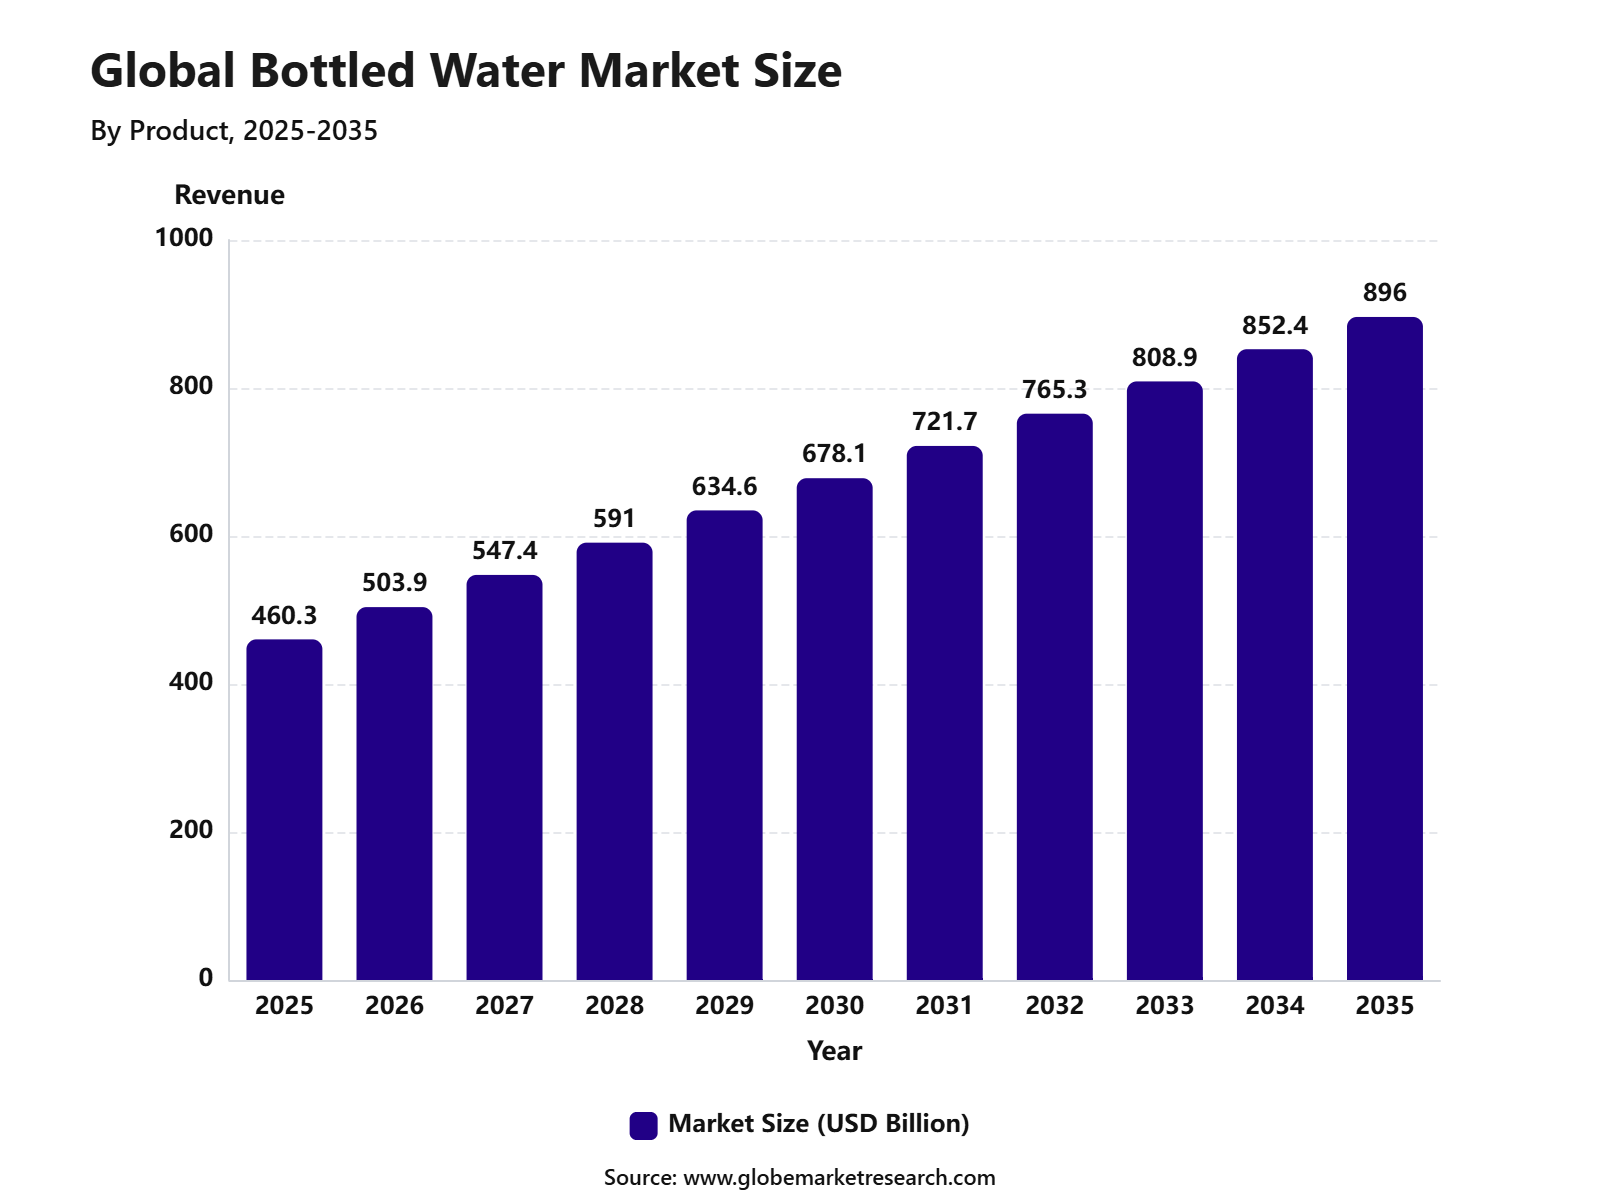 iThe graph shows projected market growth until 2035 based on CAGR analysis. Actual outcomes may vary depending on changing demand, competition, and economic factors.To gain greater insights - request a sample report PDF
Key Market Insights
Purified water led the type segment with 53.3% share, supported by strong consumer preference for safe, clean, and affordable drinking water.
PET bottles accounted for 86.2% share by packaging type, driven by low cost, lightweight structure, easy handling, and wide retail availability.
Medium-sized bottles held 73.2% share, supported by regular household use, workplace consumption, travel convenience, and strong demand across retail channels.
Mass-priced bottled water captured 88.5% share, driven by high consumer demand for affordable daily hydration products.
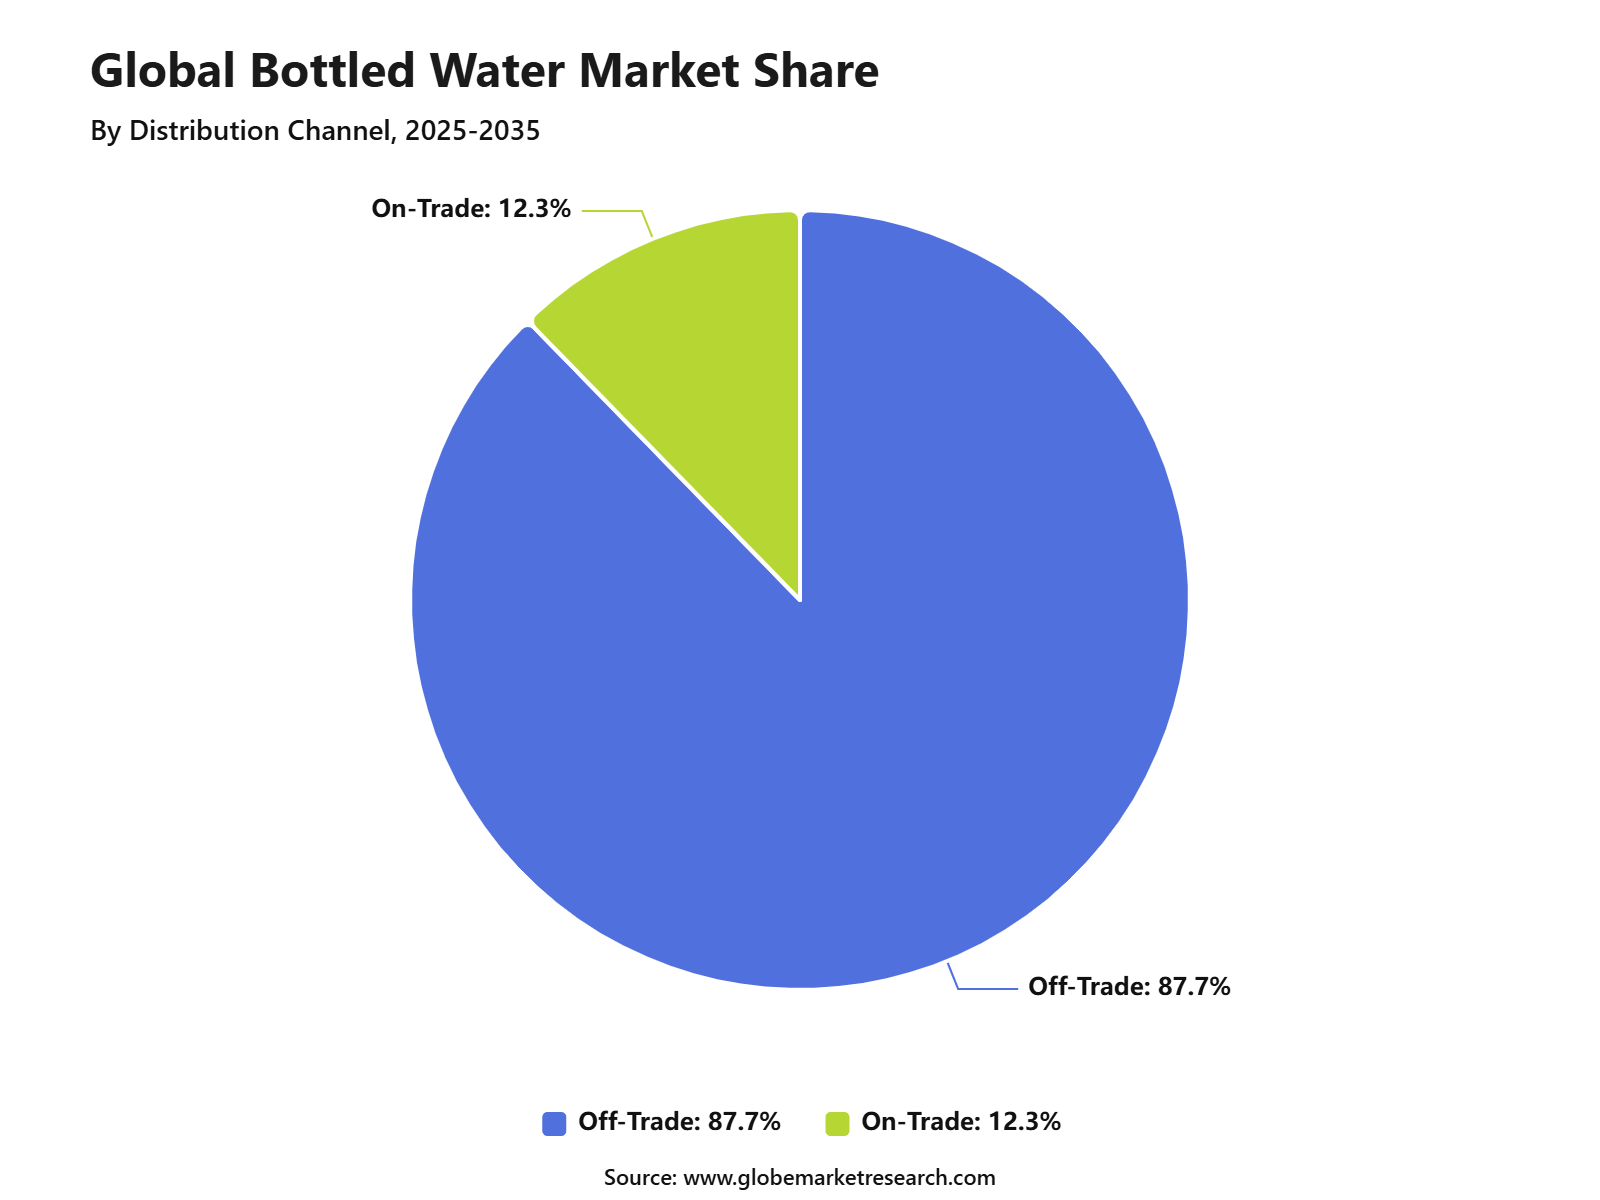
Off-trade channels accounted for 87.7% share, supported by strong sales through supermarkets, convenience stores, grocery outlets, and online retail platforms.
Asia Pacific led the bottled water market with 45.1% share, supported by rising urbanization, increasing health awareness, high population density, and growing demand for packaged drinking water.
Go-to-Market and Sales Strategy
The Bottled Water Market needs a health-led, convenience-led, and channel-led go-to-market strategy. Brands should separate products across still water, sparkling water, mineral water, spring water, purified water, alkaline water, flavored water, functional water, bulk packs, and home and office delivery formats. In the U.S., bottled water reached a new volume record of 16.4 billion gallons in 2024, while per-person consumption rose to 47.3 gallons, according to Beverage Marketing Corporation data published by IBWA. This confirms that bottled water remains a high-frequency beverage category driven by hydration, portability, and consumer preference for low-calorie drinks.
Sales economics are strongest when brands combine high retail availability with packaging efficiency, strong distribution, private label partnerships, and repeat-purchase formats. PET single-serve bottles support convenience sales, while multipacks, large bottles, refill stations, and office delivery support household and institutional demand. IBWA’s 2025 bottled water report noted that domestic non-sparkling water increased 2.8% in 2024, while sparkling water and imports together accounted for about 5% of U.S. bottled water volume. This shows that core still water remains the volume base, while premium and sparkling formats add value.
Revenue Potential Analysis
Revenue Landscape Across
The revenue landscape for bottled water is spread across retail multipacks, single-serve bottles, premium glass bottles, sparkling water, mineral water, flavored water, functional water, private label products, home and office delivery, vending, travel retail, hotels, restaurants, events, schools, hospitals, and emergency supply channels. Still water remains the foundation because it supports everyday hydration, household stocking, and convenience purchases. Sparkling, mineral, and functional waters add premium value because consumers may pay more for taste, minerals, carbonation, vitamins, electrolytes, or lifestyle positioning.
Packaging innovation is also shaping revenue potential. Brands are using lighter PET bottles, recycled PET, larger refillable formats, aluminum cans, cartons, and returnable glass in selected channels. NAPCOR reported that average recycled PET content in U.S. PET bottles reached 15.9% in 2024, above the prior three-year average of 13.7%. This supports revenue opportunities for brands that can connect hydration demand with stronger recycled-content claims and lower packaging impact.
Financial Impact
The financial impact can be positive for bottled water companies with strong sourcing rights, efficient bottling plants, high-speed packaging lines, direct-store delivery, retail shelf access, and low-cost logistics. Profitability is usually improved through scale, lightweight packaging, regional production, private label contracts, high inventory turnover, and strong relationships with supermarkets, convenience stores, wholesalers, hotels, offices, and foodservice buyers. Premium mineral water, sparkling water, flavored water, and functional water can also support better margins than basic still water.
Financial risk remains linked to packaging costs, freight, energy, water access permits, recycling fees, deposit-return systems, retailer deductions, and sustainability compliance. Recycling pressure will remain important because PET collection rates are improving but still limited in many markets. The strongest financial position is expected for brands that reduce packaging weight, increase recycled content, diversify pack formats, secure local water sources responsibly, and maintain strong safety documentation without raising prices beyond consumer affordability.
Type Analysis
Purified water led the Bottled Water Market with 53.3% share, supported by strong consumer demand for clean, treated, and safe drinking water. The segment is widely preferred because purification processes help remove impurities, improve taste consistency, and build consumer confidence in daily hydration products.
The growth of purified water can be attributed to rising health awareness, urbanization, and concerns over the quality of tap water in several markets. Purified bottled water is also widely available across mass retail, convenience stores, supermarkets, and online channels, which supports repeat purchases and high household consumption.
Packaging Type Analysis
PET bottles dominated the packaging type segment with 86.2% share, supported by their light weight, durability, low cost, and easy handling. PET bottles are widely used for single-serve, medium-size, and family-pack bottled water because they are convenient for travel, work, school, retail, and outdoor use.
The segment remains strong due to high production efficiency and wide compatibility with large-scale bottling operations. However, rising plastic waste concerns are encouraging brands to use recycled PET, lightweight bottle designs, refill models, and improved recycling systems.
Size Analysis
Medium-size bottled water held 73.2% share, driven by strong demand from households, offices, schools, retail buyers, and regular daily users. Medium packs are preferred because they offer a balance between portability, affordability, and adequate volume for everyday hydration.
The segment is supported by frequent purchases through supermarkets, hypermarkets, convenience stores, and online grocery platforms. Medium-size bottles are also widely used in multipack formats, which makes them suitable for household stocking and bulk retail sales.
Pricing Analysis
Mass-priced bottled water accounted for 88.5% share, supported by strong demand for affordable and regularly consumed hydration products. Bottled water is a high-frequency purchase item, so price accessibility remains an important factor for consumers across both developed and emerging markets.
The growth of this segment is being driven by everyday consumption, household use, school and office demand, and convenience-based purchases. Mass-priced products are expected to remain dominant because consumers often prioritize availability, trusted quality, and value over premium positioning in regular bottled water purchases.
Distribution Channel Analysis
Off-trade channels led the Bottled Water Market with 87.7% share, supported by high sales through supermarkets, hypermarkets, convenience stores, grocery outlets, discount stores, and online retail platforms. These channels are preferred because bottled water is mainly purchased for home, travel, office, and personal consumption.
The segment benefits from high shelf visibility, bulk packs, promotional pricing, and easy consumer access. Off-trade channels are expected to remain dominant as consumers continue to buy bottled water through routine grocery shopping, e-commerce, and convenience-led retail purchases.
 iThe graph shows projected market growth until 2035 based on CAGR analysis. Actual outcomes may vary depending on changing demand, competition, and economic factors.To gain greater insights - request a sample report PDF
Regional Analysis
Asia Pacific held the leading regional share of 45.1%, supported by a large population base, rapid urbanization, rising disposable income, and growing demand for packaged drinking water. China, India, Indonesia, Japan, and Southeast Asian countries remain important contributors to regional bottled water consumption.
The region is expected to maintain its leading position as consumers increasingly seek safe, convenient, and affordable hydration options. Growth is also being supported by modern retail expansion, online grocery adoption, travel activity, workplace consumption, and rising health awareness across urban and semi-urban markets.
 iThe graph shows projected market growth until 2035 based on CAGR analysis. Actual outcomes may vary depending on changing demand, competition, and economic factors.To gain greater insights - request a sample report PDF
Regional Impact Analysis
Impact Factor | Estimated CAGR Impact | Regional Relevance | Market Impact |
|---|---|---|---|
Asia Pacific market leadership | +2.1% | Asia Pacific, 45.1% share in 2025 | Leads consumption growth. |
China and India volume demand | +1.6% | China and India | Supports large-scale sales. |
North America premium water adoption | +1.1% | U.S. and Canada | Drives value growth. |
Europe sustainable packaging shift | +1.0% | Germany, UK, France, Italy | Supports recycled formats. |
Middle East and Africa safe water demand | +0.8% | GCC, South Africa, Nigeria | Builds steady adoption. |
Risk Factors & Market Barriers
The main risk factor is environmental pressure linked to single-use plastic packaging. Bottled water is convenient and widely consumed, but PET bottle collection and recycling remain under public scrutiny. NAPCOR reported that the U.S. PET bottle recycling rate was 30.2% in 2024, down from 32.5% in 2023, although it remained above the previous decade’s average of 29.5%. This creates pressure on brands to increase recycled content, reduce bottle weight, support deposit systems, and improve packaging recovery.
Another barrier is consumer trust around source quality, microplastics, PFAS, and contaminant testing. FDA tested 197 domestic and imported bottled water samples collected during 2023 and 2024 for PFAS and found detectable PFAS in 10 samples, with none above EPA maximum contaminant levels for public drinking water. This supports confidence in tested products, but it also shows why brands need regular testing, transparent quality reporting, and strong source-water controls.
Regulatory & Compliance Risks
Regulatory compliance is critical because bottled water is regulated as a food product in the U.S. FDA requires bottled water processors to follow quality standards, plant controls, equipment controls, sanitary operations, product testing, and recordkeeping requirements. FDA also sets contaminant limits for bottled water, including a lead limit of 5 ppb, which is lower than the EPA action level of 15 ppb used for public drinking water systems. This raises the need for source testing, bottling-line control, and supplier documentation.
Arsenic compliance is also important. FDA’s bottled water arsenic standard is 10 micrograms per liter, and manufacturers must monitor finished bottled water products for arsenic at least annually. These requirements affect spring water, mineral water, purified water, and imported bottled water brands. Compliance risk increases when companies make purity, mineral, natural, alkaline, or source-origin claims without strong testing records and accurate labeling.
Market Adoption Barriers
Market adoption barriers are mainly linked to price sensitivity, tap water competition, sustainability concerns, and packaging waste. Consumers may buy bottled water for safety, convenience, taste, travel, events, and emergency use, but many households also compare it with filtered tap water and reusable bottles. Brands therefore need to justify value through reliability, portability, mineral profile, premium source claims, functional ingredients, or clear sustainability actions.
At the same time, bottled water remains relevant in regions where safe water access is limited or unreliable. WHO and UNICEF reported in 2025 that 2.1 billion people globally still lacked safely managed drinking water in 2024, including 106 million people who drank directly from untreated surface water sources. Bottled water is not a substitute for public water infrastructure, but it remains important for emergency response, travel, disaster relief, institutions, remote work sites, and areas with weak water reliability.
Market Trend Analysis
Impact Factor | Estimated CAGR Impact | Regional Relevance | Market Impact |
|---|---|---|---|
Shift toward still bottled water | +1.6% | Global | Leads daily consumption. |
Growth in recycled PET packaging | +1.2% | Europe, North America, Asia Pacific | Supports sustainability goals. |
Premium mineral water adoption | +1.1% | Europe, U.S., Japan, GCC | Improves value growth. |
Functional bottled water launches | +1.0% | North America, Europe, Asia Pacific | Supports health positioning. |
Bulk bottled water demand | +0.8% | Households, offices, institutions | Expands repeat usage. |
Investor Type Impact Matrix
Investor Type | Estimated CAGR Impact | Regional Relevance | Market Impact |
|---|---|---|---|
Beverage Companies | +1.5% | Global | Expands bottled water portfolios. |
Packaging Material Investors | +1.2% | Europe, North America, Asia Pacific | Supports sustainable bottles. |
Private Equity Firms | +0.9% | Global | Supports brand scaling. |
Retail and Distribution Investors | +1.0% | Asia Pacific, Africa, Latin America | Strengthens market access. |
Water Treatment Technology Investors | +0.8% | Global | Improves product quality. |
Segment Covered in the Report
By Product
Spring Water
Purified Water
Mineral Water
Sparkling Water
Others
By Packaging Type
PET
Cans
Others
By Packaging Size
Small
Medium
Bulk
By Price Range
Mass
Premium
By Distribution Channel
On-Trade
Off-Trade
By Region
Asia Pacific
North America
Europe
Middle East & Africa
Latin America
Drivers Impact Analysis
Impact Factor | Estimated CAGR Impact | Regional Relevance | Market Impact |
|---|---|---|---|
Rising demand for safe drinking water | +1.8% | Asia Pacific, Africa, Latin America | Drives daily consumption. |
Growth in health-conscious consumers | +1.5% | North America, Europe, Asia Pacific | Supports bottled water demand. |
Increasing urbanization and busy lifestyles | +1.3% | China, India, Southeast Asia, Middle East | Expands on-the-go usage. |
Rising tourism and travel activity | +1.1% | Global travel hubs | Boosts packaged water sales. |
Wider availability through retail channels | +0.9% | Global | Improves product access. |
Restraints Impact Analysis
Impact Factor | Estimated CAGR Impact | Regional Relevance | Market Impact |
|---|---|---|---|
Plastic waste concerns | -1.0% | Europe, North America, Asia Pacific | Pressures packaging choices. |
Strict packaging regulations | -0.8% | Europe, U.S., India, China | Raises compliance cost. |
High logistics and transportation cost | -0.7% | Global | Pressures margins. |
Competition from home filtration systems | -0.6% | Developed markets | Reduces repeat purchases. |
Groundwater extraction concerns | -0.5% | Water-stressed regions | Raises sustainability pressure. |
Opportunities Impact Analysis
Impact Factor | Estimated CAGR Impact | Regional Relevance | Market Impact |
|---|---|---|---|
Growth in premium bottled water | +1.5% | North America, Europe, Asia Pacific | Supports higher margins. |
Expansion of flavored and functional water | +1.3% | U.S., Europe, Japan, South Korea | Opens value-added demand. |
Sustainable packaging innovation | +1.2% | Europe, North America, Asia Pacific | Builds brand preference. |
Rising demand in emerging economies | +1.1% | India, China, Indonesia, Africa | Expands volume growth. |
Growth in online grocery delivery | +0.9% | Global urban markets | Improves consumer reach. |
Challenges Impact Analysis
Impact Factor | Estimated CAGR Impact | Regional Relevance | Market Impact |
|---|---|---|---|
Reducing plastic dependency | -0.9% | Global | Requires packaging change. |
Maintaining price competitiveness | -0.7% | Mass-market segments | Affects volume sales. |
Water source sustainability | -0.6% | Water-stressed markets | Raises sourcing risk. |
Counterfeit and low-quality bottled water | -0.5% | Emerging markets | Reduces consumer trust. |
Supply chain and storage pressure | -0.5% | Global | Impacts distribution efficiency. |
Recent Developments
June 2026: The Nestlé water business sale process remained active, but bidder interest shifted. Reuters reported that PAI Partners and KKR had exited the process, while Clayton Dubilier & Rice and Platinum Equity were still in the race for a 50% stake in Nestlé’s water business.
April 2026: Danone increased investment behind bottled water brands. The company committed EUR 20 million to upgrade its Evian bottling facility and EUR 8 million to preserve its Evian, Volvic, Badoit, and La Salvetat water sites, reflecting stronger focus on healthy hydration and source protection.
Report Scope
Report Highlights | Details |
|---|---|
Market Revenue (2025) | USD 460.3 Billion |
Forecast Revenue (2035) | USD 896.0 Billion |
CAGR (2025-2035) | 6.9% |
Base Year for Estimation | 2025 |
Historic Data | 2020-2024 |
Forecast Period | 2025-2035 |
Report Coverage | AI market impact analysis, market surveys, trade analysis, Industry & competitive intelligence, Revenue projections, company positioning, competitive analysis, growth drivers, and emerging market trends, Strategic Consultation & Advisory Services |
Segments Covered | By Product (Spring Water, Purified Water, Mineral Water, Sparkling Water, Others), By Packaging Type (PET, Cans, Others), By Packaging Size (Small, Medium, Bulk), By Price Range (Mass, Premium), By Distribution Channel (On-Trade, Off-Trade) |
Regional Analysis | North America - US, Canada; Europe - Germany, France, The UK, Spain, Italy, Russia, Netherlands, Rest of Europe; Asia Pacific - China, Japan, South Korea, India, New Zealand, Singapore, Thailand, Vietnam, Rest of Latin America; Latin America - Brazil, Mexico, Rest of Latin America; Middle East & Africa - South Africa, Saudi Arabia, UAE, Rest of MEA |
Key companies profiled | Nestlé Waters, Danone S.A., The Coca-Cola Company, PepsiCo, Inc., Primo Water Corporation, Nongfu Spring Co., Ltd., Tingyi Holding Corp., Suntory Holdings Limited, Icelandic Glacial, Bisleri International Pvt. Ltd. |
Customization Scope | Tailored insights for specific regions, countries, and market segments can be provided. Additional report customization is available upon request. |
Competitive Landscape
The market is characterized by intense competition among established players and emerging companies. Strategic partnerships, mergers and acquisitions, and product innovation are key strategies employed by market participants.
Key Market Players
Nestlé Waters
Danone S.A.
The Coca-Cola Company
PepsiCo, Inc.
Primo Water Corporation
Nongfu Spring Co., Ltd.
Tingyi Holding Corp.
Suntory Holdings Limited
Icelandic Glacial
Bisleri International Pvt. Ltd.
Meet the Team
This report was prepared by our expert analysts with deep industry knowledge and research experience.
Pratiksha is market research analyst with strong experience in industry research, market forecasting, and competitive analysis. She specializes in identifying market trends, evaluating growth opportunities, and preparing data-driven insights across global industries. Her work supports businesses in understanding market dynamics, customer demand, regional opportunities, and strategic investment areas.
Sayali brings more than 5 years of experience to Globe Market Research, supporting the accuracy, clarity, and relevance of research content across multiple industries. She reviews market data, segment analysis, competitive insights, and industry trends to ensure each report meets strong quality standards and provides practical value to business decision-makers. Her expertise spans healthcare, information technology, consumer goods, and diverse cross-industry domains. With a strong focus on data reliability, structured analysis, and clear presentation, Sayali helps ensure that each research output delivers well-reviewed insights for clients, investors, consultants, and industry stakeholders.
Frequently Asked Questions
Related Reports
More in Food and Beverages
Dairy Products Market to Exceed USD 919.1 Billion by 2035
Global Dairy Products Market Size, Share Analysis By Product (Milk, Cheese, Yogurt, Butter, Cream, Others), By Distribution Channel (Supermarkets and Hypermarkets, Convenience Stores, Specialty Stores, Online, Others) , By Regional Insights, Business plan and Project Report, Investment Opportunities, Profitability, Industry Trends, Leading Companies and Growth Forecasts by 2025-2035
Meat and Poultry Market to Exceed USD 568.2 Billion by 2035
Global Meat and Poultry Market Size, Share Analysis By Type (Flavoured Meat and Poultry, Unflavoured White Meat and Poultry), By Distribution Channel (Supermarkets/Hypermarkets, Specialty Stores, Convenience Stores, Online Retail), By Regional Insights, Business plan and Project Report, Investment Opportunities, Profitability, Industry Trends, Leading Companies and Growth Forecasts by 2025-2035
Alcoholic Drinks Market to Cross USD 6.6 Trillion by 2035
Global Alcoholic Drinks Market Size By Product Type (Beer, Wine, Spirits, Others), By End User (Male, Female), By Packaging Type (Bottles, Cans, Others), By Distribution Channel(On-Trade, Off-Trade), By Regional Insights, Business plan and Project Report, Investment Opportunities, Profitability, Industry Trends, Leading Companies and Growth Forecasts by 2025-2035
Chocolate Confectionery Market to hit USD 368.5 Billion by 2035
Global Chocolate Confectionery Market Size By Product (Chocolate Bars, Boxed Chocolates, Chips and Bites, Truffles and Cups), By Chocolate Type (Milk Chocolate, Dark Chocolate, White Chocolate), By Distribution Channel (Supermarkets and Hypermarkets, Convenience Stores, Specialty Stores and Chocolatiers, Online and E-commerce, Others) , By Regional Insights, Business plan and Project Report, Investment Opportunities, Profitability, Industry Trends, Leading Companies and Growth Forecasts by 2025-2035