

Revenue, 2025
$ 49.5 Bn
Forecast, 2035
$ 87.8 Bn
CAGR, 2025-2035
5.9%
Report Coverage
Global
Market Size and Forecast
The Global Surfactants Market was worth USD 49.5 billion in 2025 and is expected to reach USD 87.8 billion by 2035, growing at a CAGR of 5.9% from 2025 to 2035. Asia Pacific held the largest regional share of 37.8% in 2025, supported by strong demand from personal care, home care, detergents, textiles, agriculture, oilfield chemicals, and industrial cleaning applications.
The Surfactants Market includes surface-active agents used to reduce surface tension and improve wetting, foaming, emulsifying, dispersing, and cleaning performance. These chemicals are widely used in soaps, shampoos, laundry detergents, dishwashing liquids, cosmetics, paints, coatings, agrochemicals, food processing, and industrial formulations. The market is closely linked with consumer goods production, hygiene products, specialty chemicals, and formulation-based manufacturing.
Key Parameter | Report Details |
|---|---|
Market Revenue, 2025 | USD 49.5 Billion |
Projected Revenue, 2035 | USD 87.8 Billion |
CAGR (2025-2035) | 5.9% |
Largest Region | Asia Pacific (37.8% Share) |
Fastest Growing Region | North America |
Market Concentration | Medium |
Base Year | 2025 |
Forecast Period | 2025-2035 |
The market outlook remains steady as demand continues to rise for cleaning, hygiene, and performance-enhancing chemical products. Growth can be attributed to increasing use of surfactants in household care, personal care, industrial cleaning, and agricultural formulations. The expansion of bio-based surfactants, mild formulations, and sustainable detergent technologies is expected to support long-term market demand.
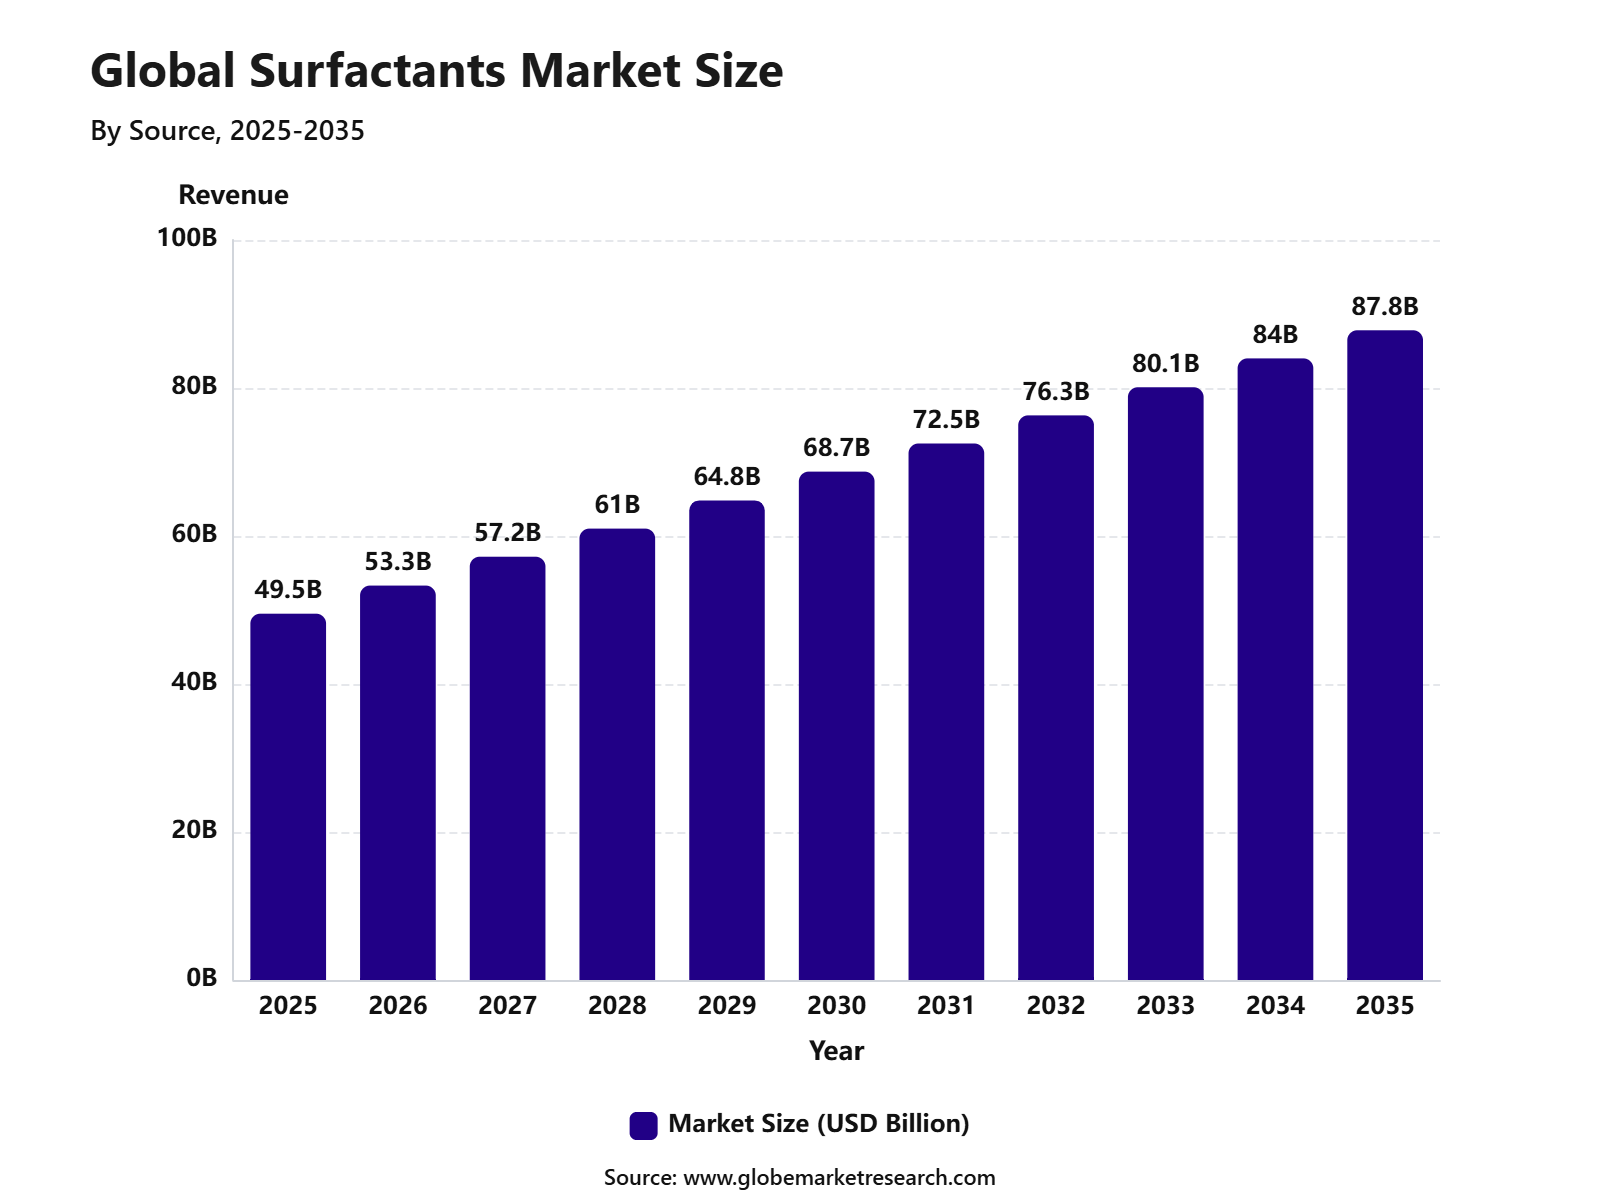 iThe graph shows projected market growth until 2035 based on CAGR analysis. Actual outcomes may vary depending on changing demand, competition, and economic factors.To gain greater insights - request a sample report PDF
Key Market Insights
Petroleum-based surfactants led the source segment with 88.4% share, supported by their cost efficiency, large-scale availability, stable performance, and wide use across cleaning, personal care, industrial, and chemical applications.
Non-ionic surfactants accounted for 38.8% share by product type, driven by their low foaming behavior, strong emulsifying ability, mildness, and compatibility with household and industrial formulations.
Homecare held 39.3% share by application, supported by strong demand for detergents, dishwashing liquids, surface cleaners, fabric care products, and other household cleaning solutions.
Asia Pacific led the surfactants market with 37.8% share, supported by rising homecare consumption, expanding personal care production, strong manufacturing activity, and high demand across China, India, Japan, and Southeast Asia.
Top Funding and Investment
Investment in the surfactants market is being driven by bio-based surfactants, alkyl polyglucosides, alkoxylates, tertiary amines, primary surfactants, glycolipid biosurfactants, and oleochemical-based ingredients. Capital is moving toward low-toxicity, biodegradable, palm-reduced, and regionally produced surfactant systems for home care, personal care, agrochemicals, oilfield chemicals, industrial cleaning, and coatings.
In 2025, Godrej Industries’ chemicals business announced an expansion plan of more than INR 750 crore across oleochemicals, specialty chemicals, fermentation, and surfactants. The company plans to add 30,000 tons per year of primary surfactants capacity, along with higher fatty alcohol, glycerine, specialty, and fermentation capacity. This investment strengthens India’s position in oleochemical-based surfactants for home care, personal care, agrochemicals, lubricants, and industrial applications.
In November 2025, BASF inaugurated a new alkyl polyglucosides production plant at its Bangpakong site in Thailand. APGs are bio-based, biodegradable, non-ionic surfactants used in personal care, home care, industrial cleaning, and agricultural formulations. The investment improves BASF’s regional supply flexibility in Asia and reduces cross-regional logistics pressure for sustainable surfactant customers.
By Source
Petroleum-based surfactants accounted for 88.4% share of the Surfactants Market. This dominance can be attributed to their large-scale availability, cost efficiency, stable performance, and wide use across homecare, personal care, industrial cleaning, agriculture, textiles, oilfield chemicals, and food processing applications.
These surfactants are widely preferred because they offer strong cleaning, foaming, emulsifying, wetting, and dispersing properties. Their consistent quality and compatibility with different formulations make them suitable for detergents, cleaners, shampoos, paints, coatings, lubricants, and industrial process chemicals.
Demand is expected to remain strong because petroleum-based surfactants are deeply integrated into high-volume manufacturing. However, producers are also improving formulations to meet rising environmental expectations, especially as buyers seek better biodegradability and lower-impact cleaning solutions.
By Product Type
Non-ionic surfactants held 38.8% share of the Surfactants Market. Their leadership is supported by low sensitivity to water hardness, strong emulsification ability, mildness, and compatibility with anionic, cationic, and amphoteric surfactants. These surfactants are widely used in laundry detergents, dishwashing liquids, industrial cleaners, personal care products, agrochemical formulations, paints, coatings, and textile processing.
They are valued because they perform well in both acidic and alkaline conditions. The segment is expected to maintain strong demand as industries focus on multifunctional and stable formulations. Non-ionic surfactants support improved cleaning efficiency, foam control, oil removal, and formulation flexibility, making them important across both consumer and industrial applications.
By Application
Homecare applications captured 39.3% share of the Surfactants Market. This leading position is driven by high surfactant consumption in laundry detergents, dishwashing products, surface cleaners, fabric softeners, disinfectant cleaners, and household hygiene products. Surfactants are essential in homecare products because they help remove oil, dirt, grease, stains, and microbes from different surfaces.
Their ability to improve wetting, foaming, soil suspension, and rinsing performance makes them central to cleaning product effectiveness. The segment is expected to remain a major demand center due to rising hygiene awareness, urban household growth, and increasing use of convenient cleaning products. Demand is also supported by concentrated detergents and liquid formats that require efficient surfactant systems.
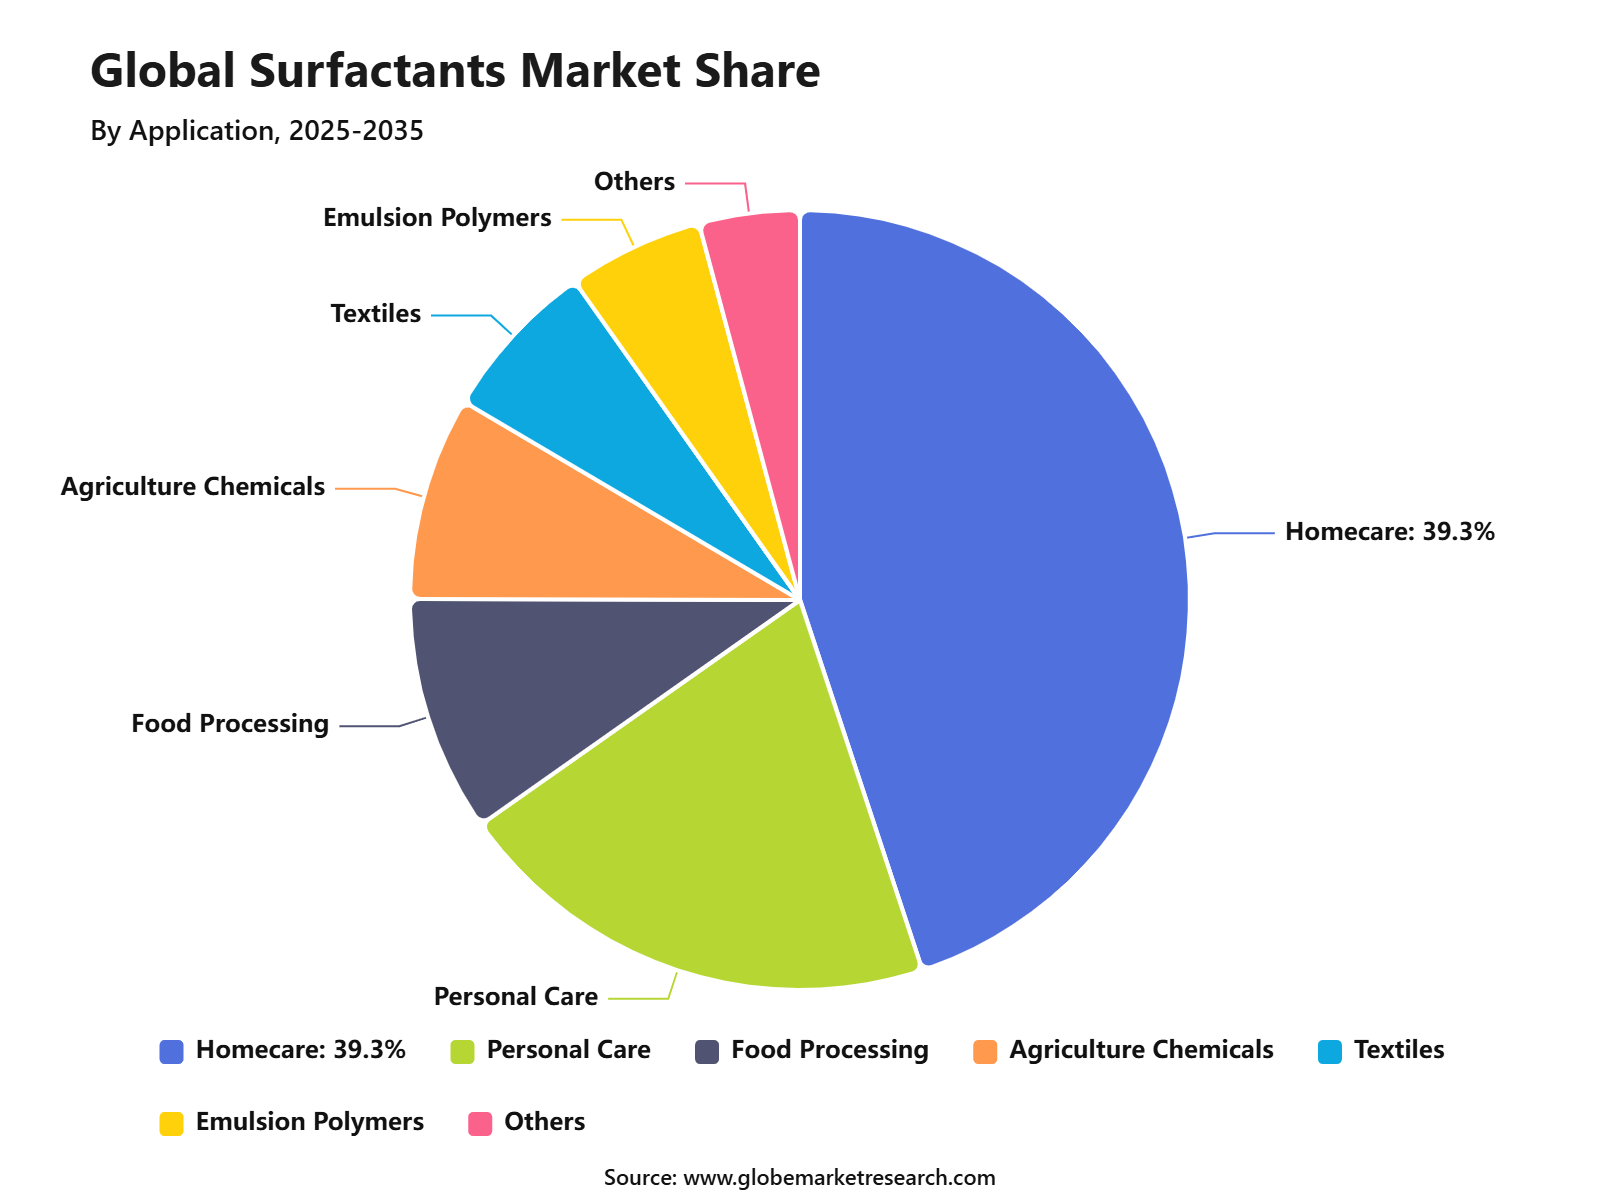 iThe graph shows projected market growth until 2035 based on CAGR analysis. Actual outcomes may vary depending on changing demand, competition, and economic factors.To gain greater insights - request a sample report PDF
By Region
Asia Pacific accounted for 37.8% share of the Surfactants Market, making it the leading regional market. Growth is supported by strong demand from homecare, personal care, textiles, agriculture, food processing, paints and coatings, and industrial manufacturing. China, India, Japan, South Korea, Indonesia, Vietnam, and other Southeast Asian economies are key demand centers.
The region benefits from large consumer populations, expanding middle-class spending, strong detergent manufacturing, and rising use of formulated cleaning and personal care products. Asia Pacific is expected to maintain its leading position as urbanization, industrial output, and household product consumption continue to increase. The need for cost-effective, high-performance, and application-specific surfactants will further support regional market growth.
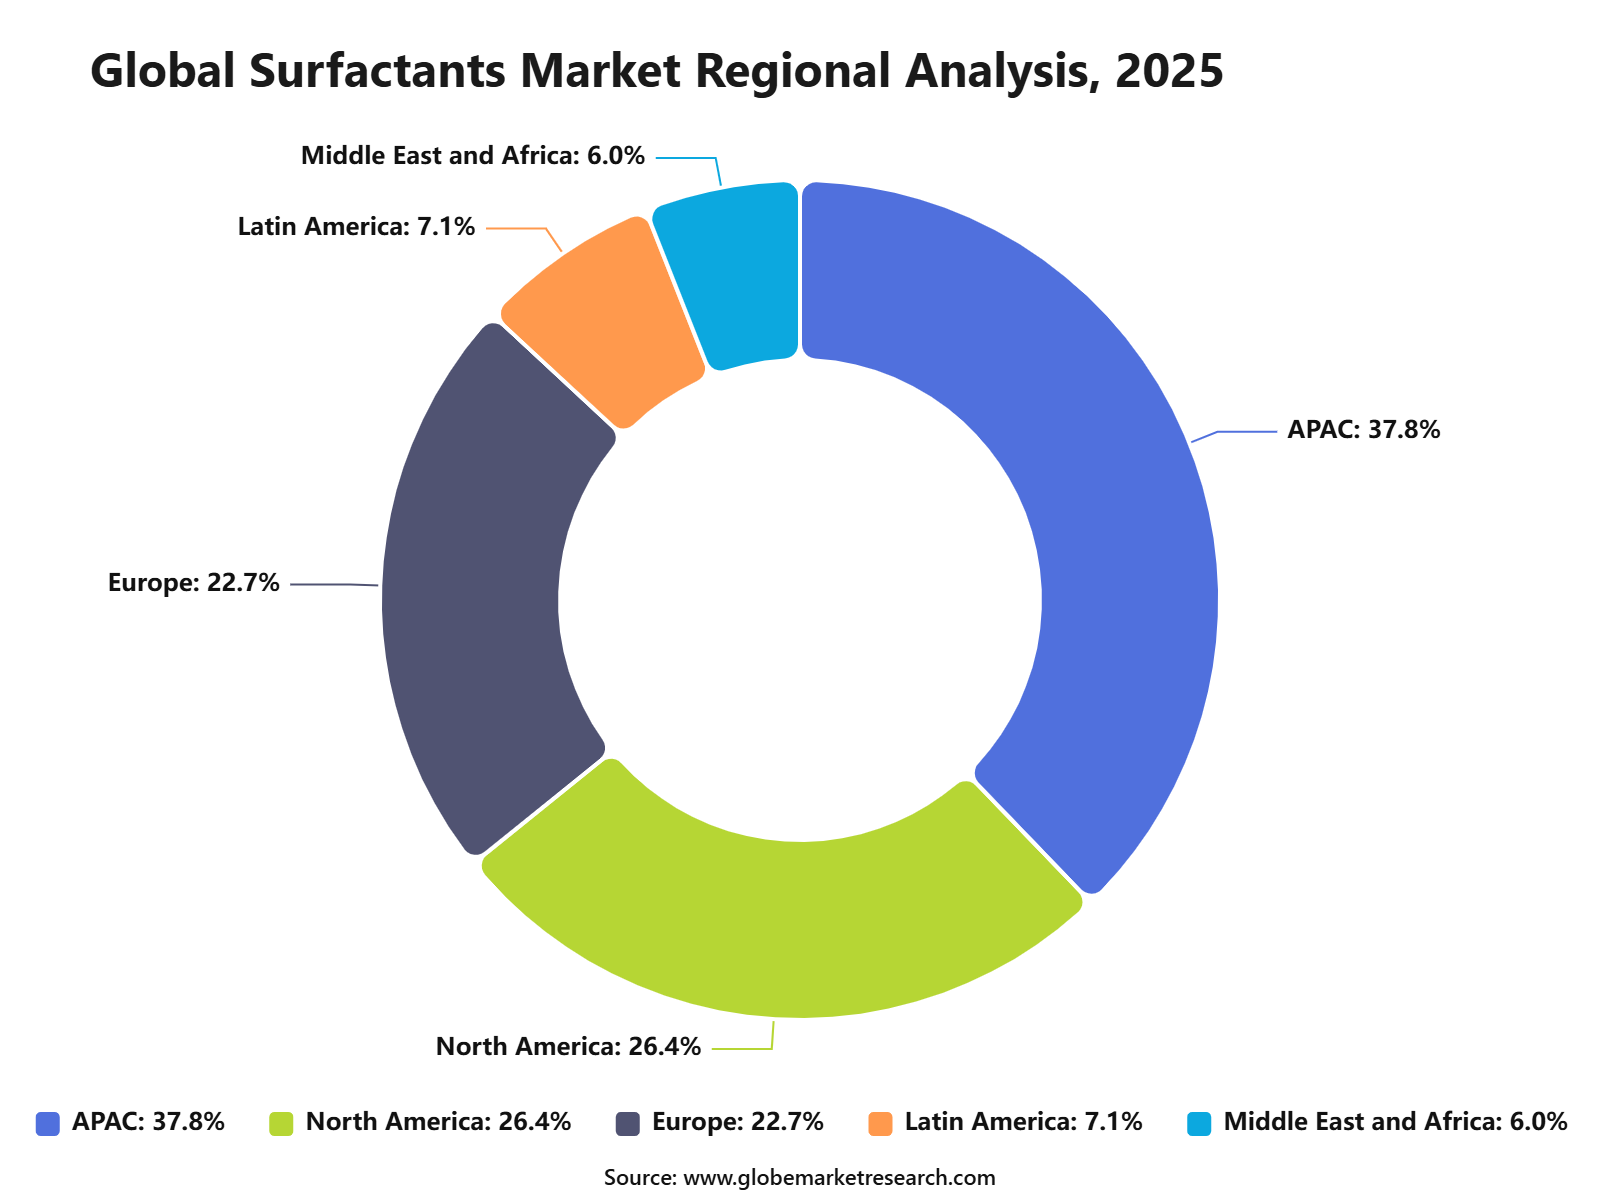 iThe graph shows projected market growth until 2035 based on CAGR analysis. Actual outcomes may vary depending on changing demand, competition, and economic factors.To gain greater insights - request a sample report PDF
Go-To-Market and Sales Economics
The go-to-market model for surfactants is becoming more application-led, with priority demand coming from homecare, personal care, industrial cleaning, agrochemicals, paints and coatings, textiles, oilfield chemicals, and food processing. Suppliers should sell through both direct technical teams and regional distributors because large buyers need formulation support, while small and medium formulators need shorter lead times and flexible pack sizes. EPA’s Safer Choice program shows that cleaning, laundry, dish, floor-care, and surface-cleaner categories remain important routes for safer surfactant adoption.
Sales economics are now linked strongly to price adjustment clauses, feedstock flexibility, and technical service. In the U.S., the Producer Price Index for bulk surfactants in surface active agent manufacturing reached 428.006 in May 2026, compared with 413.815 in January 2026. The commodity-based PPI for bulk surfactants also increased to 398.478 in May 2026 from 378.215 in January 2026, showing that contract pricing needs regular review.
Risk Factors & Market Barriers
The main barriers are feedstock volatility, performance substitution, aquatic toxicity concerns, and customer-specific qualification cycles. Surfactants depend on petrochemical inputs, palm-based oleochemicals, fatty alcohols, ethylene oxide, propylene oxide, benzene derivatives, and specialty additives. Price movement can quickly affect anionic, nonionic, cationic, amphoteric, and silicone-based surfactant economics.
Regulatory and environmental pressure is increasing around biodegradability, aquatic safety, and persistent degradation products. EPA’s Safer Choice criteria evaluate surfactants based on biodegradation rate, degradation products, and aquatic toxicity. The Safer Choice standard also generally uses more than 60% mineralization in ready biodegradation testing as an important benchmark.
Supply-chain risk is important for bio-based surfactants because palm kernel oil, coconut oil, and vegetable oils affect fatty alcohol availability. FAO reported that oilseed and oilmeal price indices rose 2.1% and 2.2% month on month in May 2026, while vegetable oil prices fell 4.6% but remained above year-earlier levels.
Revenue Potential Analysis
Revenue Landscape Across
Revenue opportunities are strongest across household detergents, personal care, industrial cleaning, agrochemical adjuvants, textiles, paints and coatings, construction chemicals, oilfield chemicals, food processing, paper, and pharmaceuticals. Anionic surfactants support high-foam cleaning, nonionic surfactants support emulsification, cationic surfactants support conditioning, and amphoteric surfactants support mild personal care formulations.
Home care and institutional cleaning remain core revenue routes because surfactants are essential for removing oils, dirt, stains, and microbes from hard and soft surfaces. Commercial, industrial, and institutional hard surface cleaners remain an important downstream category, supported by hygiene demand in hospitals, schools, offices, hotels, factories, and foodservice facilities.
Natural and bio-based surfactants can gain share where buyers want milder, renewable, and biodegradable ingredients. USDA forecast foreign vegetable oils production at 105.5 billion pounds for 2026/27, up 3.8 billion pounds from 2025/26. This supports oleochemical feedstock availability for fatty alcohol sulfates, glucosides, betaines, and other green surfactant systems.
Financial Impact
The financial impact in 2026 will depend on petrochemical costs, fatty alcohol prices, ethoxylation cost, energy, packaging, logistics, formulation yield, and compliance testing. The surface active agent manufacturing primary products PPI reached 378.645 in May 2026, compared with 366.090 in January 2026, indicating upward pricing pressure.
Margin protection will depend on product mix and raw material pass-through terms. Commodity surfactants used in mass detergents may face strong pricing pressure, while specialty surfactants for personal care, agrochemicals, coatings, oilfield chemicals, and pharmaceuticals can support better margins. Higher returns are expected where suppliers provide customized blends and formulation support.
Financial returns can improve through backward integration, renewable feedstock sourcing, concentrated formulations, lower-water shipping, and regional manufacturing. Industrial chemicals pricing also matters, as the industrial chemicals PPI reached 344.336 in May 2026, compared with 288.371 in January. Producers with stable feedstock contracts and strong technical service are better placed.
Drivers Impact Analysis
The Surfactants Market is driven by rising demand from household cleaning, personal care, industrial cleaning, food processing, textiles, agrochemicals, paints, coatings, and oilfield chemicals. Surfactants are widely used for cleaning, foaming, wetting, dispersing, emulsifying, and stabilizing formulations.
Asia Pacific leads the market due to strong detergent production, personal care consumption, textile manufacturing, and industrial chemical demand. China, India, Japan, South Korea, and Southeast Asia support growth through expanding consumer goods, manufacturing, and hygiene product usage.
Impact Factor | Estimated CAGR Impact | Regional Relevance | Market Impact |
|---|---|---|---|
Rising household cleaning demand | +1.5% | Asia Pacific, Europe, North America | Drives core consumption. |
Growth in personal care products | +1.3% | Asia Pacific, North America, Europe | Supports premium formulations. |
Expansion of industrial cleaning | +1.1% | Manufacturing and processing hubs | Builds steady demand. |
Increasing agrochemical usage | +0.9% | India, China, Latin America | Supports wetting and spreading use. |
Demand from paints and coatings | +0.7% | Global construction and industrial sectors | Adds formulation value. |
Restraints Impact Analysis
The market faces restraints from raw material price volatility, especially palm oil derivatives, petrochemical feedstocks, fatty alcohols, ethylene oxide, and other oleochemical inputs. Cost fluctuations can affect margins and pricing stability for surfactant producers. Environmental concerns also create pressure on synthetic surfactants. Buyers and regulators are increasingly focused on biodegradability, aquatic toxicity, carbon footprint, and safer formulations, which increases reformulation and compliance requirements.
Impact Factor | Estimated CAGR Impact | Regional Relevance | Market Impact |
|---|---|---|---|
Raw material price volatility | -0.8% | Global producers | Pressures margins. |
Environmental concerns over synthetic surfactants | -0.7% | Europe, North America, developed Asia | Raises reformulation needs. |
Palm oil sustainability concerns | -0.6% | Asia Pacific, Europe | Affects sourcing strategy. |
Competition from low-cost products | -0.5% | Emerging consumer markets | Limits pricing power. |
Strict wastewater discharge rules | -0.4% | Industrial and urban markets | Adds compliance burden. |
Opportunities Impact Analysis
Opportunities are strong in bio-based surfactants, mild personal care surfactants, green detergents, agrochemical adjuvants, oilfield chemicals, and high-performance industrial formulations. Consumers and brands are shifting toward safer, biodegradable, and lower-irritation ingredients. Specialty surfactants also offer attractive value because they support performance in smaller quantities. Producers that can offer customized blends, certified sustainable ingredients, and application-specific technical support can gain stronger customer loyalty.
Impact Factor | Estimated CAGR Impact | Regional Relevance | Market Impact |
|---|---|---|---|
Bio-based surfactant development | +1.4% | Europe, North America, Asia Pacific | Supports green demand. |
Mild surfactants for personal care | +1.2% | Global beauty and hygiene markets | Builds premium value. |
Sustainable detergent formulations | +1.1% | Europe, U.S., Japan, South Korea | Drives cleaner products. |
Agrochemical adjuvant growth | +0.9% | Asia Pacific, Latin America, Africa | Expands agricultural use. |
Specialty industrial surfactants | +0.8% | Manufacturing, oilfield, coatings | Adds technical demand. |
Challenges Impact Analysis
The main challenge is balancing cost, cleaning performance, foam control, skin mildness, and environmental safety. Customers want surfactants that work effectively across different water conditions, temperatures, surfaces, and formulation systems. Another challenge is supply chain dependence on both petrochemical and oleochemical raw materials. Producers must manage feedstock sourcing, sustainability certification, product consistency, and regulatory requirements while keeping prices competitive.
Impact Factor | Estimated CAGR Impact | Regional Relevance | Market Impact |
|---|---|---|---|
Balancing performance and sustainability | -0.7% | Global formulators | Affects product design. |
Managing feedstock supply risks | -0.6% | Asia Pacific, Europe, North America | Impacts production stability. |
Meeting biodegradability standards | -0.6% | Europe, North America, Japan | Raises testing needs. |
Maintaining formulation compatibility | -0.5% | Personal care and cleaning products | Increases technical work. |
Reducing irritation in personal care use | -0.4% | Premium consumer markets | Requires mild chemistry. |
Segment Covered in the Report
By Source
Petroleum-Based
Bio-Based
By Product Type
Non-Ionic Surfactants
Anionic Surfactants
Cationic Surfactants
Amphoteric Surfactants
Others
By Application
Homecare
Personal Care
Food Processing
Agriculture Chemicals
Textiles
Others
By Region
North America
Europe
Asia Pacific
Latin America
Middle East and Africa
Market Trend Analysis
The market trend is moving toward anionic, nonionic, amphoteric, and bio-based surfactants. Anionic surfactants remain important in detergents and cleaning products, while nonionic surfactants are widely used in industrial, personal care, textile, and agrochemical formulations.
Bio-based and mild surfactants are gaining more attention as brands focus on cleaner labels, lower irritation, and improved biodegradability. Household detergents, personal care, and industrial cleaning remain major demand areas across global markets.
Impact Factor | Estimated CAGR Impact | Regional Relevance | Market Impact |
|---|---|---|---|
Anionic surfactants remain widely used | +1.4% | Global cleaning markets | Leads volume demand. |
Nonionic surfactants gain broader use | +1.2% | Industrial and personal care sectors | Supports formulation flexibility. |
Bio-based surfactants gain traction | +1.0% | Europe, North America, Asia Pacific | Supports sustainability shift. |
Mild amphoteric surfactants grow | +0.8% | Personal care and baby care products | Adds premium demand. |
Concentrated cleaning products increase | +0.7% | Developed consumer markets | Improves formulation efficiency. |
Investor Type Impact Matrix
Investors should focus on surfactant producers with strong raw material access, diversified product portfolios, and exposure to detergents, personal care, agrochemicals, textiles, and industrial cleaning. These applications provide both volume stability and specialty value.
Strategic investors can also target bio-based surfactants, mild surfactant chemistry, sustainable detergent ingredients, and specialty industrial formulations. Companies that combine cost efficiency, compliance, and application support are better positioned for long-term growth.
Investor Type | Estimated CAGR Impact | Regional Relevance | Market Impact |
|---|---|---|---|
Surfactant Manufacturers | +1.3% | Global | Expands product capacity. |
Detergent and Home Care Ingredient Suppliers | +1.1% | Asia Pacific, Europe, North America | Drives core demand. |
Personal Care Ingredient Companies | +1.0% | Global beauty markets | Builds premium usage. |
Specialty Chemical Producers | +0.8% | Industrial and agrochemical sectors | Supports technical demand. |
Sustainability and Strategic Investors | +0.7% | Europe, North America, Asia Pacific | Funds bio-based growth. |
Recent Developments
March 2026, BASF–Hannong Chemicals Solutions inaugurated a non-ionic surfactant site in Seosan, Korea. The 12,234 m² facility is 51% owned by BASF, began trial operations in January 2026, and targets specialty surfactants.
March 2026, Evonik highlighted industrial-scale rhamnolipid biosurfactants at PCHi 2026. Its portfolio includes RHEANCE One, SOPHANCE LA-A and REWOFERM products for personal care and household cleaning, with multiple end-products already launched in China.
Research Methodology
Methodology Area | Coverage Details |
|---|---|
Primary Research | Interviews with manufacturers, suppliers, distributors, consultants, procurement teams, and industry experts. |
Secondary Research | Company filings, annual reports, regulatory databases, government publications, trade associations, and verified industry sources. |
Data Validation | Cross-verification through source triangulation, historical trend review, demand-side checks, and supply-side assessment. |
Market Estimation | Bottom-up and top-down analysis based on product demand, regional consumption, company presence, and application-level usage. |
Forecasting Approach | Forecasts based on regulatory shifts, infrastructure investment, technology adoption, pricing trends, industrial expansion, and end-use demand. |
Quality Review | Analyst review, peer validation, outlier checks, internal consistency review, and final publication approval. |
AI Policy | AI is not used as a primary data source. All published insights are reviewed against human-verified evidence. |
Competitive Landscape
The market is characterized by intense competition among established players and emerging companies. Strategic partnerships, mergers and acquisitions, and product innovation are key strategies employed by market participants.
Key Market Players
AkzoNobel N.V.
BASF SE
Evonik Industries AG
Solvay S.A.
Clariant AG
Huntsman International LLC
Dow Inc.
Kao Corporation
Henkel Adhesives Technologies India Private Limited
Bayer AG
Godrej Industries Limited
Stepan Company
Other Key Players
Meet the Team
This report was prepared by our expert analysts with deep industry knowledge and research experience.
Prashant is a skilled research analyst with five years of practical experience in market intelligence, strategic research, and business consulting. His expertise covers primary research, secondary research, competitive benchmarking, and industry trend analysis across sectors such as semiconductors, automotive, transportation and logistics, machinery, and industrial equipment. Prashant focuses on delivering clear, data-backed insights that help clients understand market shifts, technology adoption, regulatory developments, and emerging growth opportunities.
Sayali brings more than 5 years of experience to Globe Market Research, supporting the accuracy, clarity, and relevance of research content across multiple industries. She reviews market data, segment analysis, competitive insights, and industry trends to ensure each report meets strong quality standards and provides practical value to business decision-makers. Her expertise spans healthcare, information technology, consumer goods, and diverse cross-industry domains. With a strong focus on data reliability, structured analysis, and clear presentation, Sayali helps ensure that each research output delivers well-reviewed insights for clients, investors, consultants, and industry stakeholders.
Frequently Asked Questions
Related Reports
More in Chemical and Material
Carbon Capture Chemicals Market Size to Reach USD 78.0 Billion by 2035
Carbon Capture Chemicals Market By Chemical Type (Amines, Carbonates, Ammonia-based Solvents, Ionic Liquids, Solid Sorbent Chemicals, Others), By Absorption Type (Chemical Absorption, Physical Absorption), By End-Use Industry (Oil and Gas, Power Generation, Chemical and Petrochemical, Cement, Iron and Steel, Others), By Application (Post-combustion Capture, Pre-combustion Capture, Industrial Gas Separation, Direct Air Capture, Others), By Regional Insights, Business plan and Project Report, Investment Opportunities, Profitability, Industry Trends, Leading Companies and Growth Forecasts by 2025-2035
Bio-based Chemicals Market Size to Hit USD 296.7 Bn by 2035
Bio-based Chemicals Market By Product Category (Platform Chemicals, Polymers for Plastics, Paints, Coatings, Inks and Dyes, Surfactants, Cosmetics and Personal Care Products, Adhesives, Man-made Fibers, Others), By Application (Industrial, Agricultural, Pharmaceutical, Others), By Source (Plant-based, Animal-based, Microbial-based, Waste-based), By End Use (Chemical Manufacturing, Agriculture, Food and Beverage, Personal Care, Pharmaceuticals, Automotive), By Regional Insights, Business plan and Project Report, Investment Opportunities, Profitability, Industry Trends, Leading Companies and Growth Forecasts by 2025-2035
Hydrogen Processing Chemicals Market Size to Hit USD 14.6 Billion by 2035
Hydrogen Processing Chemicals Market By Chemical Type (Catalysts, Adsorbents, Solvents, Corrosion Inhibitors, Scavengers, Others), By Function (Reforming Chemicals, Purification Chemicals, Hydroprocessing Chemicals, Gas Treatment Chemicals, Corrosion Control Chemicals, Others), By Process (Steam Methane Reforming, Hydrocracking, Hydrotreating, Pressure Swing Adsorption, Water-Gas Shift Reaction, Others), By End Use (Refineries, Ammonia Production, Methanol Production, Petrochemicals, Clean Hydrogen Plants, Others), By Regional Insights, Business plan and Project Report, Investment Opportunities, Profitability, Industry Trends, Leading Companies and Growth Forecasts by 2025-2035
Electrolyte Chemicals Market to Cross USD 49.4 Billion by 2035
Electrolyte Chemicals Market By Battery Type (Lithium-ion Electrolytes, Lead-acid Electrolytes, Flow Battery Electrolytes, Others), By Electrolyte Form (Liquid Electrolytes, Gel, Solid-State Electrolytes), By Application (Electric Vehicles, Energy Storage Systems, Consumer Electronics, Industrial and Motive Batteries, Others), By Product Type (Lithium-Based Electrolytes, Sulfide-Based Electrolytes, Polymer-Based Electrolytes, Oxide-Based Electrolytes, Others), By Regional Insights, Business plan and Project Report, Investment Opportunities, Profitability, Industry Trends, Leading Companies and Growth Forecasts by 2025-2035