

Revenue, 2025
$20.8 Bn
Forecast, 2035
$36.9 Bn
CAGR, 2025-2035
5.9%
Report Coverage
United States
Market Size and Forecast
The U.S. LED Lighting Market was valued at USD 20.8 billion in 2025 and is projected to reach USD 36.9 billion by 2035, growing at a CAGR of 5.9% during the forecast period. The market is supported by the steady replacement of traditional lighting systems with energy-efficient LED products across residential, commercial, industrial, and public infrastructure spaces.
LED adoption is also strengthened by lower electricity use, longer product life, and wider use of lighting controls in buildings. Residential LEDs use at least 75% less energy and last up to 25 times longer than incandescent lighting, which supports long-term demand.
Key Parameter | Report Details |
|---|---|
Market Revenue, 2025 | USD 20.8 Billion |
Projected Revenue, 2035 | USD 36.9 Billion |
CAGR (2025-2035) | 5.9% |
Largest Region | United States |
Market Concentration | Medium |
Base Year | 2025 |
Forecast Period | 2025-2035 |
What is the U.S. LED Lighting Market?
The U.S. LED Lighting Market refers to the production, sale, installation, and replacement of light-emitting diode products used across homes, offices, factories, streets, parking areas, retail spaces, and public buildings. It includes LED bulbs, luminaires, fixtures, lamps, panels, strips, downlights, streetlights, and smart lighting systems. Demand is being supported by energy-saving targets, utility rebate programs, building modernization, and the growing shift toward connected lighting solutions.
The market outlook remains steady as LED lighting has moved from early adoption to mass replacement across the U.S. lighting ecosystem. In 2026, the U.S. Energy Information Administration reported that 90% of U.S. households used LED bulbs for indoor lighting, showing that LEDs have become the standard lighting choice in residential spaces. Commercial and industrial buildings are expected to remain important demand centers because they use lighting for longer operating hours and benefit directly from energy savings.
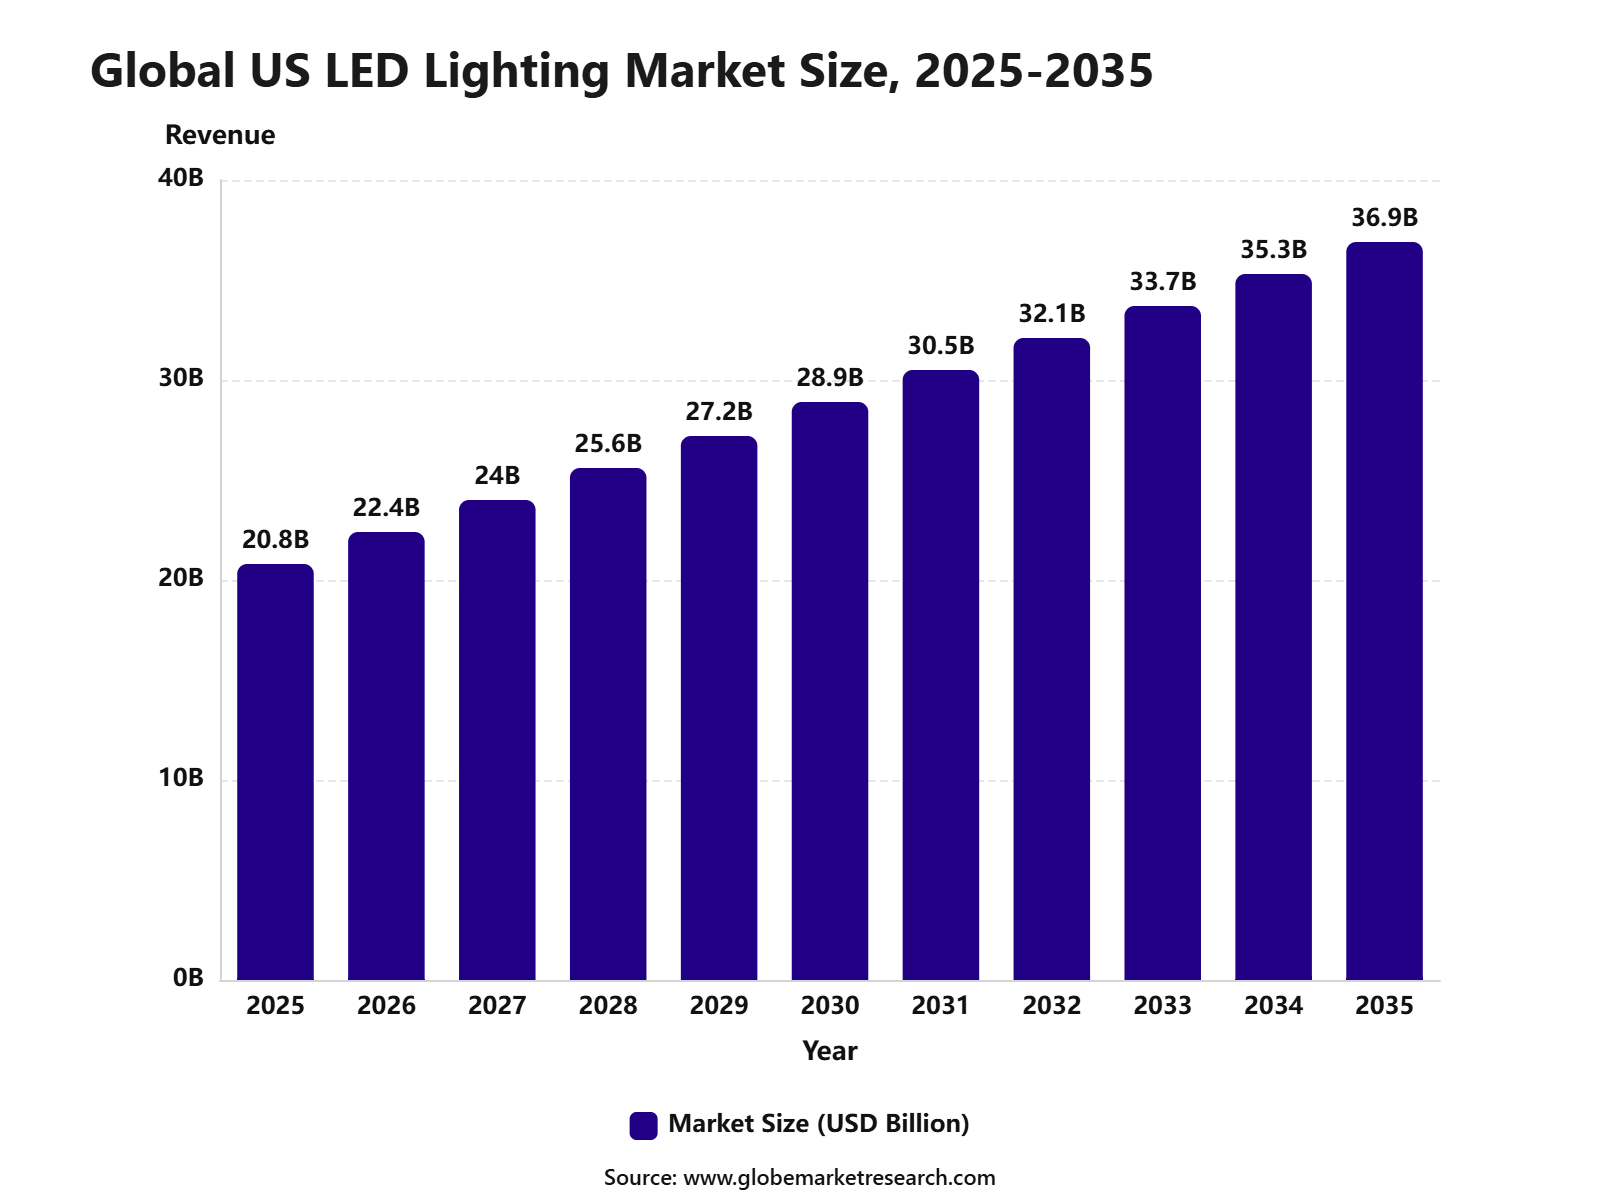 iThe graph shows projected market growth until 2035 based on CAGR analysis. Actual outcomes may vary depending on changing demand, competition, and economic factors.To gain greater insights - request a sample report PDF
Key Market Insights
LED luminaires and fixtures led the product type segment with 64.2% share, supported by strong demand for energy-efficient lighting systems across homes, offices, retail spaces, and industrial facilities.
Wholesale and retail channels accounted for 55.5% share, driven by broad product availability, contractor purchases, distributor networks, and consumer access through lighting stores and home improvement outlets.
Retrofit installations held 79.3% share, supported by replacement of traditional lighting systems with LED solutions to reduce electricity costs, improve efficiency, and meet energy-saving standards.
Residential applications captured 22.3% share, driven by rising use of LED bulbs, fixtures, smart lighting, and decorative lighting across households.
Indoor environments accounted for 54.7% share by end user, supported by high adoption in homes, offices, commercial buildings, schools, hospitals, and retail interiors.
Product Type Insights
LED luminaires and fixtures captured 64.2% share, supported by strong replacement demand across homes, offices, retail stores, warehouses, hospitals, schools, outdoor areas, and public facilities. Their higher share is linked to integrated designs, better light control, longer operating life, and lower maintenance needs compared with conventional lamps and older fixture systems.
The segment is also supported by the wider shift toward efficient lighting technology in the U.S. Department of Energy states that LED lighting is the most energy-efficient and rapidly developing lighting technology, while quality LED products last longer, are more durable, and provide comparable or better light quality than older lighting types.
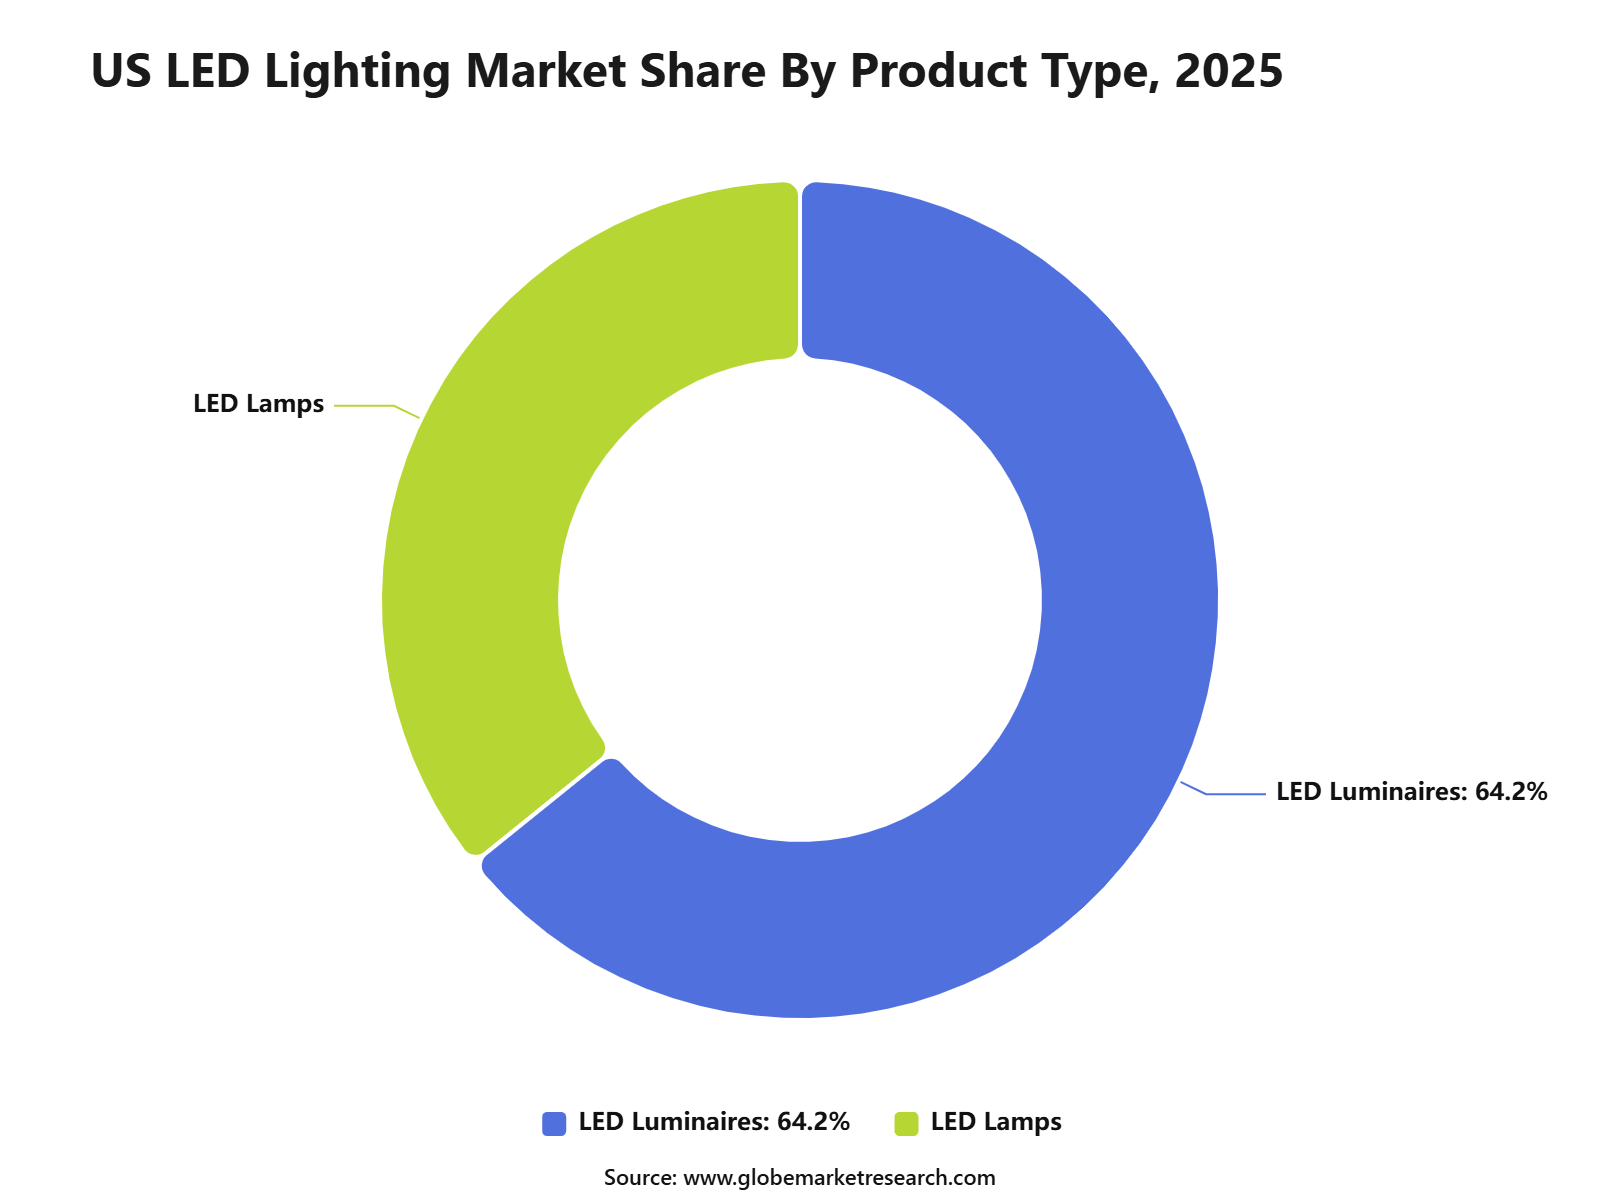 iThe graph shows projected market growth until 2035 based on CAGR analysis. Actual outcomes may vary depending on changing demand, competition, and economic factors.To gain greater insights - request a sample report PDF
Distribution Channel Insights
Wholesale and retail accounted for 55.5% share, driven by strong product movement through electrical distributors, lighting showrooms, home improvement stores, hardware retailers, and contractor supply networks. This channel remains important because large retrofit projects, commercial installations, and residential replacements require reliable product availability, bulk purchasing, technical support, and after-sales service.
The channel is also supported by strong household LED adoption. In the latest EIA Residential Energy Consumption Survey results, 90% of U.S. households reported using LED bulbs, while 37% used LED bulbs for all indoor lighting. This high installed base continues to support repeat sales through retail and professional distribution networks.
Installation Type Insights
Retrofits accounted for 79.3% share, supported by the replacement of incandescent, halogen, fluorescent, and CFL lighting with LED systems. Retrofit demand remains strong because building owners can improve energy efficiency without full electrical redesign, while households and businesses can reduce utility costs through faster replacement programs.
The retrofit trend is reinforced by U.S. efficiency standards. The Department of Energy finalized standards that raise the efficiency level for common lightbulbs from 45 lumens per watt to more than 120 lumens per watt, supporting a continued transition toward LED products. Compliance with the amended standards will be required from July 2028, which strengthens the long-term replacement cycle.
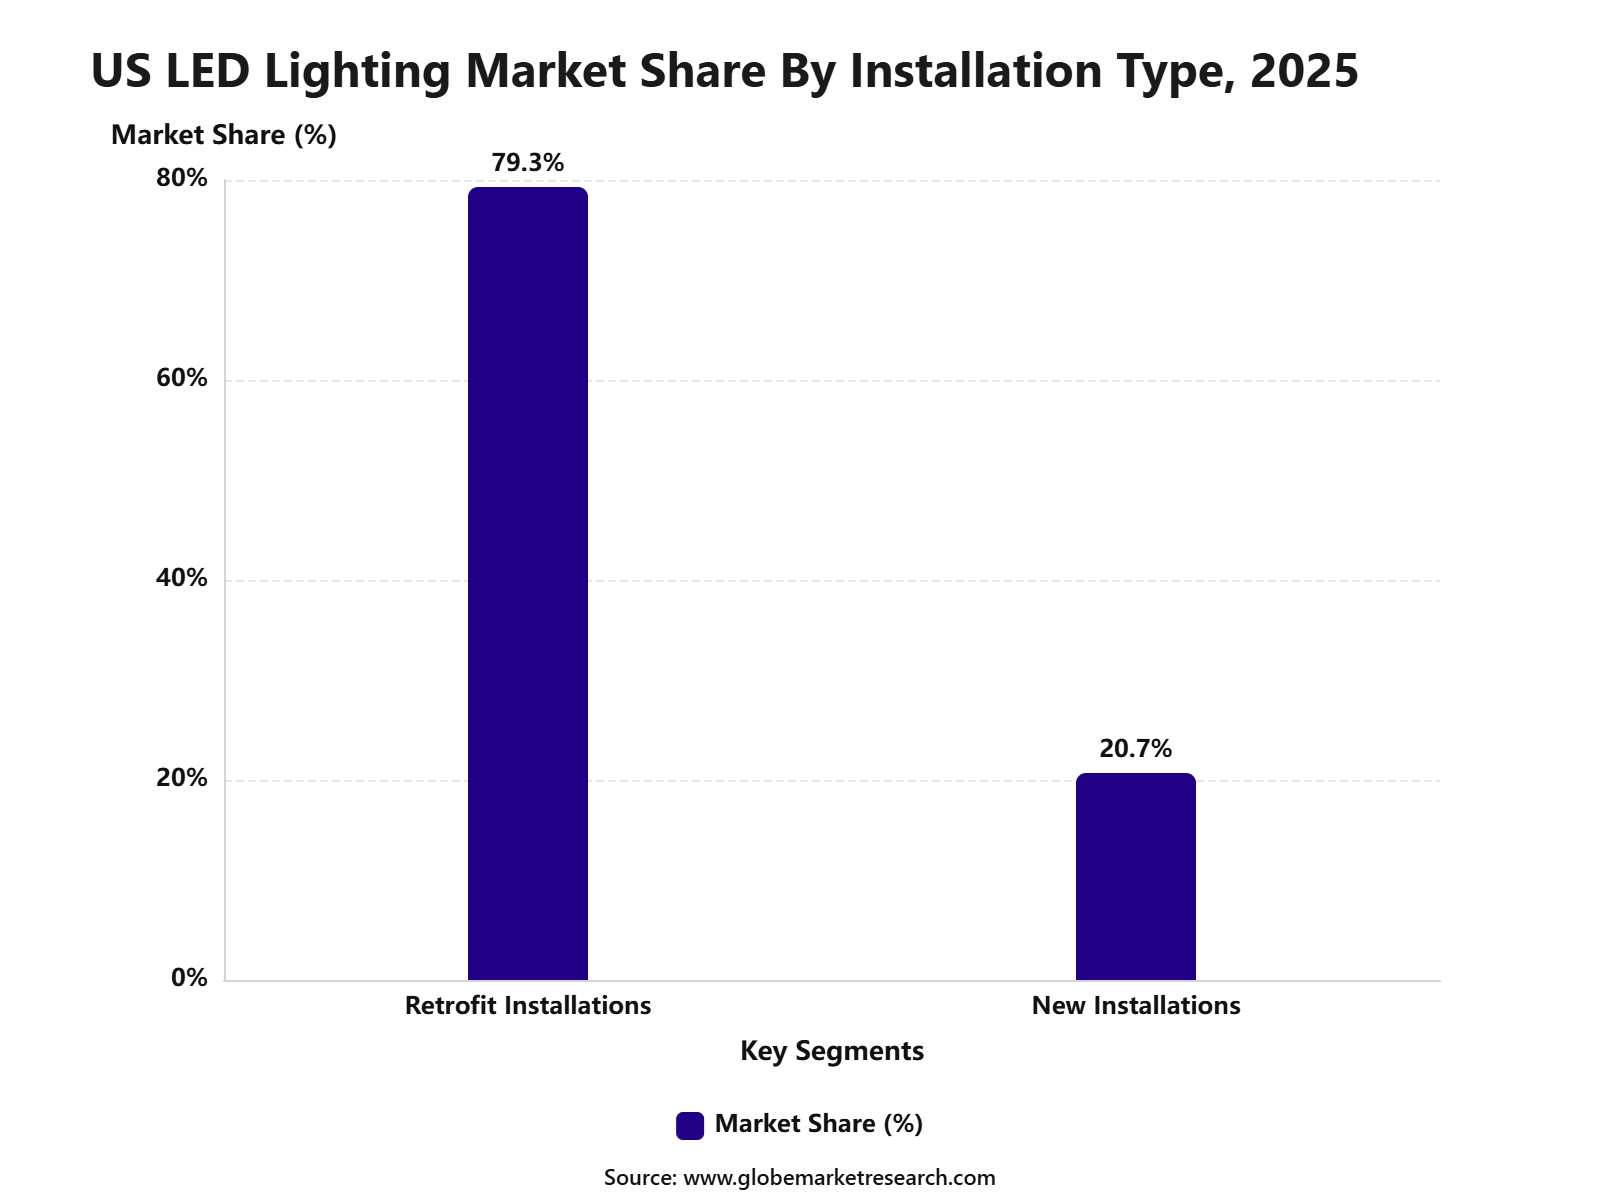 iThe graph shows projected market growth until 2035 based on CAGR analysis. Actual outcomes may vary depending on changing demand, competition, and economic factors.To gain greater insights - request a sample report PDF
Application Insights
Residential held 22.3% share, supported by rising LED use in bedrooms, kitchens, living rooms, bathrooms, garages, outdoor security lights, and decorative lighting. Growth is being driven by lower energy bills, better product availability, smart lighting adoption, and wider consumer preference for long-lasting bulbs and fixtures.
Residential demand is backed by strong adoption data. EIA reported that the share of U.S. households using mostly LED bulbs for indoor lighting increased from 4% in 2015 to 63% in 2024. Homes built between 2020 and 2024 showed even stronger LED adoption, with 71% using mostly or all LED lighting indoors.
End Use Environment Insights
Indoor environments accounted for 54.7% share, supported by high use of LED lighting across homes, offices, schools, hospitals, hotels, retail spaces, factories, and warehouses. Indoor LED demand is high because lighting is used for long operating hours, visual comfort, productivity, safety, and energy cost management.
The segment also benefits from lighting controls and automation. The Department of Energy notes that dimmers, motion sensors, occupancy sensors, photosensors, and timers can reduce energy use by turning lights off when not needed or lowering light levels when full brightness is not required. This supports stronger adoption of LED systems in controlled indoor environments.
Segment Covered in the Report
By Product Category
LED Lamps
LED Luminaires and Fixtures
By Sales Channel
Direct Sales
Wholesale and Retail Stores
E-Commerce
By Installation Type
New Installations
Retrofit Installations
By Application
Commercial Offices
Retail Spaces
Industrial Facilities
Residential Buildings
Public Infrastructure
Others
By End User
Indoor Lighting
Outdoor Lighting
Automotive Lighting
Drivers Impact Analysis
The U.S. LED Lighting Market is driven by rising energy-efficiency requirements, replacement of fluorescent and incandescent lighting, smart building adoption, and demand for lower electricity costs. LEDs offer longer life, better brightness control, and lower maintenance needs across residential, commercial, industrial, and outdoor applications.
Growth is also supported by retrofit activity in offices, warehouses, retail stores, schools, hospitals, street lighting, and residential buildings. Utility rebate programs, building code upgrades, and sustainability goals continue to encourage LED adoption across the country.
Impact Factor | Estimated CAGR Impact | Regional Relevance | Market Impact |
|---|---|---|---|
Rising energy-efficiency demand | +1.6% | U.S. residential and commercial buildings | Drives core adoption. |
Replacement of legacy lighting systems | +1.3% | Offices, homes, schools, warehouses | Supports retrofit demand. |
Growth in smart lighting systems | +1.1% | Urban and commercial buildings | Adds value growth. |
Lower maintenance and longer lifespan | +0.9% | Industrial and outdoor lighting users | Reduces ownership cost. |
Sustainability and carbon reduction goals | +0.7% | Public and private sectors | Supports long-term demand. |
Restraints Impact Analysis
The market faces restraints from price competition, product quality variation, and longer replacement cycles after LED adoption. Once LED systems are installed, their long life can reduce frequent replacement demand compared with older lighting technologies.
Another restraint is the higher upfront cost of connected and smart LED systems. While lifecycle savings are strong, some buyers remain cost-sensitive, especially in small businesses, older buildings, and lower-income residential segments.
Impact Factor | Estimated CAGR Impact | Regional Relevance | Market Impact |
|---|---|---|---|
Strong price competition | -0.8% | U.S. lighting supply chains | Pressures margins. |
Long LED replacement cycle | -0.7% | Mature retrofit markets | Slows repeat sales. |
Higher cost of smart lighting systems | -0.6% | Commercial and residential buyers | Limits premium adoption. |
Product quality variation | -0.5% | Online and low-cost channels | Affects buyer trust. |
Installation and compatibility issues | -0.4% | Older buildings and retrofit sites | Adds adoption friction. |
Opportunities Impact Analysis
Opportunities are strong in LED luminaires, smart lighting, connected controls, human-centric lighting, outdoor LED systems, and commercial retrofit projects. These areas benefit from demand for energy savings, automation, safety, comfort, and better building performance.
Higher-value opportunities are also emerging in IoT-enabled lighting, occupancy-based controls, tunable lighting, horticulture lighting, and EV charging site lighting. Companies that combine LEDs with sensors, controls, and software can capture better margins.
Impact Factor | Estimated CAGR Impact | Regional Relevance | Market Impact |
|---|---|---|---|
Commercial retrofit projects | +1.5% | Offices, retail, healthcare, education | Builds steady demand. |
Smart and connected LED systems | +1.3% | Commercial buildings and smart homes | Adds premium value. |
Outdoor and street lighting upgrades | +1.1% | Cities, highways, public facilities | Supports public-sector demand. |
Human-centric and tunable lighting | +0.8% | Healthcare, education, offices | Creates value-added growth. |
Horticulture and specialty lighting | +0.6% | Controlled agriculture and indoor growing | Adds niche opportunity. |
Challenges Impact Analysis
The main challenge is maintaining profitability in a mature and competitive lighting market. Many basic LED products have become commoditized, pushing suppliers to compete on price, distribution, warranty, and service support.
Another challenge is integrating LED lighting with controls, building management systems, and smart home platforms. Buyers expect easy installation, reliable connectivity, cybersecurity, and measurable energy savings.
Impact Factor | Estimated CAGR Impact | Regional Relevance | Market Impact |
|---|---|---|---|
Commodity pricing pressure | -0.7% | General LED lamps and fixtures | Reduces margin strength. |
Smart system integration complexity | -0.6% | Commercial and residential users | Slows connected adoption. |
Warranty and reliability expectations | -0.5% | Professional lighting buyers | Raises service burden. |
Managing inventory across SKUs | -0.4% | Distributors and retailers | Increases supply complexity. |
Differentiating basic LED products | -0.4% | Mass-market channels | Limits brand premium. |
Recent Developments
June 2026, Cooper became the first lighting manufacturer certified under NEMA’s Make It American program for its Americus, Georgia facility. The certification supports lighting procurement for federally funded infrastructure and construction projects under domestic-content rules.
June 2026, Acuity Inc.: Acuity reported fiscal Q3 2026 net sales of USD 1.2 billion, up 1.6% year over year. Its Acuity Brands Lighting segment generated USD 905.2 million in net sales, down 1.9%, while lighting segment operating profit rose 19.9% to USD 160.6 million. The company also recorded USD 6.4 million in tariff refunds within the lighting segment.
June 2026, Cree LED: Cree LED introduced XLamp XE-B LEDs for directional, architectural, entertainment, and specialty lighting applications. The product uses a 0.9 × 1.4 mm package and delivers up to 60% higher intensity compared with existing LEDs using a larger 1 × 1 mm light-emitting surface.
Market Concentration
The U.S. LED Lighting Market has medium market concentration.
It is not highly concentrated because the market includes many national brands, regional manufacturers, importers, electrical distributors, private-label suppliers, retrofit contractors, smart lighting companies, and application-specific LED solution providers. Competition is spread across lamps, luminaires, fixtures, controls, indoor lighting, outdoor lighting, commercial buildings, residential channels, industrial facilities, and public infrastructure.
However, it is not low concentration because a smaller group of established companies has stronger control over professional lighting channels, brand trust, specification sales, contractor relationships, and smart lighting systems. Acuity Brands stated in its 2025 Form 10-K that lighting markets remain competitive and continue to evolve through acquisition and consolidation activity. Acuity’s lighting segment also generated USD 962.4 million in fiscal Q4 2025 sales, showing the scale advantage held by leading suppliers.
Exact Classification: Medium Concentration
Market Structure: Moderately Fragmented
Reason: The market has many active suppliers and distribution channels, but large players such as Acuity Brands, Signify, Hubbell, Current, Cree Lighting, Leviton, and Lutron hold stronger influence in commercial specifications, controls, retrofits, and connected lighting solutions.
Competitive Landscape
The market is characterized by intense competition among established players and emerging companies. Strategic partnerships, mergers and acquisitions, and product innovation are key strategies employed by market participants.
Key Market Players
Hubbell Lighting Inc.
Acuity Brands Lighting Inc.
Signify North America Corp.
GE Current, a Daintree company
Cree LED Inc.
Cooper Lighting Solutions LLC
LSI Industries Inc.
RAB Lighting Inc.
MaxLite Inc.
LEDVANCE LLC
Revolution Lighting Technologies Inc.
Dialight PLC (U.S. operations)
Orion Energy Systems Inc.
Energy Focus Inc.
Musco Sports Lighting LLC
Lithonia Lighting (Acuity Brands)
Gillux Lighting LLC
Growlite (Barron Lighting Group)
Nora Lighting LLC
Other Key Players
Research Methodology
This market study is prepared using a combination of primary and secondary research. Primary research includes discussions with manufacturers, suppliers, distributors, consultants, industry experts, and end users. Secondary research covers company reports, government databases, trade associations, technical publications, regulatory sources, and trusted industry documents. The collected information is used to assess market demand, pricing trends, technology adoption, competitive activity, and regional performance.
AI language models are not used as primary data sources, and publicly available AI-generated content is not treated as market evidence. Computational tools may be used to support data processing, translation, data classification, and pattern identification. However, every published assessment is supported by verified sources, human review, and primary market discussions.
Market estimates are developed through top-down and bottom-up approaches and validated using data triangulation. Revenue, production, shipment, pricing, and application-level data are compared across multiple sources. Forecasts consider economic conditions, regulatory changes, investment activity, innovation, supply chain developments, and industry risks. All findings are reviewed through source verification and internal quality checks before publication.
Part I
Source Management & Input Data Standards
Who provides data, how sources are qualified, and what types of evidence are admissible.
Part II
Research Scope & Market Coverage
How we define the markets we assess and the parameters that govern each product.
Part III
Data Collection, Verification & Submission
The mechanics of gathering, cross-checking, and hierarchically ranking evidence.
Part IV
Assessment Determination & Quality Controls
How raw data becomes a published assessment — normalisation, expert judgement, and outlier exclusion.
Part V
Publication, Corrections & Revision
Our publication schedule, corrections policy, and methodology review cycle.
Part VI
Independence, Ethics & Complaints
Conflict-of-interest policies, editorial independence, and how clients raise concerns.
Google · Preferred Sources
Don't miss the latest market research insights and industry updates on Google.
Add Globe Market Research as a preferred source in the Google app to see our reports, analysis, and market stories in your news suggestions.
Meet the Team
This report was prepared by our expert analysts with deep industry knowledge and research experience.
Prashant S. is a Research Analyst at Globe Market Research with more than four years of experience in market research and industry analysis. He specializes in the Aerospace and Defence, Automotive and Transportation, Semiconductor and Electronics, Information and Technology sectors, with expertise in market sizing, trend analysis, competitive assessment, and industry forecasting. He applies primary and secondary research, data validation, company analysis, and market estimation methods to deliver reliable insights for strategic planning and business decision-making.
Sayali brings more than 7 years of experience to Globe Market Research, supporting the accuracy, clarity, and relevance of research content across multiple industries. She reviews market data, segment analysis, competitive insights, and industry trends to ensure each report meets strong quality standards and provides practical value to business decision-makers. Her expertise spans healthcare, information technology, consumer goods, and diverse cross-industry domains. With a strong focus on data reliability, structured analysis, and clear presentation, Sayali helps ensure that each research output delivers well-reviewed insights for clients, investors, consultants, and industry stakeholders.
Frequently Asked Questions
Related Reports
More in Semiconductor and Electronics
KNX Products Market Size to Reach USD 50.8 billion by 2035
KNX Products Market Size, Share, Trends and Growth Analysis Report By Product Type (Sensors, Actuators, System Devices, Communication Devices, User Interfaces, Management Software, Others), By Application (Lighting Control, HVAC Control, Energy Management, Security and Access Control, Shutter and Blind Control, Others), By Installation Type (New Installations, Retrofit Installations), By End-Use Sector (Residential Buildings, Commercial Buildings, Industrial Facilities, Public Buildings), By Technology (Wired KNX Products, Wireless KNX Products, KNX IP Products), By Regional Insights, Technology Trends, Competitive Landscape, Strategic Opportunities and Growth Forecast, 2026-2035
Hardware in The Loop (HIL) Market Size to Reach USD 2.8 Billion by 2035
Hardware in The Loop (HIL) Market Size, Share and Growth Analysis By Type (Closed-Loop HIL, Open-Loop HIL), By Component (Software, Hardware, Services), By Application (Automotive, Aerospace & Defense, Semiconductor & Electronics, Industrial Automation, Power Systems), By End User (OEMs, Component Manufacturers, Research Institutions, Government-Funded Test Facilities), By Regional Insights, Technology Trends, Competitive Landscape, Strategic Opportunities and Growth Forecast, 2026-2035
Semiconductor IP Market Size to Reach USD 24.3 Billion By 2035
Global Semiconductor IP Market Size, Growth Analysis By Design IP (Interface IP, Processor IP, Memory IP, Others); By Core Type (Hard Core, Soft Core); By Revenue Source (Royalty, Licensing); By Industry (Consumer Electronics, IT and Telecommunications, Automotive, Industrial, Aerospace and Defense, Others), By Regional Insights, Value Chain & Trade Analysis, Investment Opportunities, Industry Trends, Competitive Analysis and Growth Forecasts By 2025-2035
Gaming Mouse Bundle Market to hit USD 5.3 billion by 2035
Global Gaming Mouse Bundle Market Size, Go-to-Market Strategy Analysis By Bundle Type (Mouse and Mousepad Bundle, Mouse and Keyboard Bundle, Mouse and Headset Bundle, Full Gaming Accessory Bundle), By Mouse Type (Wired Gaming Mouse, Wireless Gaming Mouse), By Sensor Type (Optical Sensor, Laser Sensor), By Price Range (Budget, Mid-range, Premium), By Distribution Channel (Online, Specialty Stores, Supermarkets and Hypermarkets, Others), By End User (Individual Gamers, Esports Players, Gaming Cafes, Others), By Regional Insights, Business plan and Project Report, Investment Opportunities, Profitability, Industry Trends, Leading Companies and Growth Forecasts By 2025-2035