

Revenue, 2025
$ 17.4 Bn
Forecast, 2035
$ 31.5 Bn
CAGR, 2025-2035
6.1%
Report Coverage
Global
Market Size and Forecast
The Global Wastewater Chemicals Market was worth USD 17.4 billion in 2025 and is expected to reach USD 31.5 billion by 2035, growing at a CAGR of 6.1% from 2025 to 2035. Based on this growth rate, the market is estimated to reach around USD 18.8 billion in 2026. Asia Pacific held the largest regional share of 40.5% in 2025, supported by rapid urbanization, industrial wastewater treatment demand, stricter discharge rules, and expanding municipal water infrastructure.
The Wastewater Chemicals Market includes chemical solutions used to treat, purify, disinfect, and manage wastewater from municipal, industrial, and commercial sources. These chemicals include coagulants, flocculants, biocides, disinfectants, pH adjusters, corrosion inhibitors, antifoaming agents, odor control chemicals, and sludge treatment chemicals. The market is closely linked with water reuse, pollution control, industrial compliance, and sustainable wastewater management.
Key Parameter | Report Details |
|---|---|
Market Revenue, 2025 | USD 17.4 Billion |
Projected Revenue, 2035 | USD 31.5 Billion |
CAGR (2025-2035) | 6.1% |
Largest Region | Asia Pacific (40.5% Share) |
Market Concentration | Medium |
Base Year | 2025 |
Forecast Period | 2025-2035 |
The market outlook remains positive as governments and industries increase focus on clean water, resource recovery, and wastewater recycling. Growth can be attributed to rising industrial discharge volumes, higher demand for municipal sewage treatment, and growing adoption of advanced treatment chemicals. The expansion of smart wastewater plants, stricter environmental standards, and water reuse projects is expected to support long-term market demand.
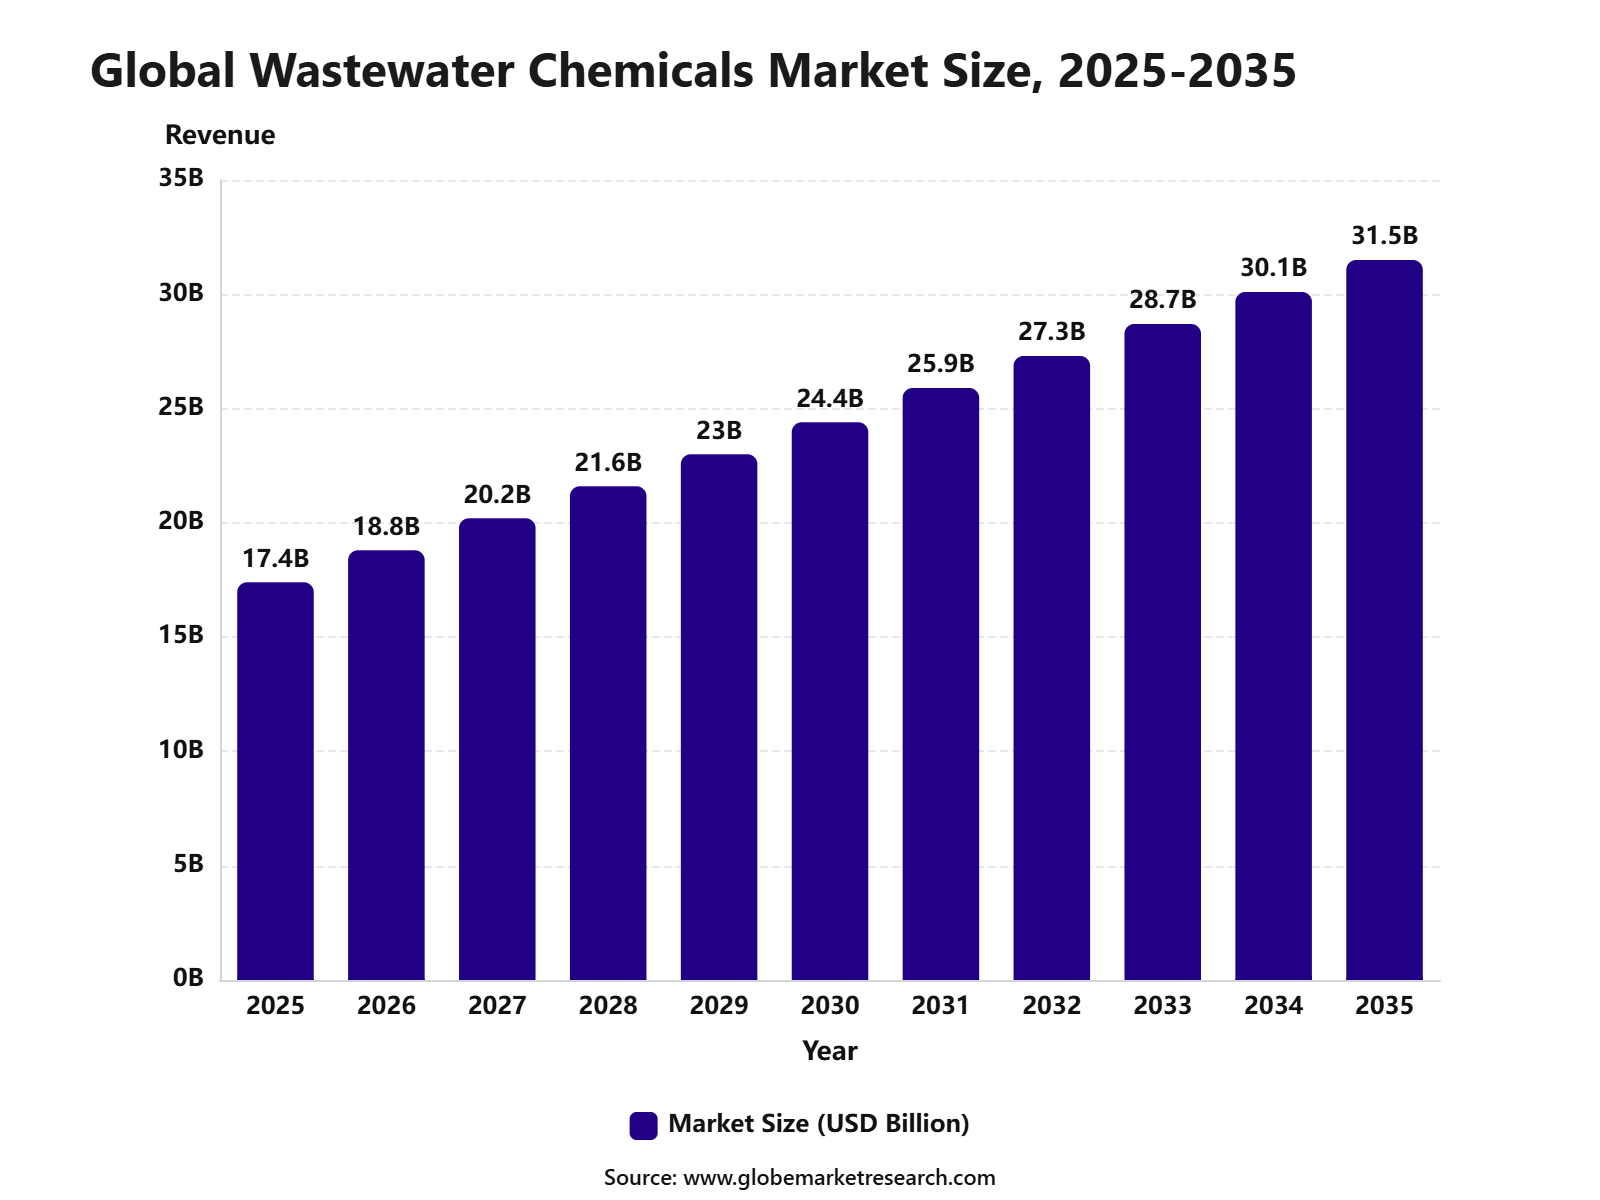 iThe graph shows projected market growth until 2035 based on CAGR analysis. Actual outcomes may vary depending on changing demand, competition, and economic factors.To gain greater insights - request a sample report PDF
Key Market Insights
Coagulants and flocculants led the type segment with 36.8% share, supported by their strong use in removing suspended solids, reducing turbidity, and improving wastewater clarification.
Power generation accounted for 32.1% share by end use, driven by high demand for wastewater treatment chemicals in cooling water systems, boiler water treatment, effluent control, and plant operations.
Asia Pacific led the wastewater chemicals market with 40.5% share, supported by rapid industrial growth, expanding power generation capacity, urban wastewater treatment needs, and rising investment in water infrastructure.
Top Funding and Investment
In May 2026, Ecovyst agreed to acquire INEOS Calabrian’s sulfur dioxide and sulfur derivatives business for $190 million, expanding into sodium bisulfite, sodium thiosulfate, and sodium metabisulfite products used in water treatment.
In March 2025, Capture6 raised $27.5 million in Series A and project funding to convert waste brine from wastewater and desalination into fresh water, carbon removal solutions, and green chemicals.
In May 2026, CREW Carbon raised $25 million, including $19 million in equity and $6 million in grants and non-dilutive funding, to scale wastewater treatment optimization using calcium carbonate smart dosing.
In January 2025, Oxyle raised $16 million in seed funding to scale its PFAS destruction technology for wastewater treatment.
In December 2025, Calgon Carbon announced a $13.2 million manufacturing expansion in Pennsylvania, supported by an additional $300,000 state grant, to expand activated carbon operations for water purification applications.
By Type
Coagulants and flocculants accounted for 36.8% share of the Wastewater Chemicals Market. This leadership is supported by their wide use in removing suspended solids, turbidity, organic matter, oils, heavy metals, and fine particles from wastewater streams.
These chemicals are widely used in municipal treatment plants, power generation facilities, oil and gas operations, mining, pulp and paper, food processing, and chemical manufacturing. They help improve sedimentation, filtration efficiency, sludge separation, and overall treatment performance.
Demand is expected to remain strong as industries and utilities focus on wastewater reuse, discharge compliance, and better process efficiency. Coagulants and flocculants will continue to remain essential because they are used in both primary and secondary treatment stages.
By End Use
Power generation held 32.1% share of the Wastewater Chemicals Market. This dominance is driven by the high volume of wastewater generated from cooling towers, boilers, flue gas desulfurization systems, ash handling, and plant cleaning operations.
Wastewater chemicals are used in power plants for coagulation, pH adjustment, scale control, corrosion control, sludge conditioning, and contaminant removal. These chemicals help maintain water quality, protect equipment, and reduce the environmental impact of plant operations.
The segment is expected to remain a major demand area as power producers focus on water recycling and operational reliability. Thermal power plants, combined cycle plants, and industrial captive power units will continue to require effective wastewater treatment chemicals.
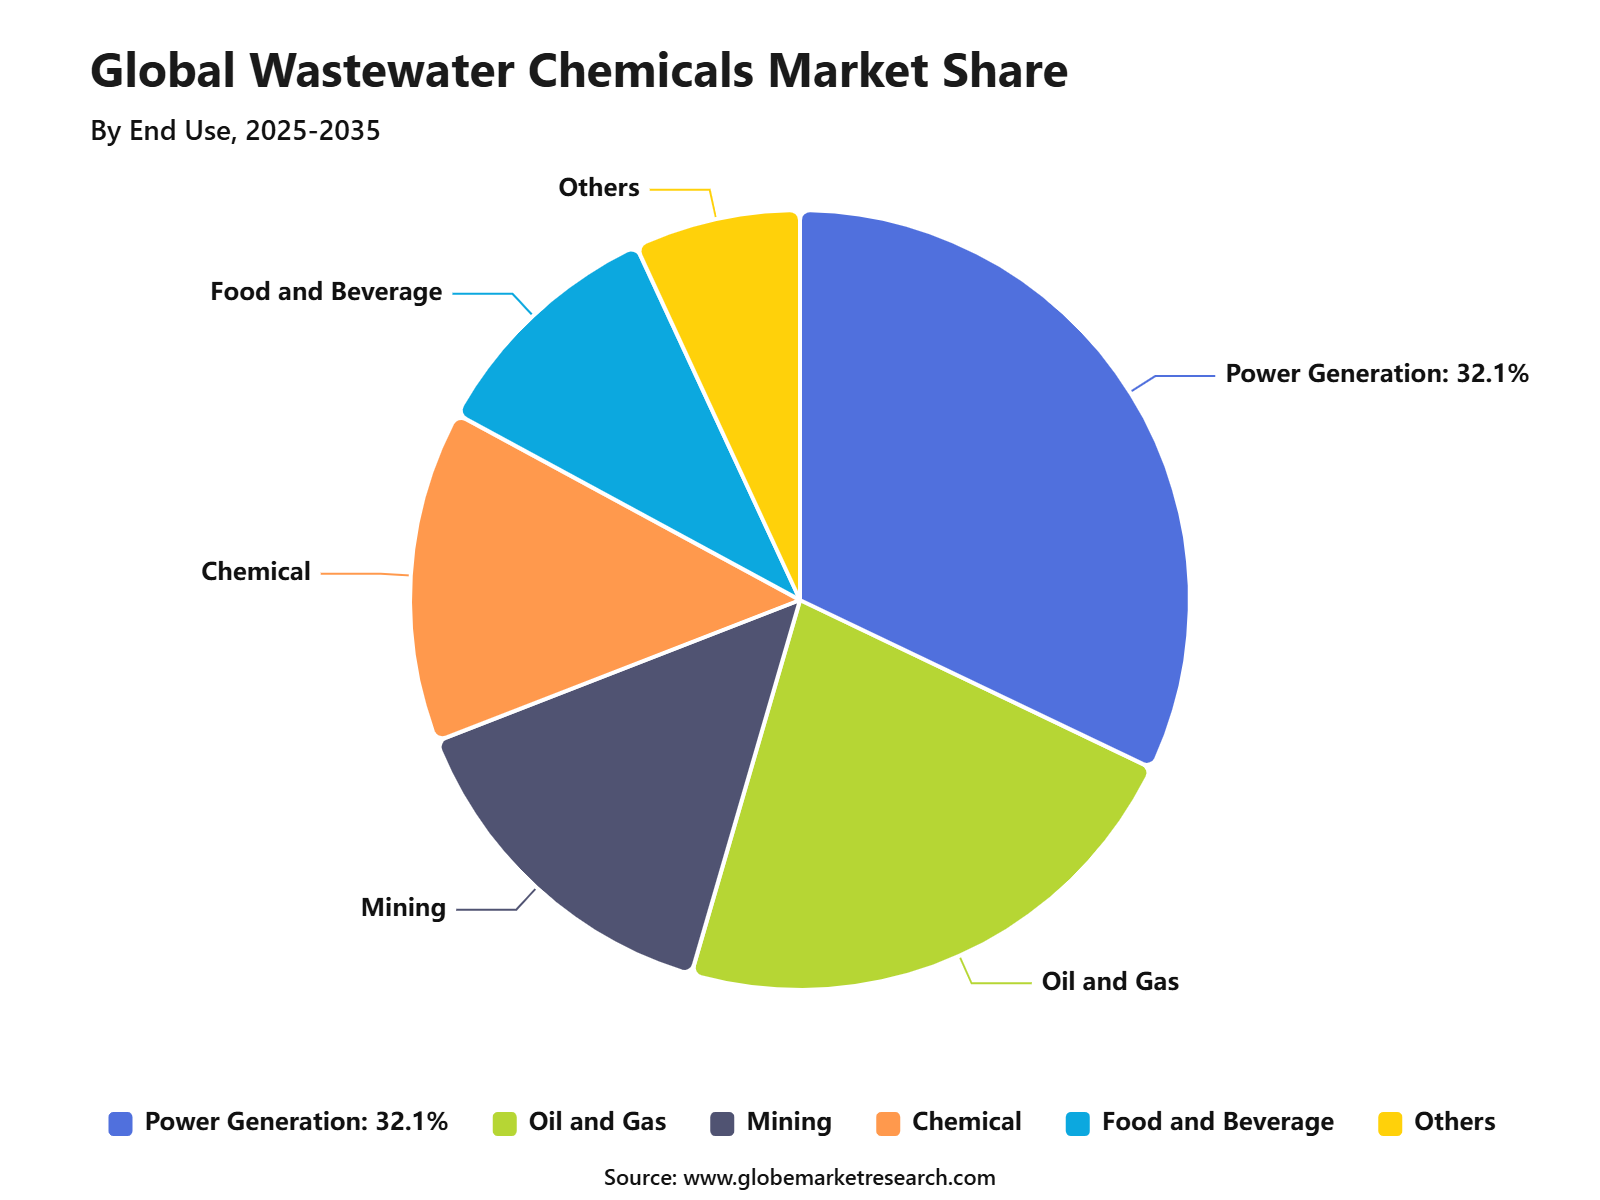 iThe graph shows projected market growth until 2035 based on CAGR analysis. Actual outcomes may vary depending on changing demand, competition, and economic factors.To gain greater insights - request a sample report PDF
By Region
Asia Pacific accounted for 40.5% share of the Wastewater Chemicals Market, making it the leading regional market. Growth is supported by rapid industrialization, urban expansion, rising power demand, and increasing wastewater treatment requirements across major economies.
China, India, Japan, South Korea, Indonesia, Vietnam, and other Southeast Asian countries are key demand centers. The region has strong wastewater chemical consumption from power generation, municipal utilities, chemicals, textiles, food processing, mining, and manufacturing industries.
Asia Pacific is expected to maintain its leading position as governments and industries increase investment in wastewater treatment infrastructure. Rising focus on water reuse, industrial discharge control, and cleaner production will continue to support regional demand.
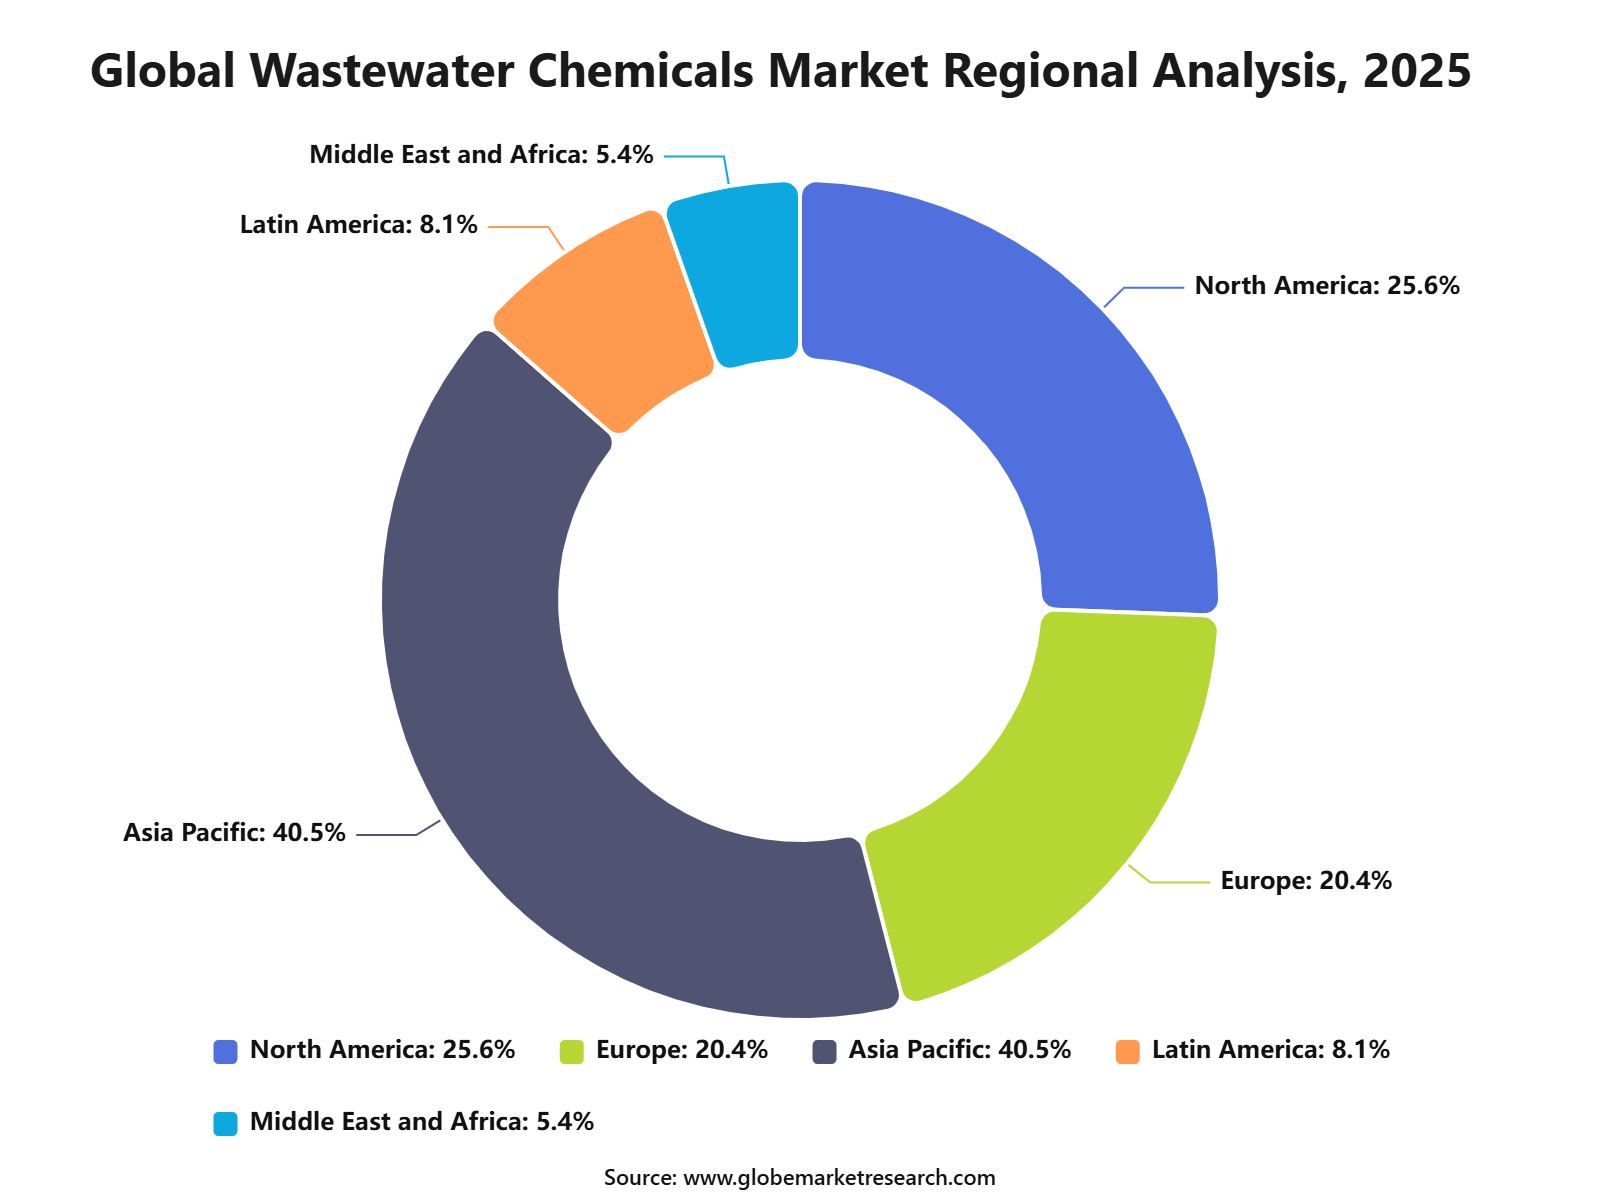 iThe graph shows projected market growth until 2035 based on CAGR analysis. Actual outcomes may vary depending on changing demand, competition, and economic factors.To gain greater insights - request a sample report PDF
Regional Impact Analysis
Asia Pacific leads the Wastewater Chemicals Market with 40.5% share in 2025, supported by rapid urban growth, industrial wastewater treatment, water scarcity, and expanding public sanitation infrastructure. China and India remain major contributors due to large municipal networks, manufacturing output, and increasing wastewater compliance needs.
North America remains important because of industrial water treatment, aging wastewater infrastructure, and demand for advanced treatment solutions. Europe supports value demand through strict discharge rules, nutrient removal requirements, circular water use, and strong environmental standards.
Impact Factor | Estimated CAGR Impact | Regional Relevance | Market Impact |
|---|---|---|---|
Asia Pacific market leadership | +2.2% | Asia Pacific, 40.5% share in 2025 | Leads global demand. |
China municipal and industrial treatment | +1.4% | China | Drives regional consumption. |
India sanitation and water reuse demand | +1.1% | India | Supports future growth. |
North America advanced treatment demand | +0.8% | U.S. and Canada | Adds value growth. |
Europe nutrient removal and compliance | +0.7% | Germany, France, UK, Italy | Supports premium solutions. |
Go-To-Market and Sales Economics
Wastewater chemicals are sold through municipal tenders, industrial supply contracts, EPC partners, chemical distributors, and treatment-service providers. Demand is led by coagulants, flocculants, pH adjusters, disinfectants, biocides, antifoams, and sludge-conditioning chemicals. The U.S. EPA reported USD 630.1 billion in clean water infrastructure needs, creating a large replacement and upgrade pipeline.
Sales economics are recurring because chemicals are consumed daily across primary, secondary, tertiary, and sludge-treatment operations. EPA’s latest needs data includes USD 66.6 billion for secondary wastewater treatment and USD 83.6 billion for advanced wastewater treatment. These assets require continuous chemical dosing, process control, monitoring, maintenance, and operator support.
Industrial customers create higher-value sales because food, beverage, chemicals, mining, pulp, paper, and semiconductors need reliable effluent control. Kemira reported Q1 2026 revenue of EUR 677.3 million, and its Water Solutions revenue stayed close to the previous year despite weak market conditions, showing resilient demand for water-treatment chemistry.
Risk Factors & Market Barriers
The main barrier is cost sensitivity, especially for small municipalities and price-driven industrial customers. Chemical spend can rise when influent quality changes, sludge volumes increase, or stricter discharge limits require additional dosing. Budget pressure is visible in U.S. wastewater and stormwater, where the 2024 annual capital funding gap was USD 69 billion.
Regulatory change can increase demand but also raise compliance complexity. The revised EU Urban Wastewater Treatment Directive entered into force on January 1, 2025, and from 2026 onward, utilities and industries must prepare for stricter collection, treatment, and micropollutant-removal rules. This increases chemical testing, validation, and documentation needs.
Adoption barriers include chemical handling safety, storage limits, corrosion risk, sludge-disposal cost, operator training, and variable wastewater loads. Developing regions face stronger funding constraints, as WHO and UNICEF reported that 3.4 billion people still lacked safely managed sanitation in 2025, showing that need remains high but affordability is uneven.
Revenue Potential Analysis
Revenue Landscape Across
Revenue is spread across municipal wastewater plants, industrial effluent systems, sludge treatment, odor control, nutrient removal, oil-water separation, disinfection, and water reuse. EPA reported USD 7.7 billion in U.S. water reuse needs and USD 74.7 billion for decentralized wastewater systems, supporting chemical demand beyond large centralized plants.
Europe is becoming a stronger compliance-led revenue base. The revised wastewater rules introduce extended producer responsibility for pharmaceutical and cosmetic producers, requiring them to cover at least 80% of micropollutant-removal costs by December 31, 2028. This supports future demand for advanced treatment chemicals, activated carbon, and process optimization.
Large water technology providers are expanding the revenue landscape through treatment systems and services. Veolia reported Q1 2026 group revenue of EUR 11,427 million, with Water growth of 2.0%. Its Water Technologies revenue reached EUR 1,061 million, up 4.3% excluding divestitures, showing steady demand from municipal and industrial customers.
Financial Impact
Wastewater chemicals create financial value by improving treatment efficiency, reducing permit violations, lowering sludge-handling risk, and protecting plant uptime. The financial case is strongest where chemicals reduce biological process instability, improve solids removal, and prevent emergency discharge events. This makes performance reliability more important than the lowest chemical price.
For suppliers, financial performance depends on raw material cost, logistics, contract length, technical service, and dosing optimization. Kemira’s Q1 2026 results showed stable sales volumes but lower sales prices year over year, indicating margin pressure even when demand remains steady. This makes value-based selling and customer retention critical.
The strongest financial impact is expected from plants using chemicals with automation, sensors, and service support. Xylem now forecasts full-year 2026 revenue of about USD 9.2 billion to USD 9.3 billion, up 2% to 3% reported, showing continued investment in water infrastructure and treatment solutions.
Drivers Impact Analysis
The Wastewater Chemicals Market is driven by rising demand for municipal wastewater treatment, industrial effluent control, sludge management, water reuse, and stricter discharge compliance. These chemicals help remove suspended solids, organic matter, metals, nutrients, pathogens, odor, and oil-based contaminants from wastewater streams.
Asia Pacific leads the market due to rapid urbanization, industrial expansion, rising water stress, and large investments in wastewater infrastructure. China, India, Japan, South Korea, and Southeast Asia remain key demand centers because of growing municipal treatment needs and strong manufacturing activity.
Impact Factor | Estimated CAGR Impact | Regional Relevance | Market Impact |
|---|---|---|---|
Rising municipal wastewater treatment demand | +1.6% | Asia Pacific, Europe, North America | Drives core chemical consumption. |
Industrial effluent treatment expansion | +1.4% | China, India, Southeast Asia, U.S. | Supports recurring demand. |
Stricter discharge regulations | +1.2% | Asia Pacific, Europe, North America | Increases compliance spending. |
Growth in water reuse and recycling | +1.0% | Water-stressed regions | Builds long-term demand. |
Sludge treatment and odor control needs | +0.8% | Urban and industrial facilities | Adds specialized chemical use. |
Restraints Impact Analysis
The market faces restraints from chemical handling risks, high operating costs, and rising preference for lower-chemical or biological treatment methods. Treatment plants must manage dosing, storage, worker safety, and by-product disposal carefully.
Another restraint is raw material price volatility. Coagulants, flocculants, pH adjusters, biocides, and specialty treatment chemicals can face cost pressure due to changes in energy, feedstock, logistics, and regulatory compliance expenses.
Impact Factor | Estimated CAGR Impact | Regional Relevance | Market Impact |
|---|---|---|---|
High chemical dosing and operating cost | -0.9% | Municipal and industrial plants | Pressures treatment budgets. |
Chemical storage and handling risks | -0.8% | Global wastewater facilities | Raises safety requirements. |
Raw material price volatility | -0.7% | Chemical suppliers and buyers | Affects margins. |
Shift toward biological treatment methods | -0.6% | Mature treatment markets | Reduces chemical intensity. |
Sludge disposal and residual concerns | -0.5% | Regulated regions | Adds compliance burden. |
Opportunities Impact Analysis
Opportunities are strong in coagulants, flocculants, pH adjusters, disinfectants, antifoaming agents, corrosion inhibitors, odor control chemicals, and sludge dewatering chemicals. These products benefit from recurring treatment demand across municipal utilities, food processing, textiles, pulp and paper, chemicals, oil and gas, and metals.
Higher-value opportunities are also emerging in water reuse chemicals, nutrient removal solutions, advanced oxidation support chemicals, and digital dosing services. Companies that improve treatment efficiency while reducing chemical consumption can capture stronger long-term demand.
Impact Factor | Estimated CAGR Impact | Regional Relevance | Market Impact |
|---|---|---|---|
Coagulant and flocculant demand | +1.5% | Asia Pacific, Europe, North America | Builds core market value. |
Sludge dewatering chemical expansion | +1.2% | Municipal and industrial plants | Supports waste reduction. |
Water reuse treatment chemicals | +1.0% | India, China, Middle East, U.S. | Creates future growth. |
Nutrient removal chemical solutions | +0.8% | Regulated wastewater markets | Adds compliance value. |
Digital dosing and service models | +0.7% | Large treatment facilities | Improves recurring revenue. |
Challenges Impact Analysis
The main challenge is achieving consistent treatment performance across wastewater streams with changing pollutant loads. Industrial wastewater often varies by process, season, production level, and contaminant type, which makes chemical selection and dosing more complex.
Another challenge is reducing chemical overuse while maintaining compliance. Excess dosing can increase operating cost, sludge volume, and residual management issues, while underdosing can lead to poor effluent quality.
Impact Factor | Estimated CAGR Impact | Regional Relevance | Market Impact |
|---|---|---|---|
Variable wastewater composition | -0.8% | Industrial treatment plants | Increases treatment complexity. |
Reducing chemical overuse | -0.7% | Large municipal and industrial sites | Improves cost control. |
Managing sludge volume | -0.6% | Urban wastewater systems | Adds disposal pressure. |
Maintaining stable effluent quality | -0.5% | Regulated treatment facilities | Affects compliance results. |
Selecting site-specific chemical programs | -0.4% | Multi-industry users | Requires technical expertise. |
Segment Covered in the Report
By Type
Coagulants and Flocculants
Corrosion Inhibitors
Scale Inhibitors
Biocides and Disinfectants
Chelating Agents
Anti-foaming Agents
pH Adjusters and Stabilizers
Others
By End Use
Oil and Gas
Mining
Chemical
Food and Beverage
Others
By Region
North America
Europe
Asia Pacific
Latin America
Middle East and Africa
Market Trend Analysis
The market trend is moving toward high-performance coagulants, polymer flocculants, sludge conditioning chemicals, odor control products, nutrient removal chemicals, and water reuse solutions. Demand is growing as treatment plants focus on better removal efficiency and lower lifecycle cost.
Digital dosing and real-time water quality monitoring are also becoming more important. Better monitoring helps operators reduce chemical waste, improve process stability, and respond faster to changes in wastewater quality.
Impact Factor | Estimated CAGR Impact | Regional Relevance | Market Impact |
|---|---|---|---|
High-performance coagulants gain use | +1.4% | Asia Pacific, Europe, North America | Improves removal efficiency. |
Polymer flocculants remain important | +1.2% | Municipal and industrial treatment | Supports solids separation. |
Sludge conditioning demand increases | +1.0% | Urban wastewater plants | Reduces disposal burden. |
Water reuse chemical programs expand | +0.8% | Water-stressed regions | Supports recycling goals. |
Digital dosing optimization rises | +0.7% | Advanced treatment facilities | Reduces chemical wastage. |
Investor Type Impact Matrix
Investors should focus on wastewater chemical companies with strong product portfolios, reliable distribution, technical service capability, and exposure to municipal, industrial, and water reuse customers. Recurring chemical consumption and compliance-led demand make the market attractive.
Strategic investors can also target coagulant suppliers, flocculant producers, sludge treatment companies, membrane pretreatment chemical providers, and digital dosing service firms. Companies that reduce chemical waste, improve effluent quality, and lower treatment cost are better positioned for long-term growth.
Investor Type | Estimated CAGR Impact | Regional Relevance | Market Impact |
|---|---|---|---|
Wastewater Chemical Producers | +1.4% | Global | Expands treatment chemical supply. |
Coagulant and Flocculant Suppliers | +1.2% | Asia Pacific, Europe, North America | Supports core treatment demand. |
Sludge Treatment Chemical Providers | +1.0% | Municipal and industrial plants | Builds recurring demand. |
Membrane Pretreatment Chemical Firms | +0.8% | Advanced treatment and reuse systems | Improves system reliability. |
Strategic Water Technology Investors | +0.6% | Global wastewater markets | Funds advanced treatment solutions. |
Recent Developments
April 2026: Ecolab’s Q1 2026 update highlighted new customer wins from water management solutions, digital intelligence and global service expertise. Its Nalco Water platform continued supporting wastewater treatment from primary clarification to discharge.
April 2026: Kemira reiterated 2026 revenue guidance of EUR 2.6 billion to EUR 3.0 billion and operative EBITDA of EUR 470 million to EUR 570 million, supporting continued delivery of coagulants and polymers for water-intensive applications.
April 2026: SUEZ and Salinity Solutions launched the first Hybrid Batch Reverse Osmosis pilot for municipal wastewater reuse at the Béziers wastewater treatment plant in France, strengthening advanced reuse chemistry and process demand.
Competitive Landscape
The market is characterized by intense competition among established players and emerging companies. Strategic partnerships, mergers and acquisitions, and product innovation are key strategies employed by market participants.
Key Market Players
Ecolab Inc.
Kemira Oyj
SUEZ Water Technologies & Solutions
BASF SE
Solenis LLC
Kurita Water Industries Ltd.
SNF Group
Veolia Water Technologies
Lonza Group AG
Dow Chemical Company
Buckman Laboratories International, Inc.
Feralco AB
Baker Hughes Company
Thermax Limited
Shandong IRO Water Treatment Co., Ltd.
Other Key Players
Research Methodology
This market study is prepared using a combination of primary and secondary research. Primary research includes discussions with manufacturers, suppliers, distributors, consultants, industry experts, and end users. Secondary research covers company reports, government databases, trade associations, technical publications, regulatory sources, and trusted industry documents. The collected information is used to assess market demand, pricing trends, technology adoption, competitive activity, and regional performance.
AI language models are not used as primary data sources, and publicly available AI-generated content is not treated as market evidence. Computational tools may be used to support data processing, translation, data classification, and pattern identification. However, every published assessment is supported by verified sources, human review, and primary market discussions.
Market estimates are developed through top-down and bottom-up approaches and validated using data triangulation. Revenue, production, shipment, pricing, and application-level data are compared across multiple sources. Forecasts consider economic conditions, regulatory changes, investment activity, innovation, supply chain developments, and industry risks. All findings are reviewed through source verification and internal quality checks before publication.
Part I
Source Management & Input Data Standards
Who provides data, how sources are qualified, and what types of evidence are admissible.
Part II
Research Scope & Market Coverage
How we define the markets we assess and the parameters that govern each product.
Part III
Data Collection, Verification & Submission
The mechanics of gathering, cross-checking, and hierarchically ranking evidence.
Part IV
Assessment Determination & Quality Controls
How raw data becomes a published assessment — normalisation, expert judgement, and outlier exclusion.
Part V
Publication, Corrections & Revision
Our publication schedule, corrections policy, and methodology review cycle.
Part VI
Independence, Ethics & Complaints
Conflict-of-interest policies, editorial independence, and how clients raise concerns.
Google · Preferred Sources
Don't miss the latest market research insights and industry updates on Google.
Add Globe Market Research as a preferred source in the Google app to see our reports, analysis, and market stories in your news suggestions.
Meet the Team
This report was prepared by our expert analysts with deep industry knowledge and research experience.
Pratiksha K. is a Senior Research Analyst with more than five years of experience in market research, industry analysis, competitive intelligence, and business strategy. She has contributed to detailed market reports, customized research studies, company profiling, market sizing, trend analysis, and strategic consulting projects for clients across different regions. Her industry expertise covers Chemical and Material, Consumer Goods, Food & Beverages and Energy & Power. She closely evaluates changing customer requirements, technology developments, regulatory conditions, supply chain structures, investment activity, and competitive strategies to provide clear and practical market insights.
Sayali brings more than 7 years of experience to Globe Market Research, supporting the accuracy, clarity, and relevance of research content across multiple industries. She reviews market data, segment analysis, competitive insights, and industry trends to ensure each report meets strong quality standards and provides practical value to business decision-makers. Her expertise spans healthcare, information technology, consumer goods, and diverse cross-industry domains. With a strong focus on data reliability, structured analysis, and clear presentation, Sayali helps ensure that each research output delivers well-reviewed insights for clients, investors, consultants, and industry stakeholders.
Frequently Asked Questions
Related Reports
More in Chemical and Material
Sulfuric Acid Market to Hit USD 61.5 Billion by 2035
Sulfuric Acid Market Size, Share, Analysis By Raw Material (Elemental Sulfur, Base Metal Smelters, Pyrite Ore, Others), By Application (Fertilizers, Chemical Manufacturing, Metal Processing, Petroleum Refining, Textile, Automotive, Pulp and Paper, Others), By Distribution Channel (Direct Sales, Distributors), By Regional Insights, Business plan and Project Report, Investment Opportunities, Profitability, Industry Trends, Leading Companies and Growth Forecasts by 2026-2035
Powder Metallurgy Market to Hit USD 17.0 Billion by 2035
Powder Metallurgy Market Size, Share, Analysis By Material (Ferrous Metals, Non-Ferrous Metals, Others), By Process (Additive Manufacturing, Powder Metal Hot Isostatic Pressing, Conventional Powder Metallurgy), By Application (Automotive, Aerospace and Defense, Healthcare, Electrical and Electronics, Industrial Machinery, Others) , By Regional Insights, Business plan and Project Report, Investment Opportunities, Profitability, Industry Trends, Leading Companies and Growth Forecasts by 2026-2035
Bromine Market to Hit USD 1.5 Billion by 2035
Bromine Market Size, Share, Analysis By Derivative (Organobromine, Clear Brine Fluids, Hydrogen Bromide, Others), By Application (Flame Retardants, Oil and Gas Drilling, Biocides, PTA Synthesis, Plasma Etching, Pharmaceuticals, Energy Storage, Others), By End-Use Industry (Chemicals, Oil and Gas, Pharmaceuticals, Electrical and Electronics, Automotive, Agriculture, Others), By Regional Insights, Business plan and Project Report, Investment Opportunities, Profitability, Industry Trends, Leading Companies and Growth Forecasts by 2026-2035
Hydrogen Cyanide Market to Hit USD 5.95 Billion by 2035
Hydrogen Cyanide Market Size, Share, Analysis By Product Form (Hydrogen Cyanide Liquid, Hydrogen Cyanide Gas), By Application (Adiponitrile, Acetone Cyanohydrin, Sodium Cyanide and Potassium Cyanide, Methionine, Cyanuric Chloride, Others), By End-Use Industry (Chemicals, Mining and Metallurgy, Pharmaceuticals, Agriculture, Textiles, Others), By Regional Insights, Business plan and Project Report, Investment Opportunities, Profitability, Industry Trends, Leading Companies and Growth Forecasts by 2026-2035