

Revenue, 2026
USD 0.9 Bn
Forecast, 2035
USD 14.0 Bn
CAGR, 2026-2035
35.6%
Report Coverage
Global
Market Size and Forecast
According to Globe Market Research, the global AI Agent Observability Market was valued at USD 0.9 billion in 2026 and is projected to reach USD 14.0 billion by 2035, growing at a CAGR of 35.6% from 2026 to 2035. North America accounted for around 44.3% of the market, equivalent to approximately USD 0.40 billion in 2026. The region’s strong market position reflects early enterprise AI adoption, advanced cloud infrastructure, growing use of autonomous agents and increasing investment in AI governance, monitoring and security.
Key Parameter | Report Details |
|---|---|
Market Revenue, 2026 | USD 0.9 Billion |
Projected Revenue, 2035 | USD 14.0 Billion |
CAGR, 2026-2035 | 35.6% |
Largest Region | North America, 44.3% Share |
Market Concentration | Medium |
Forecast Period | 2026-2035 |
Key Market Insights
Tracing and evaluation led the offering segment with a 43.8% share, supported by rising demand to assess agent performance, identify execution errors, and improve response reliability across complex AI workflows.
Agent tracing accounted for a 35.6% share by capability, driven by the need to track agent actions, tool usage, decision paths, and interactions across multi-step processes.
Proprietary and closed models dominated the model type monitored segment with a 63.3% share, reflecting their widespread enterprise use and the need for stronger visibility into model behavior and performance.
Cloud deployment held a 69.1% share, supported by scalable infrastructure, faster implementation, centralized monitoring, and easier integration with cloud-based AI platforms.
Large enterprises captured a 74.6% share by organization size, driven by complex AI environments, higher governance requirements, and large-scale deployment of autonomous and semi-autonomous agents.
IT and telecommunications led the end-user industry segment with a 30.8% share, supported by extensive AI adoption in network management, software development, customer service, and infrastructure operations.
North America dominated the AI agent observability market with a 44.3% share, supported by early enterprise AI adoption, strong cloud infrastructure, and increasing investment in AI monitoring and governance solutions.
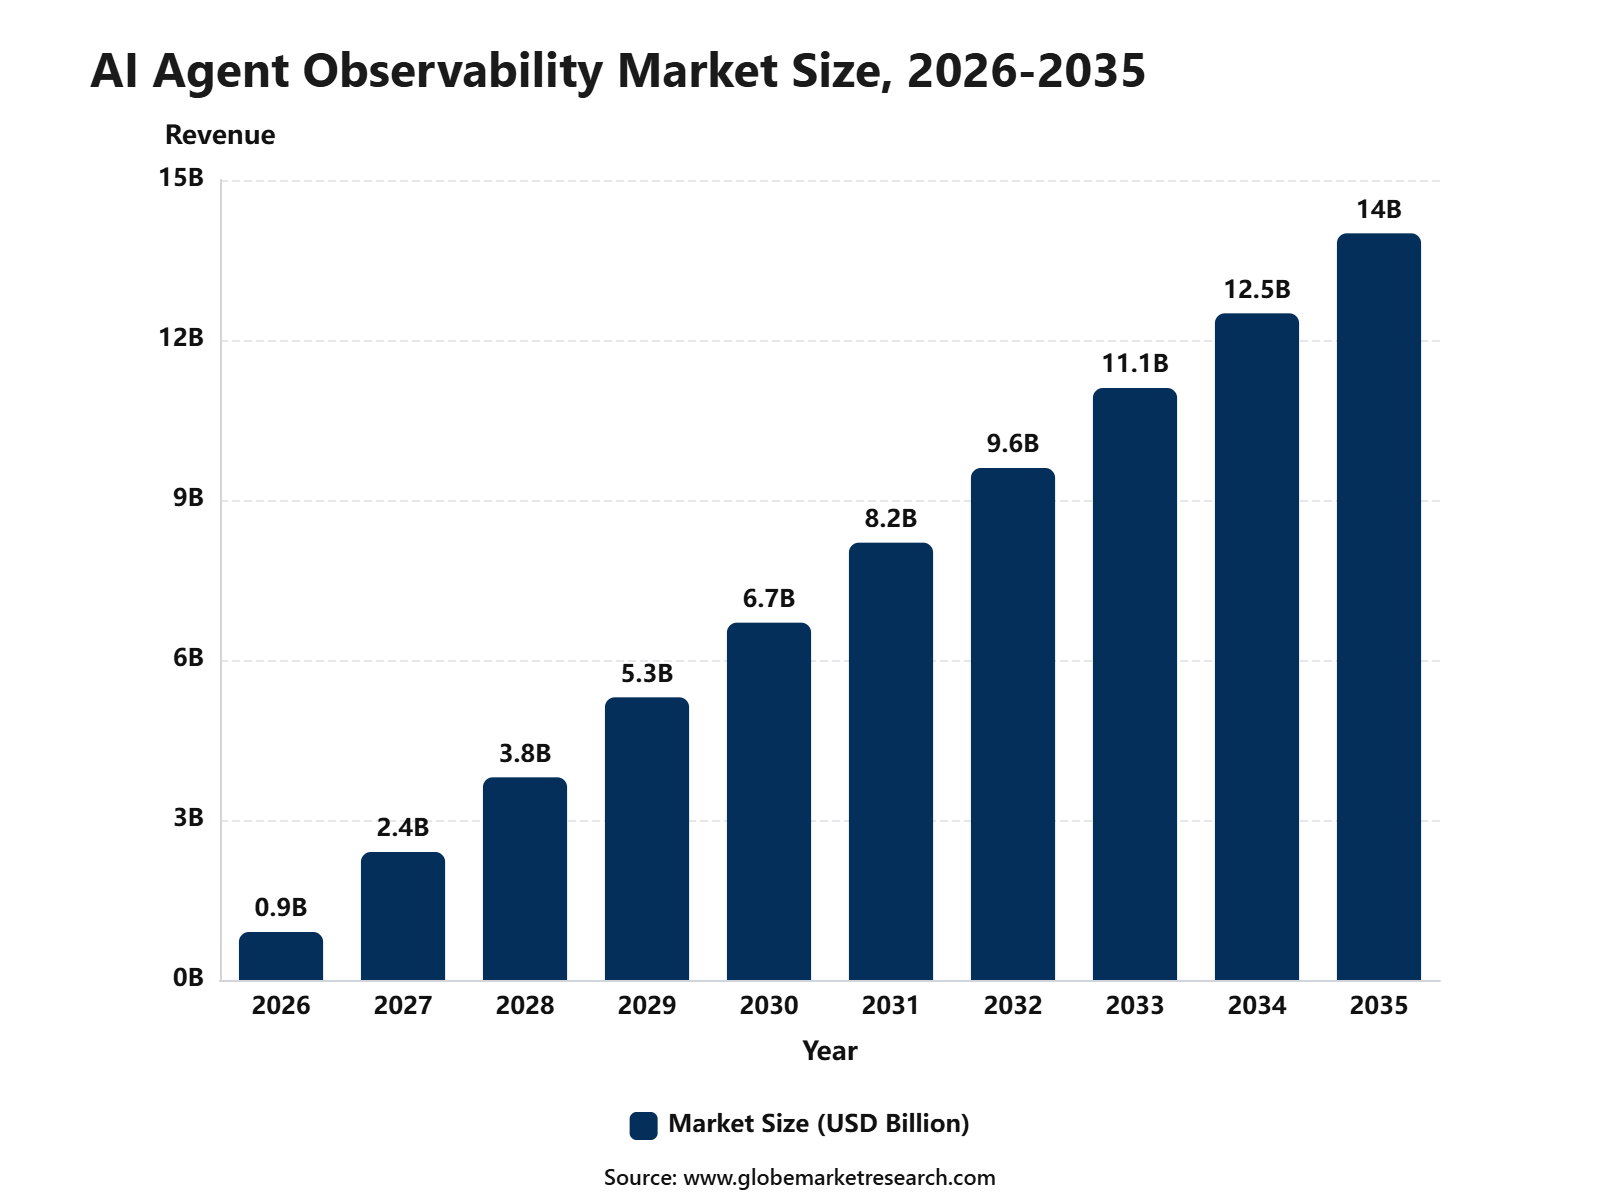 iThe graph shows projected market growth until 2035 based on CAGR analysis. Actual outcomes may vary depending on changing demand, competition, and economic factors.To gain greater insights - request a sample report PDF
What is the AI Agent Observability Market?
The AI agent observability market includes software platforms and services used to monitor, evaluate and improve the performance of autonomous and semi-autonomous AI agents. These solutions track prompts, responses, tool calls, workflows, token usage, latency, costs, errors and decision paths. They also support trace management, behavioural analysis, compliance monitoring, performance testing, incident detection and root-cause analysis across cloud-based, on-premises and hybrid environments.
Demand is being supported by the growing deployment of AI agents across customer service, software development, finance, cybersecurity and internal business operations. As agents connect with enterprise databases, applications and external tools, organisations require continuous visibility into their actions and outcomes. AI agent observability platforms help companies identify failures, control operating costs, detect abnormal behaviour, improve response accuracy and maintain reliable audit records.
Adoption Rate and Usage Statistics
Metric | Adoption Rate |
|---|---|
Agent Observability | 89% |
Detailed Tracing | 62% |
Production Observability | 94% |
Offline Evaluation | 52.4% |
Online Evaluation | 37.3% |
According to LangChain, Gravitee, and the Cloud Security Alliance, 71.5% of organizations with production agents used full tracing, while 44.8% conducted online evaluations. However, average agent monitoring coverage remained near 52%. Around 82% of enterprises discovered previously unknown agents, and 58% required at least five hours to detect and respond to agent-related incidents, highlighting demand for real-time tracing, alerting, evaluation, cost monitoring, and behavior analysis.
Metric | Monitoring Usage |
|---|---|
Full Production Tracing | 71.5% |
Production Online Evals | 44.8% |
Monitoring Coverage | Around 52% |
Unknown Agent Discovery | 82% |
Detection Delay | 58% take 5+ hours |
Offering Insights
Tracing and evaluation led the offering segment with 43.8% share. These solutions capture an AI agent’s prompts, model responses, tool calls, retrieval steps, decisions, errors, latency, token consumption, and final outputs throughout the execution process.
The segment leads because conventional application monitoring cannot fully explain why an agent selected a tool, produced an incorrect response, exceeded its cost limit, or failed to complete a task. Integrated tracing and evaluation help teams identify failure points, test output quality, compare model performance, and improve agents before wider deployment.
Cisco’s 2025 observability study covering 1,855 technology professionals found that 74% experienced improved employee productivity from observability, while 65% reported a positive influence on revenue. These results demonstrate the operational value of converting complex telemetry into measurable business improvements.
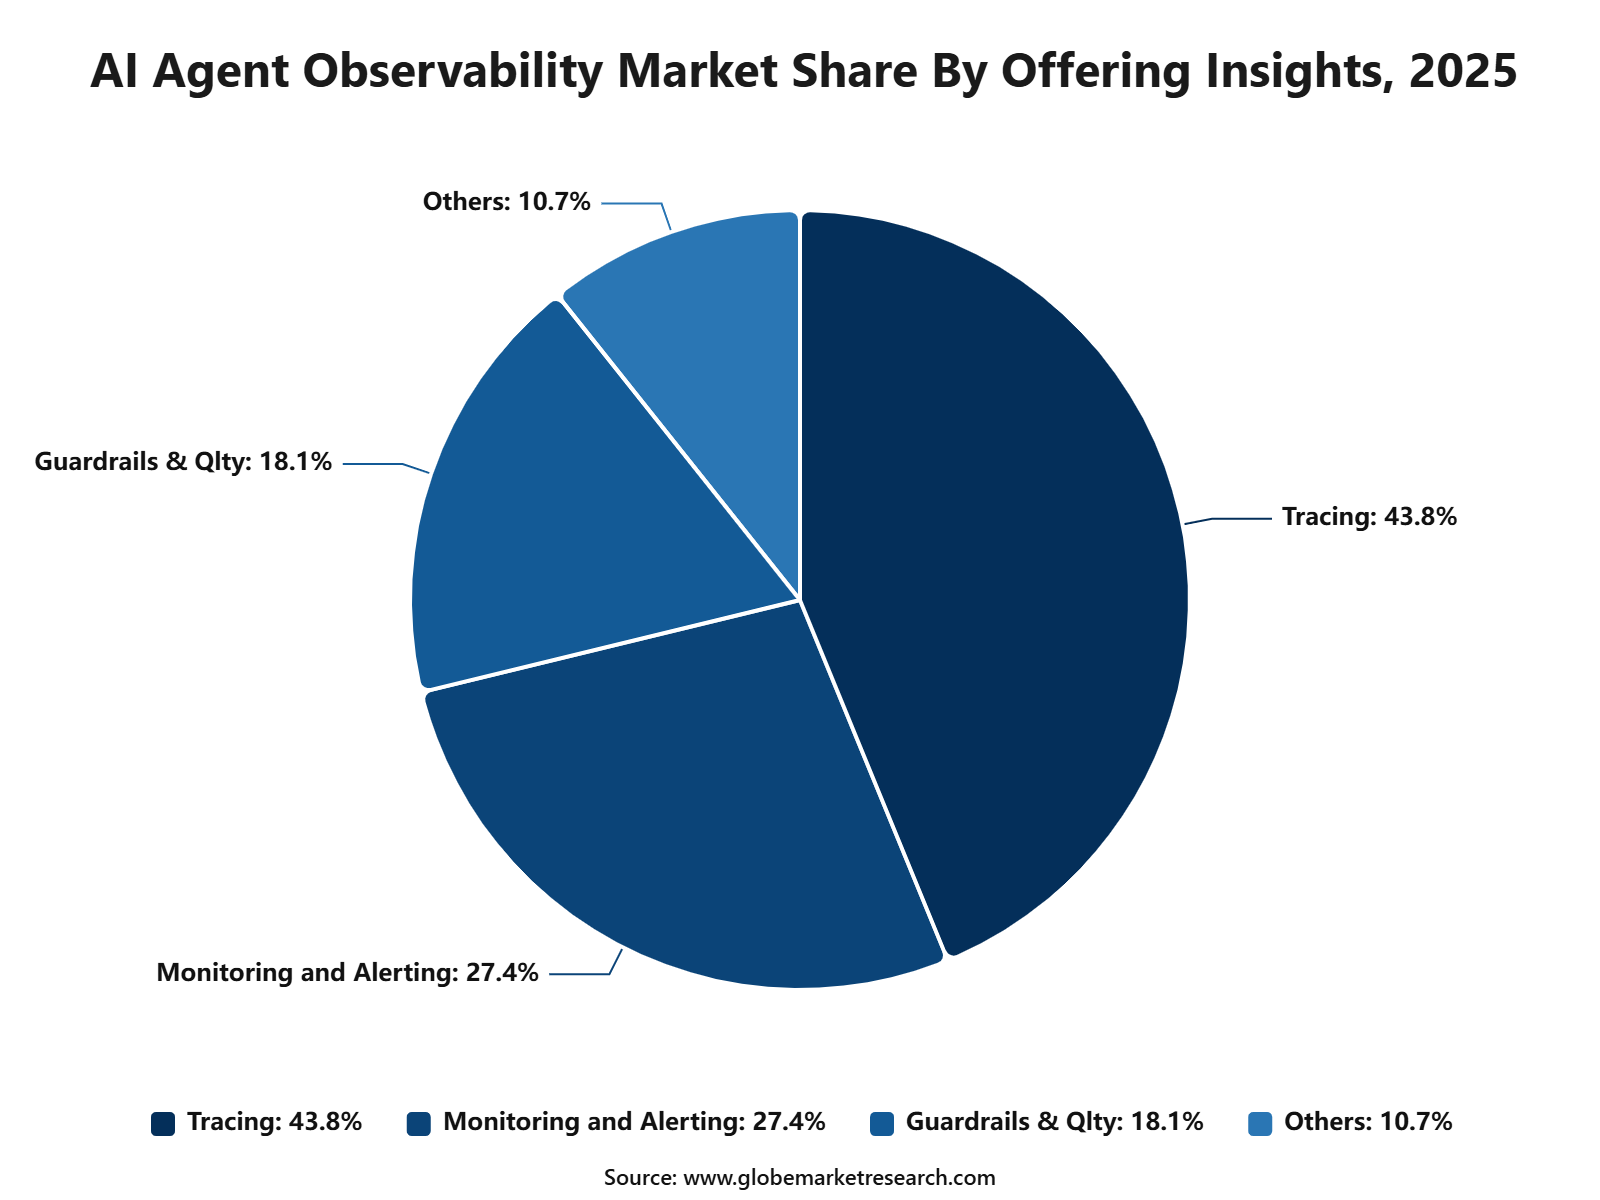 iThe graph shows projected market growth until 2035 based on CAGR analysis. Actual outcomes may vary depending on changing demand, competition, and economic factors.To gain greater insights - request a sample report PDF
Capability Insights
Agent tracing accounted for 35.6% share by capability. Agent tracing creates a sequential record of each reasoning step, model interaction, API request, database query, tool execution, memory retrieval, and human approval involved in completing a task.
This capability leads because AI agents commonly operate through several interconnected components. A final response alone may not reveal whether an error was caused by the model, an incorrect prompt, unavailable data, failed retrieval, excessive permissions, or an external tool. Detailed traces allow developers to reconstruct the complete execution path.
The 2025 OpenTelemetry Collector survey found that 25% of respondents collected traces, while 43% wanted stronger Collector observability. The findings indicate that trace adoption remains less mature than metrics and logs, creating opportunities for platforms that simplify agent-level instrumentation and analysis.
Capability | Market Share, 2025 (%) |
|---|---|
Agent Tracing | 35.6% |
Cost and Token Monitoring | 23.8% |
Latency and Performance Monitoring | 18.7% |
Prompt and Output Evaluation | 14.2% |
Others | 7.7% |
Model Type Monitored Insights
Proprietary and closed models held 63.3% share of the models monitored. These models include commercially licensed large language models accessed through managed APIs and enterprise cloud services. The segment leads because closed models are widely integrated into customer service, coding, document processing, analytics, knowledge management, and workflow automation.
Enterprises must monitor model availability, response accuracy, latency, token costs, policy compliance, safety performance, and changes introduced through provider-managed model updates. Enterprise data for 2025 showed that Anthropic captured 40% of enterprise large language model spending, followed by OpenAI with 27% and Google with 21%. Their combined 88% share illustrates the concentration of enterprise workloads around proprietary model providers and the resulting need for independent observability across multiple closed-model services.
Model Type Monitored | Market Share, 2025 (%) |
|---|---|
Proprietary and Closed Models | 63.3% |
Open-Source Models | 20.8% |
Fine-Tuned and Custom Models | 15.9% |
Deployment Insights
Cloud deployment led the market with 69.1% share. Cloud platforms provide centralized environments for collecting agent traces, evaluation results, model responses, usage information, security events, and infrastructure telemetry across distributed applications.
Cloud deployment leads because AI agents are commonly built using cloud-hosted models, vector databases, APIs, data platforms, and orchestration frameworks. Cloud observability solutions can be deployed quickly, scaled with agent traffic, integrated across development environments, and updated without maintaining separate monitoring infrastructure at every location.
Grafana’s 2026 global observability survey, based on 1,363 responses, found that 49% of organizations used software-as-a-service observability in some form, representing a 14% annual increase. This movement toward managed observability supports cloud-based AI-agent monitoring, particularly where workloads operate across several services and infrastructure environments.
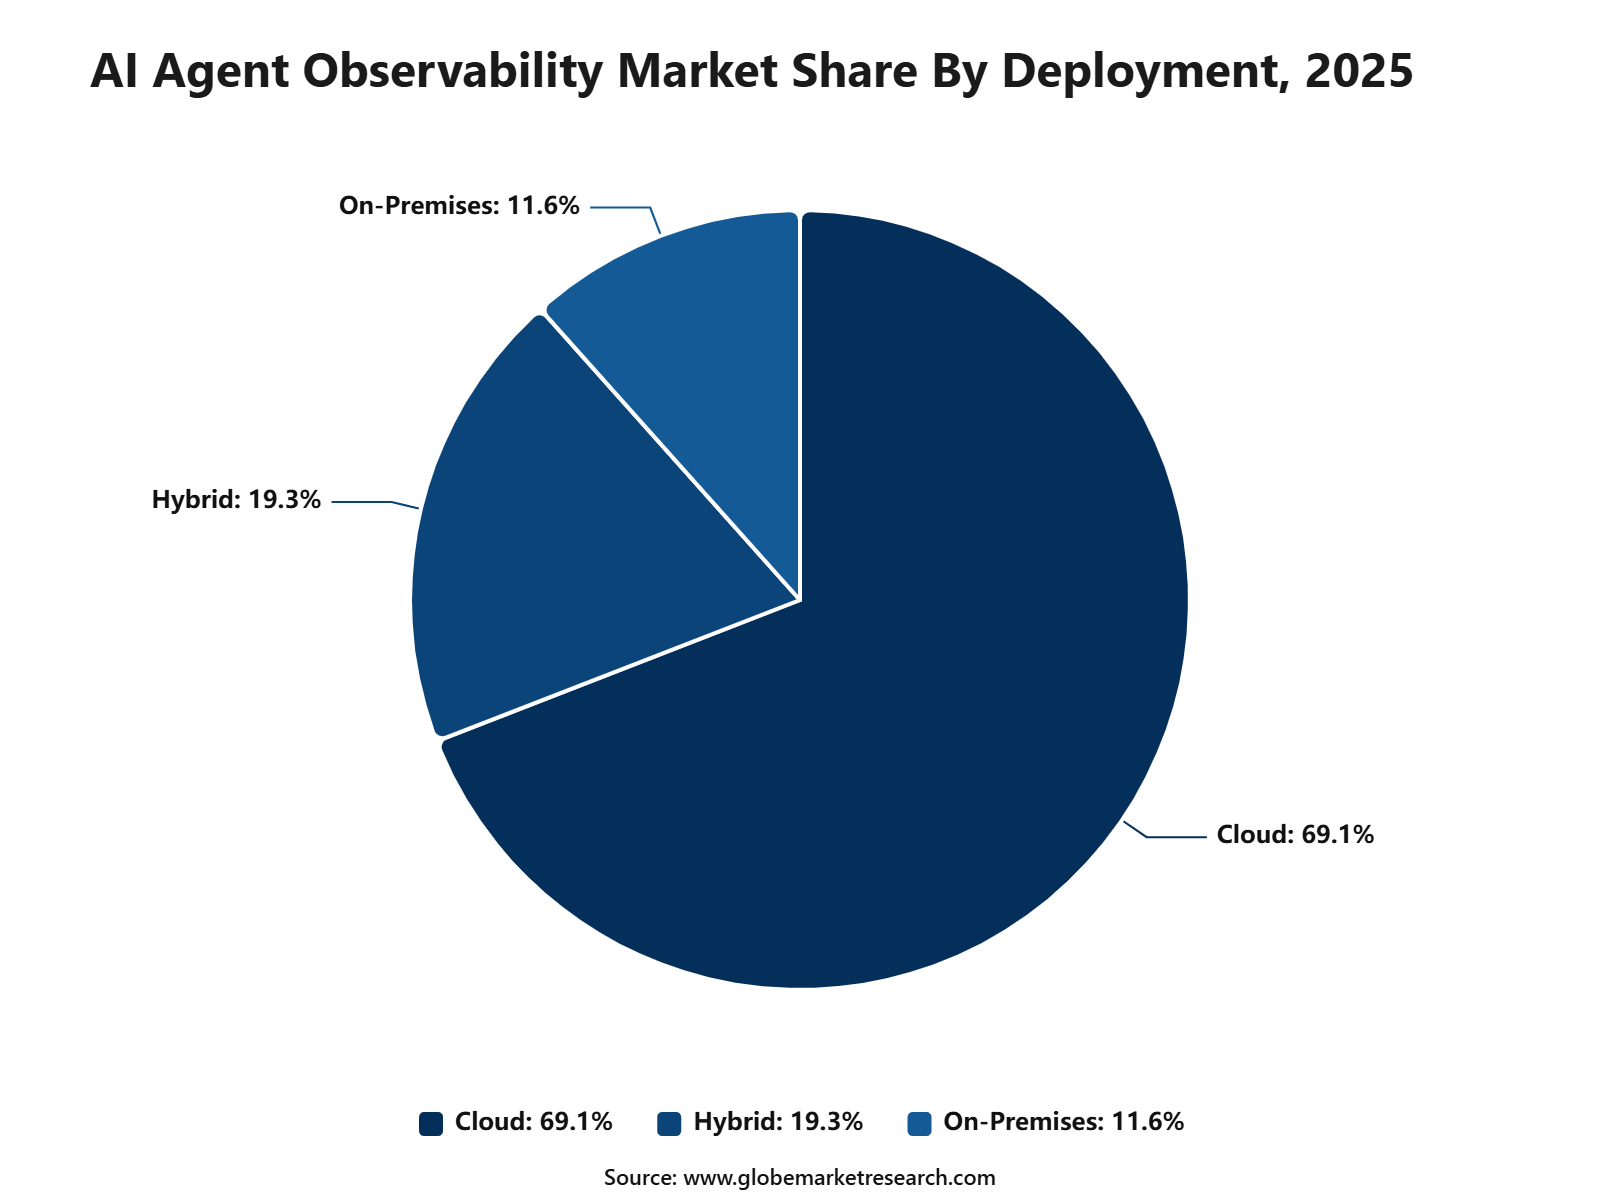 iThe graph shows projected market growth until 2035 based on CAGR analysis. Actual outcomes may vary depending on changing demand, competition, and economic factors.To gain greater insights - request a sample report PDF
Organization Size Insights
Large enterprises accounted for 74.6% share. These organizations operate extensive application portfolios, cloud environments, databases, automated workflows, business systems, and customer-facing services where several AI agents may interact simultaneously.
Large enterprises require advanced observability because agent failures can affect thousands of employees, customers, transactions, or operational processes. Centralized platforms help teams control performance, detect unexpected behavior, investigate incidents, manage model costs, verify regulatory compliance, and compare agent quality across departments and geographical markets.
IBM’s 2025 CEO study found that 61% of chief executives said their organizations were actively adopting AI agents and preparing to implement them at scale. As deployment moves from limited pilots to enterprise-wide operations, demand is being created for continuous tracing, evaluation, governance, and performance monitoring.
Organization Size | Market Share, 2025 (%) |
|---|---|
Large Enterprises | 74.6% |
Small and Medium Enterprises | 25.4% |
End-User Industry Insights
IT and telecommunications led the end-user industry segment with 30.8% share. Companies in this industry use AI agents for network management, software development, technical support, service assurance, cybersecurity, incident resolution, customer care, and infrastructure automation.
The industry leads because telecommunications and technology environments generate large volumes of operational data and involve highly interconnected systems. Observability platforms help identify failed tool calls, network-related delays, inaccurate recommendations, repeated agent loops, service disruptions, and changes in agent performance across production systems.
End-User Industry | Market Share, 2025 (%) |
|---|---|
IT and Telecommunications | 30.8% |
BFSI | 18.7% |
Healthcare | 13.4% |
Retail and E-commerce | 11.2% |
Manufacturing | 9.5% |
Others | 8.3% |
Government | 8.1% |
GSMA research published in 2025 found that 65% of telecommunications operators had adopted an AI strategy, while 41% were at an early deployment stage involving pilots or exploratory implementations. Expanding agent use across network and customer operations increases the need for reliable monitoring before applications are scaled.
Regional Insights
North America led the AI Agent Observability Market with 44.3% share. Regional leadership is supported by strong enterprise AI adoption, extensive cloud infrastructure, established observability practices, and the presence of major model developers, technology companies, and digital service providers.
The United States remains the primary contributor because organizations are rapidly integrating AI agents into software development, customer operations, financial services, healthcare, cybersecurity, and internal business workflows. These deployments require tools that can measure reliability, cost, safety, response quality, data access, and compliance across complex technology environments.
The United States hosted 5,427 data centres in 2025, more than ten times the number recorded in any other country. This large infrastructure base supports cloud computing, model inference, enterprise software, and AI-agent workloads, strengthening the regional requirement for scalable observability and performance-management systems.
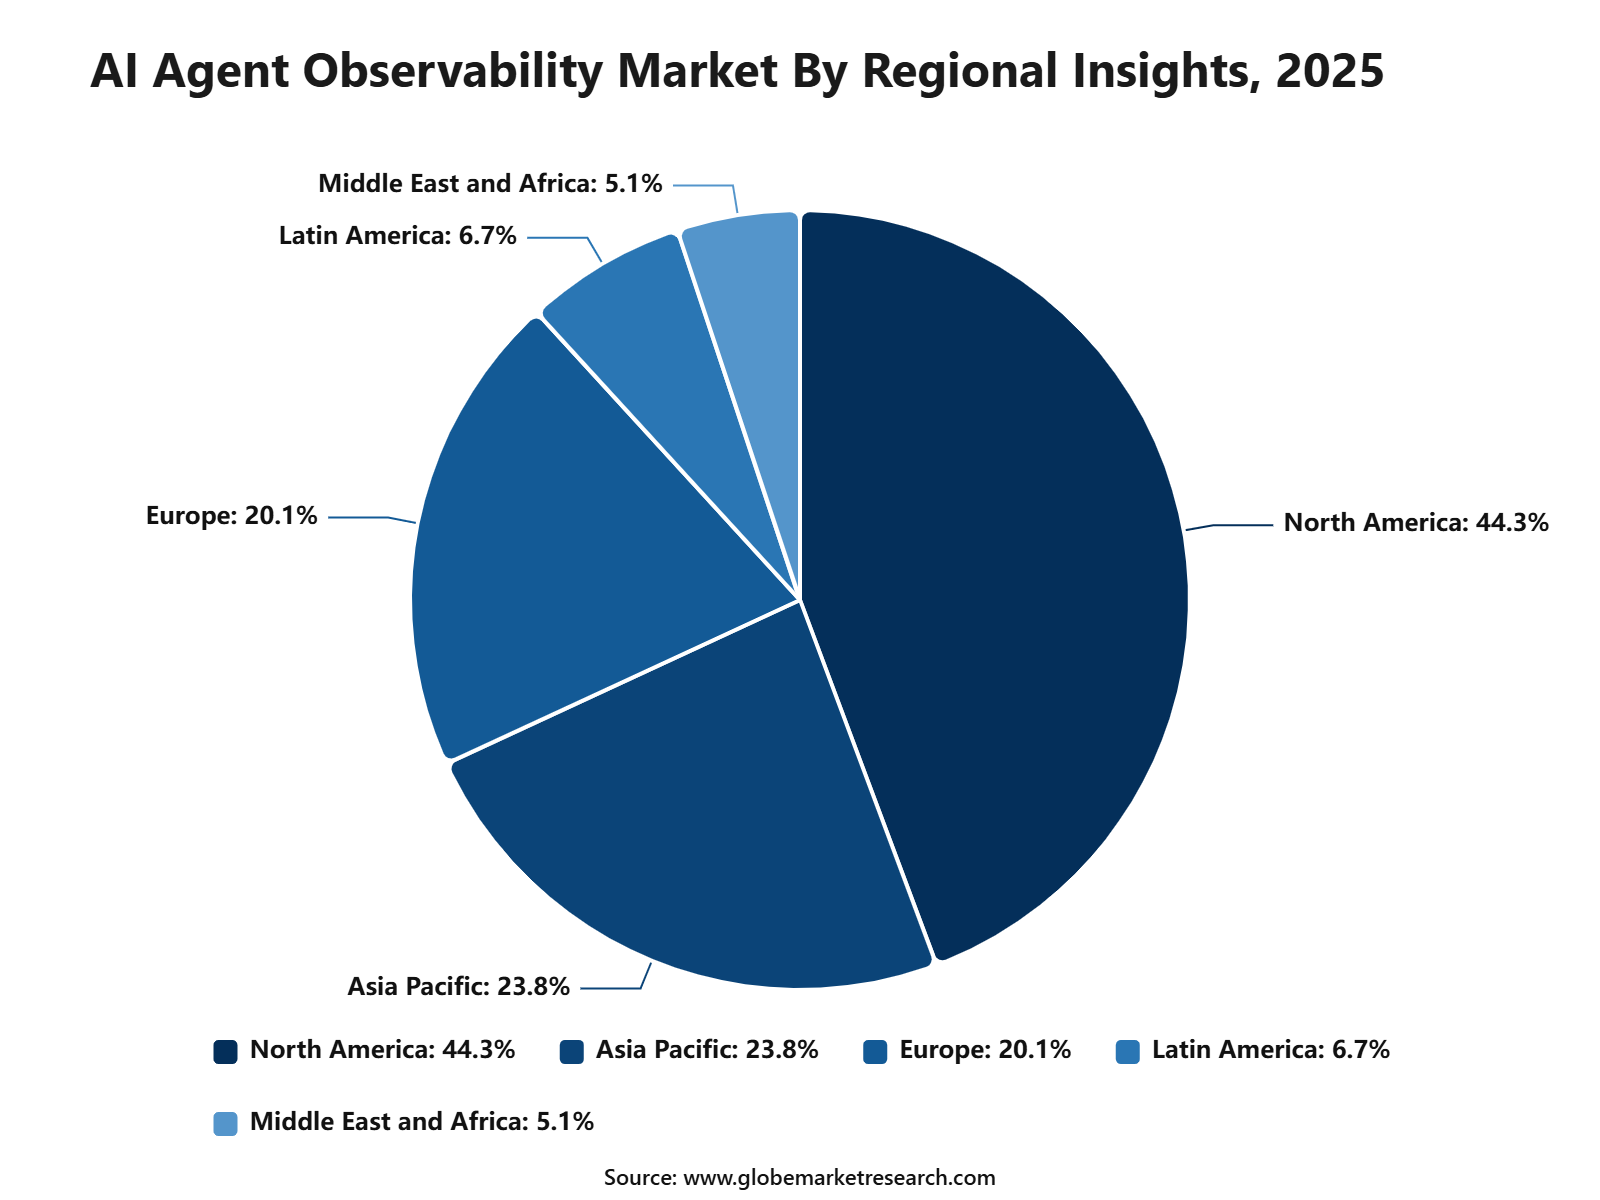 iThe graph shows projected market growth until 2035 based on CAGR analysis. Actual outcomes may vary depending on changing demand, competition, and economic factors.To gain greater insights - request a sample report PDF
Market Segmentation
By Offering
Monitoring and Alerting
Guardrails and Quality
Tracing and Evaluation
Others
By Capability
Cost and Token Monitoring
Latency and Performance Monitoring
Agent Tracing
Prompt and Output Evaluation
Others
By Model Type Monitored
Proprietary and Closed Models
Open-Source Models
Fine-Tuned and Custom Models
By Deployment
Cloud
On-Premises
Hybrid
By Organization Size
Small and Medium Enterprises
Large Enterprises
By End-User Industry
BFSI
IT and Telecommunications
Healthcare
Retail and E-commerce
Manufacturing
Government
Others
By Region
North America
Europe
Asia Pacific
Latin America
Middle East and Africa
Key Market Drivers
Rapid enterprise adoption of AI agents: Organizations are deploying agents across customer service, software development, research, finance, security, and administrative workflows. Production deployment requires visibility into each agent’s execution path, intermediate outputs, tool calls, errors, and final results.
Need to identify agent failures and performance drift: AI agents can hallucinate, silently regress, repeat actions, select inappropriate tools, or produce inconsistent results. NIST identifies performance degradation, drift detection, fragmented logging, and unpredictable system behaviour as important post-deployment monitoring challenges.
Growing complexity of multi-step agent workflows: A single request may involve several model calls, retrieval steps, tool executions, retries, and interactions with other agents. Distributed tracing is required to identify whether delays or failures were caused by the model, external tool, infrastructure, or orchestration layer.
Demand for cost and resource visibility: Agent workflows may generate high model usage because of repeated planning, long prompts, memory retrieval, and unnecessary tool calls. Observability platforms track token consumption, latency, session duration, error rates, and resource use to support cost control and performance optimization.
Increasing security and compliance requirements: Enterprises require evidence of what an agent accessed, which tools it used, what actions it completed, and whether security policies were followed. NIST has highlighted the need to constrain and monitor agent access in deployment environments.
Top 5 Emerging Trends
End-to-end agent tracing: Observability platforms are moving beyond model-level monitoring to trace complete workflows, including prompts, model responses, retrieval operations, reasoning steps, tool calls, retries, memory access, and final actions.
OpenTelemetry-based standardization: OpenTelemetry semantic conventions are creating common formats for recording agent traces, logs, metrics, token usage, tool activity, and model interactions. Standardized telemetry improves integration across different agent frameworks and monitoring platforms.
Trajectory-based agent evaluation: Evaluation is increasingly focused on the sequence of actions taken by an agent rather than only the final response. Metrics can examine whether required tools were selected, whether actions occurred in the correct order, and whether unnecessary steps were performed.
Real-time security and policy monitoring: Agent observability is being connected with security controls to detect unusual access, unsafe tool use, policy violations, excessive permissions, prompt injection, and unexpected actions during live execution.
Privacy-aware telemetry collection: Detailed traces can contain customer data, system prompts, tool arguments, credentials, and proprietary business information. Platforms are introducing configurable data capture, redaction, access controls, and retention policies. OpenTelemetry implementations generally avoid capturing full prompt and tool content by default because it may contain sensitive information.
Market Dynamics
Drivers Impact Analysis
The AI Agent Observability Market is driven by the rapid deployment of autonomous and semi-autonomous AI agents across enterprise operations. Organizations require greater visibility into agent decisions, tool usage, workflow execution, model outputs, latency, costs, errors, and interactions with enterprise applications.
North America leads the market due to strong enterprise AI adoption, advanced cloud infrastructure, high investment in generative AI, and the presence of major AI technology providers. The United States remains the main contributor, supported by growing deployment of AI agents across financial services, healthcare, software development, customer service, retail, and cybersecurity operations.
Impact Factor | Estimated CAGR Impact | Regional Relevance | Market Impact |
|---|---|---|---|
Rapid enterprise AI agent adoption | +7.2% | North America, Europe, Asia Pacific | Expands demand for agent monitoring, tracing, and performance analysis. |
Growth in autonomous business workflows | +6.4% | BFSI, technology, healthcare, retail | Increases requirements for continuous workflow visibility. |
Rising need for AI governance and accountability | +5.8% | North America, Europe, regulated industries | Supports audit trails, policy monitoring, and decision tracking. |
Expansion of multi-agent systems | +5.1% | Advanced enterprise AI environments | Creates demand for interaction and dependency monitoring. |
Increasing AI infrastructure spending | +4.5% | North America and global cloud markets | Supports deployment of scalable observability platforms. |
Restraints Impact Analysis
The market faces restraints from high platform costs, complex integration requirements, limited observability standards, and difficulty interpreting AI agent behaviour. Enterprises must connect observability platforms with AI models, agent frameworks, cloud services, databases, application programming interfaces, security tools, and existing monitoring systems.
Another restraint is the large volume of operational data generated by AI agents. Continuous collection of prompts, responses, traces, tool calls, logs, performance metrics, and user interactions can increase storage and processing costs. Organizations must also protect sensitive information contained within agent activity records.
Impact Factor | Estimated CAGR Impact | Regional Relevance | Market Impact |
|---|---|---|---|
High observability platform costs | -3.5% | Small and medium enterprises | Slows adoption among organizations with limited AI budgets. |
Complex integration with AI environments | -3.0% | Large and multi-cloud enterprises | Increases implementation time and technical requirements. |
Lack of common observability standards | -2.6% | Global AI technology ecosystems | Creates compatibility and data consistency issues. |
High data storage and processing requirements | -2.2% | High-volume AI agent deployments | Raises infrastructure and operational costs. |
Data privacy and confidentiality concerns | -1.8% | BFSI, healthcare, government | Restricts the collection and retention of agent activity data. |
Opportunities Impact Analysis
Opportunities are expanding in agent tracing, behavioural monitoring, prompt and response analysis, cost tracking, performance monitoring, anomaly detection, evaluation management, and compliance reporting. These capabilities help enterprises understand how AI agents operate, identify failures, and improve workflow reliability.
Higher-value opportunities are emerging in real-time agent monitoring, multi-agent observability, automated root-cause analysis, AI security integration, and industry-specific compliance platforms. Vendors that combine observability, governance, security, evaluation, and performance management can capture stronger demand from enterprises operating complex AI agent environments.
Impact Factor | Estimated CAGR Impact | Regional Relevance | Market Impact |
|---|---|---|---|
Real-time AI agent tracing | +7.0% | North America, Europe, Asia Pacific | Improves visibility into agent actions and workflow execution. |
Multi-agent observability platforms | +6.2% | Advanced AI and automation environments | Tracks communication and dependencies among multiple agents. |
Automated error and anomaly detection | +5.5% | Enterprise AI operations | Reduces troubleshooting time and operational disruption. |
AI cost and token usage monitoring | +4.8% | Cloud-based AI deployments | Helps organizations control infrastructure and model expenses. |
Compliance and audit reporting | +4.1% | BFSI, healthcare, government | Supports governance, accountability, and regulatory compliance. |
Challenges Impact Analysis
The main challenge is monitoring AI agents that operate dynamically across multiple applications, models, databases, and external tools. Traditional application monitoring systems may not provide sufficient visibility into agent reasoning, task planning, tool selection, memory usage, or autonomous decision-making.
Another challenge is identifying the cause of unreliable outputs. Agent failures may result from model errors, incorrect prompts, poor data quality, tool failures, permission issues, memory problems, or workflow design. Observability platforms must connect technical performance with business outcomes without creating excessive alerts or operational complexity.
Impact Factor | Estimated CAGR Impact | Regional Relevance | Market Impact |
|---|---|---|---|
Difficulty interpreting agent behaviour | -3.4% | Autonomous AI environments | Makes root-cause analysis and performance improvement difficult. |
Rapid evolution of AI agent frameworks | -3.0% | Global AI software markets | Requires frequent platform updates and integration changes. |
High volume of alerts and monitoring data | -2.5% | Large-scale enterprise deployments | Creates alert fatigue and slows incident investigation. |
Limited visibility across multi-agent workflows | -2.1% | Complex automation environments | Makes dependency and failure tracking difficult. |
Linking technical metrics to business outcomes | -1.7% | Enterprise AI users | Limits the measurement of agent value and operational impact. |
AI Agent Observability Market Case Study: Canva
Canva provides a practical example of how AI agent observability can support a large multi-agent customer-service system. Its Help Assistant routes customer requests to specialized agents, while Omni Agent handles complex, multi-step support cases and escalates unresolved requests to human teams. Langfuse is used to trace prompts, model responses, retrieval steps, tool calls, errors, warnings, latency and agent decisions across Canva’s Java and Python environments.
A four-person machine-learning team developed the system for a platform serving more than 250 million monthly active users. AI support now handles approximately 80% of user interactions. Canva evaluates agent performance across 15 to 20 metrics in development and production, while its quality-assurance team manually reviews between 20 and 100 production cases each week. Prompt versioning, replay testing and shadow-mode deployment allow changes to be tested before they affect customers.
Demand for AI agent observability is being supported by the need to monitor agent reasoning, tool use, response accuracy, token consumption, costs, latency, safety and business outcomes. A 2026 survey of more than 1,300 professionals found that 57.3% had deployed agents in production, 89% had implemented some form of agent observability and 62% used detailed tracing for individual steps and tool calls. Quality was identified as the leading production barrier by nearly one-third of respondents, while 20% cited latency, strengthening demand for tracing, evaluation, alerting and real-time performance monitoring platforms.
Recent Developments
January 2026, Fiddler introduced an AI control-plane strategy for autonomous agents: The platform was designed to provide standardised telemetry, continuous monitoring, evaluations, policy enforcement, root-cause analysis, and auditable governance across models, tools, APIs, and multi-step agent workflows. Fiddler stated that its platform is intended to show what agents are doing and provide context explaining their behaviour.
January 2026, Dynatrace made its AI Observability application generally available: The platform added expanded support for agent frameworks and protocols while combining OpenTelemetry and OpenLLMetry data in a correlated observability model. It provides visibility across agents, models, orchestration layers, tools, guardrail outcomes, and cloud infrastructure operating on AWS, Microsoft Azure, and Google Cloud.
February 2026, New Relic launched an Agentic Platform for observability teams: The no-code platform allows site reliability engineering and operations teams to build, deploy, govern, and manage custom agents directly within the observability environment. Its capabilities include visual workflow creation, pre-built operational agents, multi-step reasoning, incident investigation, and automated remediation.
March 2026, Monte Carlo introduced end-to-end Agent Observability: The platform monitors four primary areas covering context, performance, behaviour, and outputs. It tracks token consumption, latency, error rates, workflow execution, data quality, hallucinations, and evaluation results across the complete agent lifecycle rather than monitoring individual model calls in isolation.
Mergers
February 2026, Datadog and Sakana AI formed a strategic partnership: The companies agreed to collaborate on AI research, product development, open-source contributions, and go-to-market activities. The initial focus is on helping Japanese enterprises monitor the performance, reliability, and operational impact of advanced AI applications before expanding the partnership globally.
January 2026, Dynatrace expanded interoperability across the agent ecosystem: The company added support for multiple agent frameworks and protocols through OpenTelemetry and OpenLLMetry. This standards-based approach allows enterprises to correlate information from different models, agents, tools, and cloud platforms without requiring a corporate combination between technology providers.
Acquisitions
January 2026, ClickHouse acquired Langfuse: Langfuse provides open-source observability, evaluations, datasets, and prompt-management tools for LLM applications and AI agents. The platform remained open source and self-hostable following the transaction, while the Langfuse team joined ClickHouse to continue product development.
January 2026, Snowflake agreed to acquire Observe: The transaction was intended to combine Observe’s logs, metrics, traces, context graph, and AI site reliability engineering tools with Snowflake’s AI Data Cloud. Snowflake stated that the combined architecture would support the large telemetry volumes generated by AI agents and data-intensive applications.
January 2026, Palo Alto Networks completed its acquisition of Chronosphere: The acquisition established Palo Alto Networks’ observability platform and involved total purchase consideration of approximately USD 3.0 billion. Chronosphere contributes cloud-native telemetry collection and observability capabilities designed to manage large volumes of logs, metrics, and traces.
January 2026, Datadog acquired Propolis: Propolis develops autonomous quality-assurance agents that explore applications, identify user journeys, and generate synthetic tests. Its technology is intended to evaluate complex and non-deterministic agentic workflows that cannot be fully tested through fixed scripts or traditional testing paths.
Funding
January 2026, Fiddler raised USD 30 million: The Series C round was led by RPS Ventures and increased Fiddler’s total funding to USD 100 million. The financing supports development of its control plane for compound AI, including agent telemetry, continuous evaluation, production monitoring, policy enforcement, and governance capabilities.
February 2026, Braintrust raised USD 80 million: The Series B round was led by ICONIQ, with participation from Andreessen Horowitz, Greylock, and other investors. Braintrust is developing an AI observability platform for production tracing, evaluations, regression detection, datasets, and agent-quality improvement.
February 2026, Selector raised USD 32 million: The round doubled the AI-driven observability company’s valuation to USD 375 million. The capital is being used for product development, AI innovation, international expansion, customer success, and wider adoption of its network-intelligence platform.
June 2026, Coralogix raised USD 200 million: The Series F round was co-led by Advent, CPP Investments, and Greenfield Partners, increasing total funding to USD 550 million. The investment supports an observability platform intended for environments where human engineers and AI agents jointly analyse and operate large volumes of telemetry data.
June 2026, Sazabi raised USD 8 million: The seed round was led by J2 Ventures, Village Global, and Y Combinator. The startup is developing a simplified AI observability and incident-response platform centred on real-time log analysis for engineering teams using AI coding and development tools.
Competitive Landscape
The market is characterized by intense competition among established players and emerging companies. Strategic partnerships, mergers and acquisitions, and product innovation are key strategies employed by market participants.
Key Market Players
Arize AI
Langfuse
LangChain, Inc. through LangSmith
New Relic, Inc.
Datadog, Inc.
Cisco Systems, Inc. through Splunk
Dynatrace, Inc.
WhyLabs, Inc.
Weights & Biases, Inc.
Galileo Technologies Inc.
Fiddler AI
Coralogix Ltd.
Honeycomb.io
Other Key Players
Research Methodology
This market study is prepared using a combination of primary and secondary research. Primary research includes discussions with manufacturers, suppliers, distributors, consultants, industry experts, and end users. Secondary research covers company reports, government databases, trade associations, technical publications, regulatory sources, and trusted industry documents. The collected information is used to assess market demand, pricing trends, technology adoption, competitive activity, and regional performance.
AI language models are not used as primary data sources, and publicly available AI-generated content is not treated as market evidence. Computational tools may be used to support data processing, translation, data classification, and pattern identification. However, every published assessment is supported by verified sources, human review, and primary market discussions.
Market estimates are developed through top-down and bottom-up approaches and validated using data triangulation. Revenue, production, shipment, pricing, and application-level data are compared across multiple sources. Forecasts consider economic conditions, regulatory changes, investment activity, innovation, supply chain developments, and industry risks. All findings are reviewed through source verification and internal quality checks before publication.
Part I
Source Management & Input Data Standards
Who provides data, how sources are qualified, and what types of evidence are admissible.
Part II
Research Scope & Market Coverage
How we define the markets we assess and the parameters that govern each product.
Part III
Data Collection, Verification & Submission
The mechanics of gathering, cross-checking, and hierarchically ranking evidence.
Part IV
Assessment Determination & Quality Controls
How raw data becomes a published assessment — normalisation, expert judgement, and outlier exclusion.
Part V
Publication, Corrections & Revision
Our publication schedule, corrections policy, and methodology review cycle.
Part VI
Independence, Ethics & Complaints
Conflict-of-interest policies, editorial independence, and how clients raise concerns.
Google · Preferred Sources
Don't miss the latest market research insights and industry updates on Google.
Add Globe Market Research as a preferred source in the Google app to see our reports, analysis, and market stories in your news suggestions.
Meet the Team
This report was prepared by our expert analysts with deep industry knowledge and research experience.
Kimaya brings more than five years of experience in market research, content review, and industry analysis to Globe Market Research. She plays an important role in maintaining the accuracy, clarity, consistency, and relevance of research content across a wide range of industries. Her responsibilities include reviewing market data, segment analysis, competitive landscapes, industry trends, company developments, and strategic insights. Each report is carefully assessed to ensure that the findings are supported by reliable data, presented in a structured format, and aligned with the information needs of business decision-makers. Kimaya has research experience across healthcare, information technology, consumer goods, and several cross-industry domains.
Prashant S. is a Research Analyst at Globe Market Research with more than four years of experience in market research and industry analysis. He specializes in the Aerospace and Defence, Automotive and Transportation, Semiconductor and Electronics, Information and Technology sectors, with expertise in market sizing, trend analysis, competitive assessment, and industry forecasting. He applies primary and secondary research, data validation, company analysis, and market estimation methods to deliver reliable insights for strategic planning and business decision-making.
Frequently Asked Questions
Related Reports
More in Information and Technology
AI Agent Identity Management Market Size to hit USD 7.8 billion by 2035
AI Agent Identity Management Market Size, Share, and Trends Analysis by Component (Platforms and Services), by Identity Function (Agent Discovery and Registration, Authentication and Authorization, Identity Governance and Administration, Credential and Secret Management, Privileged Access Management, Behavioral Monitoring, Audit and Compliance, and Agent Revocation), by Agent Type (AI Copilots, Semi-Autonomous AI Agents, Fully Autonomous AI Agents, and Multi-Agent Systems), by Deployment (Cloud-Based, On-Premises, and Hybrid), by Organization Size (Small and Medium Enterprises and Large Enterprises), by End-User Industry (BFSI, Healthcare and Life Sciences, IT and Telecommunications, Government and Defense, Retail and E-commerce, Manufacturing, Energy and Utilities, and Others), Regional Insights, Technology Trends, Competitive Landscape, Strategic Opportunities, and Growth Forecast, 2026-2035
Micro Investing App Market Size to Reach USD 9.1 billion by 2035
Micro Investing App Market Size, Share, and Trends Analysis by Platform (iOS, Android, and Web-Based), by Investment Type (Stocks, Exchange-Traded Funds, Bonds, Mutual Funds, Cryptocurrencies, and Others), by End User (Individual Investors and Institutional Investors), by Age Group (Millennials, Generation Z, Generation X, and Baby Boomers), Regional Insights, Technology Trends, Competitive Landscape, Strategic Opportunities, and Growth Forecast, 2026-2035
Shooting Games Market Size to hit USD 238.9 bn by 2035 | CAGR of 10.7%
Shooting Games Market Insights Analysis by Product (Shooting Gallery, Light Gun Shooter, First-Person Shooter, Third-Person Shooter, and Others), by Device Type (PC/MMO, Tablet, Mobile Phone, and TV/Console), by End User (Male and Female), Regional Insights, Technology Trends, Competitive Landscape, Strategic Opportunities, and Growth Forecast, 2026-2035
AI Data Centre Cooling Market Size to Reach USD 52.2 billion by 2035
AI Data Centre Cooling Market Size, Share, Trends and Growth Analysis Report By Cooling Type (Air Cooling, Liquid Cooling, Hybrid Cooling Systems), By Data Centre Type (Hyperscale Data Centres, Colocation Data Centres, Enterprise Data Centres, Edge Data Centres), By Cooling Component (Cooling Units, Chillers, Air Handling Units, Pumps, Heat Exchangers), By End User (Cloud Service Providers, Colocation Providers, Enterprises, Government and Defense), By Regional Insights, Technology Trends, Competitive Landscape, Strategic Opportunities and Growth Forecast, 2026-2035