

Revenue, 2026
USD 4.9 Bn
Forecast, 2035
USD 8.6 Bn
CAGR, 2026-2035
6.5%
Report Coverage
Global
Market Size and Forecast
The Global Food Colorants Market was worth USD 4.9 billion in 2026 and is expected to reach USD 8.6 billion by 2035, growing at a CAGR of 6.5% from 2026 to 2035. Europe held the largest regional share of 30.9% in 2026, valued at around USD 1.5 billion, supported by strong demand for clean-label foods, natural ingredients, premium bakery products, confectionery, beverages, and processed food applications.
The Food Colorants Market includes natural colors, synthetic colors, caramel colors, lakes, dyes, fruit and vegetable extracts, carotenoids, anthocyanins, chlorophyll, turmeric, beetroot, and other coloring ingredients used in food and beverages. These colorants help improve visual appeal, product identity, flavor perception, and consumer acceptance across packaged food categories.
Market growth is being supported by rising demand for visually attractive food products, natural color solutions, and clean-label formulations. Food manufacturers are using colorants in confectionery, dairy, bakery, snacks, beverages, sauces, frozen desserts, and ready meals to create consistent appearance and stronger shelf appeal. Demand is also increasing for plant-based colors and naturally sourced pigments as consumers pay more attention to ingredient labels.
Key Parameter | Report Details |
|---|---|
Market Revenue, 2026 | USD 4.9 Billion |
Projected Revenue, 2035 | USD 8.6 Billion |
CAGR (2026-2035) | 6.5% |
Largest Region | Europe (30.9%, USD 1.5 Bn) |
Fastest Growing Region | Asia Pacific |
Market Concentration | Medium |
Forecast Period | 2026-2035 |
Europe is expected to remain a leading region due to strict food safety standards, high consumer awareness, and strong demand for natural and transparent food ingredients. Regional growth is supported by innovation in plant-based colorants, premium food launches, and reformulation away from artificial additives. Long-term market growth will depend on color stability, regulatory approval, cost efficiency, clean-label demand, and wider use of natural food color systems.
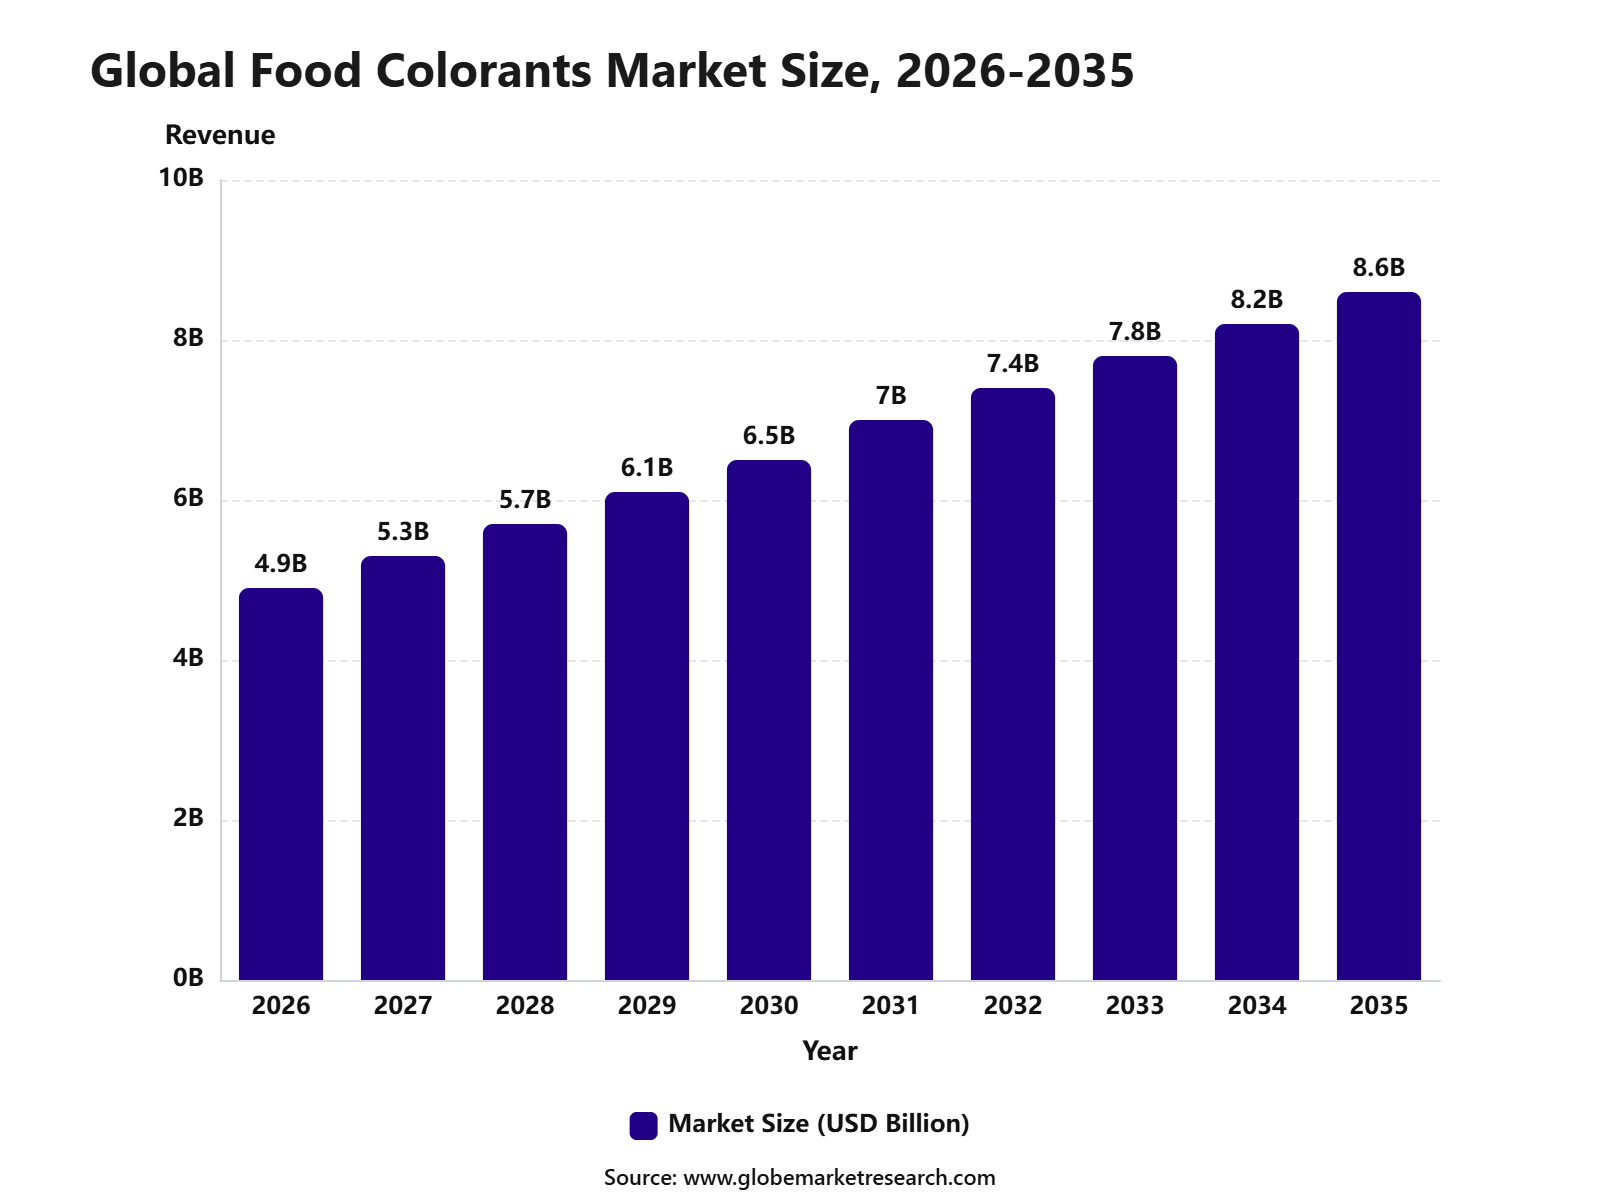 iThe graph shows projected market growth until 2035 based on CAGR analysis. Actual outcomes may vary depending on changing demand, competition, and economic factors.To gain greater insights - request a sample report PDF
Key Market Insights
Natural food colorants led the type segment with 40.9% share, supported by rising demand for clean-label ingredients, plant-based colors, and safer alternatives to synthetic additives.
Powder form accounted for 52.2% share, driven by easier storage, longer shelf life, better handling, and wide use in dry mixes, beverages, bakery, and confectionery products.
Beverages held 35.6% share by application, supported by strong use of colorants in soft drinks, juices, flavored water, dairy drinks, energy drinks, and functional beverages.
Europe led the food colorants market with 30.9% share, valued at USD 1.5 billion, supported by strict food safety standards, high clean-label demand, and strong adoption of natural coloring ingredients.
Top Funding and Investment
Top Investments
In June 2026, Mars began spending millions of dollars to develop M&M’s made without artificial dyes. Nearly 100 employees are supporting formulation, manufacturing and equipment trials using beet, turmeric and spirulina-derived colors. The first naturally colored version is scheduled for August 2026, while Mars aims to restore all six traditional colors with natural ingredients by 2028.
In September 2025, Michroma partnered with CJ CheilJedang to scale commercial manufacturing of fermentation-derived natural colorants. CJ CheilJedang will provide global fermentation and manufacturing capabilities, while Michroma contributes its fungal biotechnology platform for producing stable pigments intended to replace petroleum-based food dyes.
In 2025, PepsiCo accelerated investment in reformulating Gatorade, Cheetos, Lay’s, Tostitos and other U.S. products with paprika, turmeric, carob, purple sweet potato and carrot-based colors. Around 40% of its U.S. portfolio still contained synthetic dyes, making the transition a multi-year research, testing and manufacturing program.
In June 2025, Kraft Heinz committed development and manufacturing resources to eliminate synthetic colors from its remaining U.S. products by the end of 2027. Nearly 90% of U.S. net sales already came from products without certified artificial colors. The company will replace dyes with natural colors, remove unnecessary coloring or redesign products where suitable substitutes are unavailable.
In June 2025, General Mills announced a reformulation program to remove certified artificial colors from its U.S. cereals and K-12 school products by mid-2026, followed by the remaining U.S. retail portfolio by the end of 2027. Approximately 85% of its U.S. retail products were already free from artificial dyes when the program was announced.
Top Funding Developments
In May 2026, Phytolon raised USD 23.6 million in Series B financing to commercialize its fermentation-derived natural food colors in the United States. The funding supports production scale-up, supply-chain development and customer adoption of yeast-produced pigments, beginning with FDA-authorized Beetroot Red. Phytolon’s cumulative funding reached approximately USD 43.6 million.
In 2025, the U.S. Department of Agriculture provided a USD 600,000 award supporting Ohio State University research into stable natural red food colorants. The project uses agricultural by-products, including berry, purple-corn and black-carrot materials, to develop heat-resistant and longer-lasting pyranoanthocyanin pigments suitable for mass production.
Top Acquisitions
In March 2025, Döhler acquired Premier Juices, adding fruit and vegetable juice concentrates, purees, blending capabilities, packaging operations and quality-control infrastructure in Delaware. These assets strengthen Döhler’s supply of naturally colored fruit-based ingredients and coloring-food solutions for beverages, confectionery, dairy products and other processed foods.
During 2025, Givaudan acquired the investments in D.D. Williamson (U.K.) Limited and DDW Colours UK Limited from Colortech LP and N&H Holding UK Limited. The acquired interests cover UK operations connected to DDW’s natural colors, coloring foods, caramel colors and burnt-sugar portfolio.
By Type
Natural colorants accounted for 40.9% share of the Food Colorants Market. This leading position is supported by rising consumer preference for clean-label food products, plant-based ingredients, and color solutions derived from fruits, vegetables, spices, algae, and other natural sources.
The segment is widely preferred because natural colorants help food and beverage brands improve label transparency while maintaining visual appeal. Ingredients such as carotenoids, anthocyanins, chlorophyll, curcumin, paprika extract, and beetroot color are commonly used across beverages, dairy, bakery, confectionery, snacks, and processed foods.
Demand is expected to remain strong as manufacturers reformulate products away from synthetic additives. Growth will be supported by premium foods, organic products, children’s food, functional beverages, and rising demand for safer and naturally sourced coloring ingredients.
By Form
Powder food colorants accounted for 52.2% share of the Food Colorants Market. This dominance is driven by their longer shelf life, easier storage, better handling, and strong suitability for dry food mixes and industrial-scale food processing.
The segment is widely used in bakery products, confectionery, powdered beverages, seasonings, snacks, desserts, dairy powders, and instant food preparations. Powder colorants offer good stability, accurate dosing, and easier blending with dry ingredients during manufacturing.
Demand for powder form is expected to remain strong as food processors continue to require stable and cost-efficient color solutions. Its compatibility with packaged foods, dry mixes, and large-volume production will continue to support segment leadership.
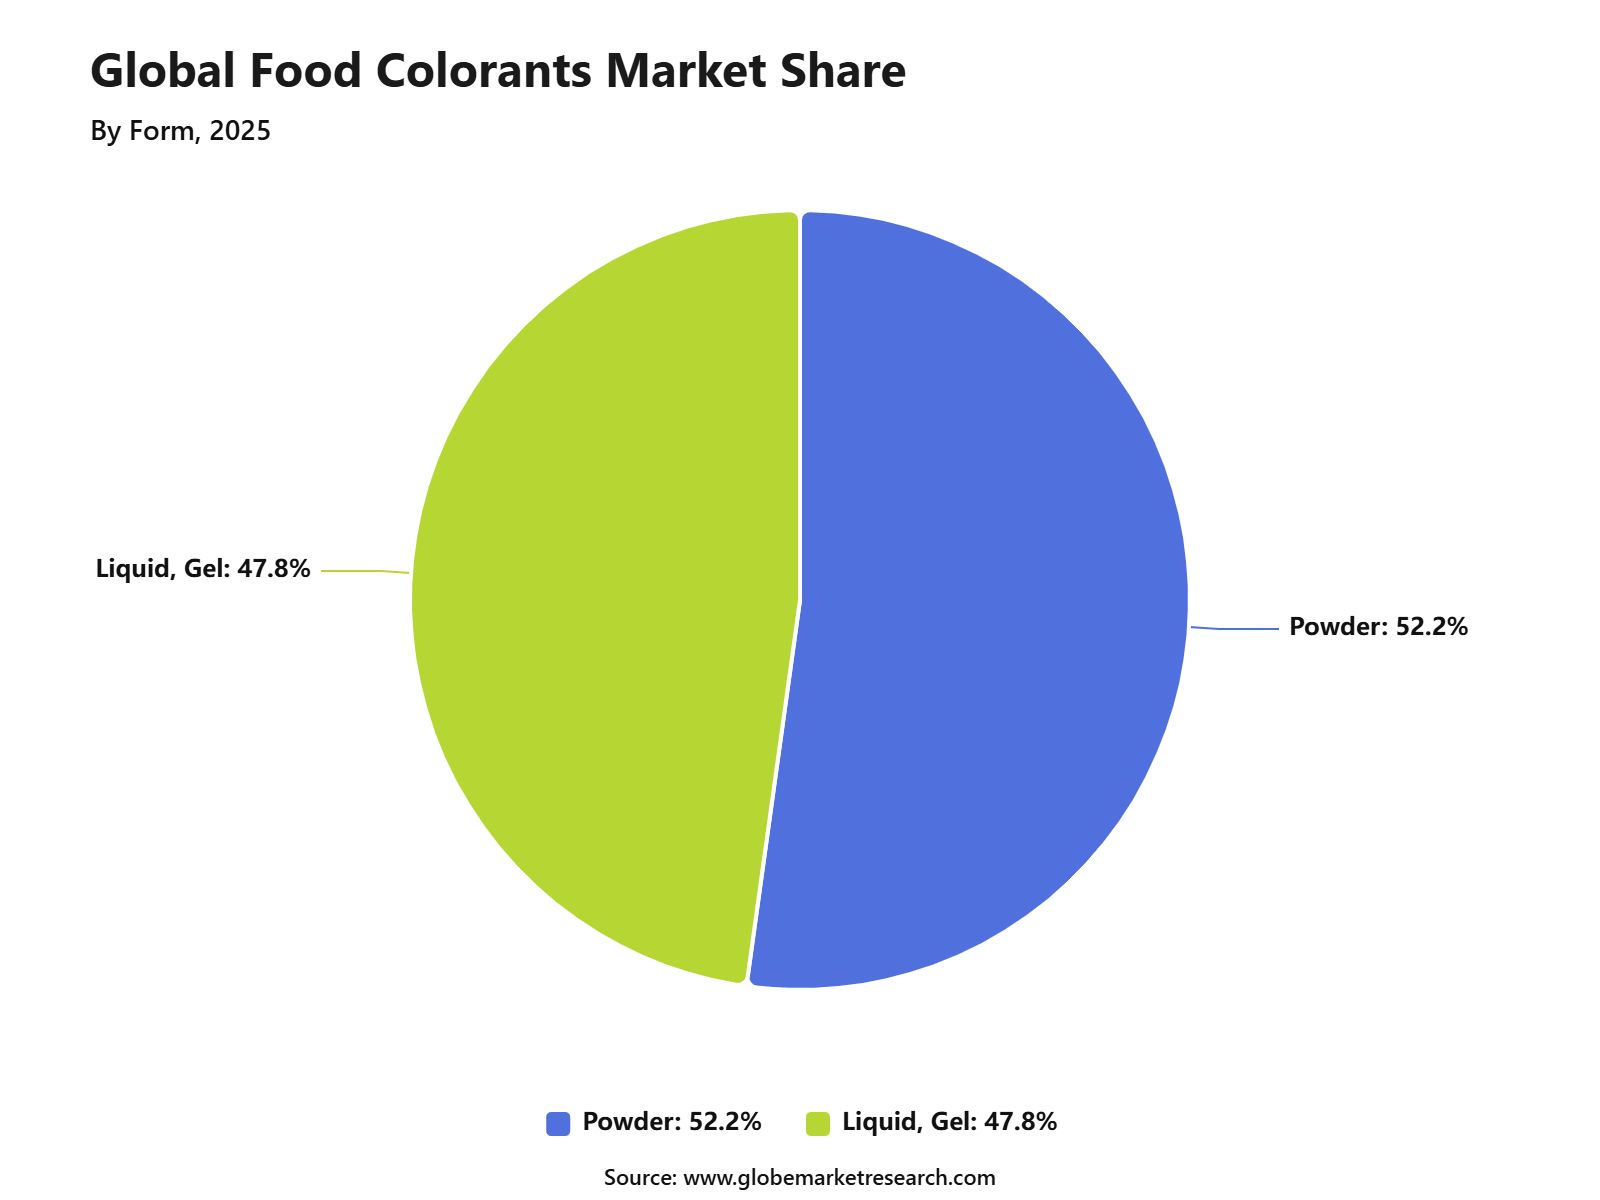 iThe graph shows projected market growth until 2035 based on CAGR analysis. Actual outcomes may vary depending on changing demand, competition, and economic factors.To gain greater insights - request a sample report PDF
By Application
Beverages accounted for 35.6% share of the Food Colorants Market. This leading share is supported by high use of colorants in juices, carbonated drinks, flavored water, energy drinks, sports drinks, dairy beverages, alcoholic drinks, and functional beverages.
Color plays an important role in beverage appeal because it influences flavor perception, product identity, and purchase decisions. Natural and powder-based colorants are increasingly used as brands develop fruit-based, botanical, low-sugar, and clean-label beverage products.
Demand from beverages is expected to remain strong as product launches continue across health drinks, ready-to-drink formats, and premium refreshments. Growth will be supported by natural color innovation, vibrant product positioning, and rising consumer preference for visually attractive beverages.
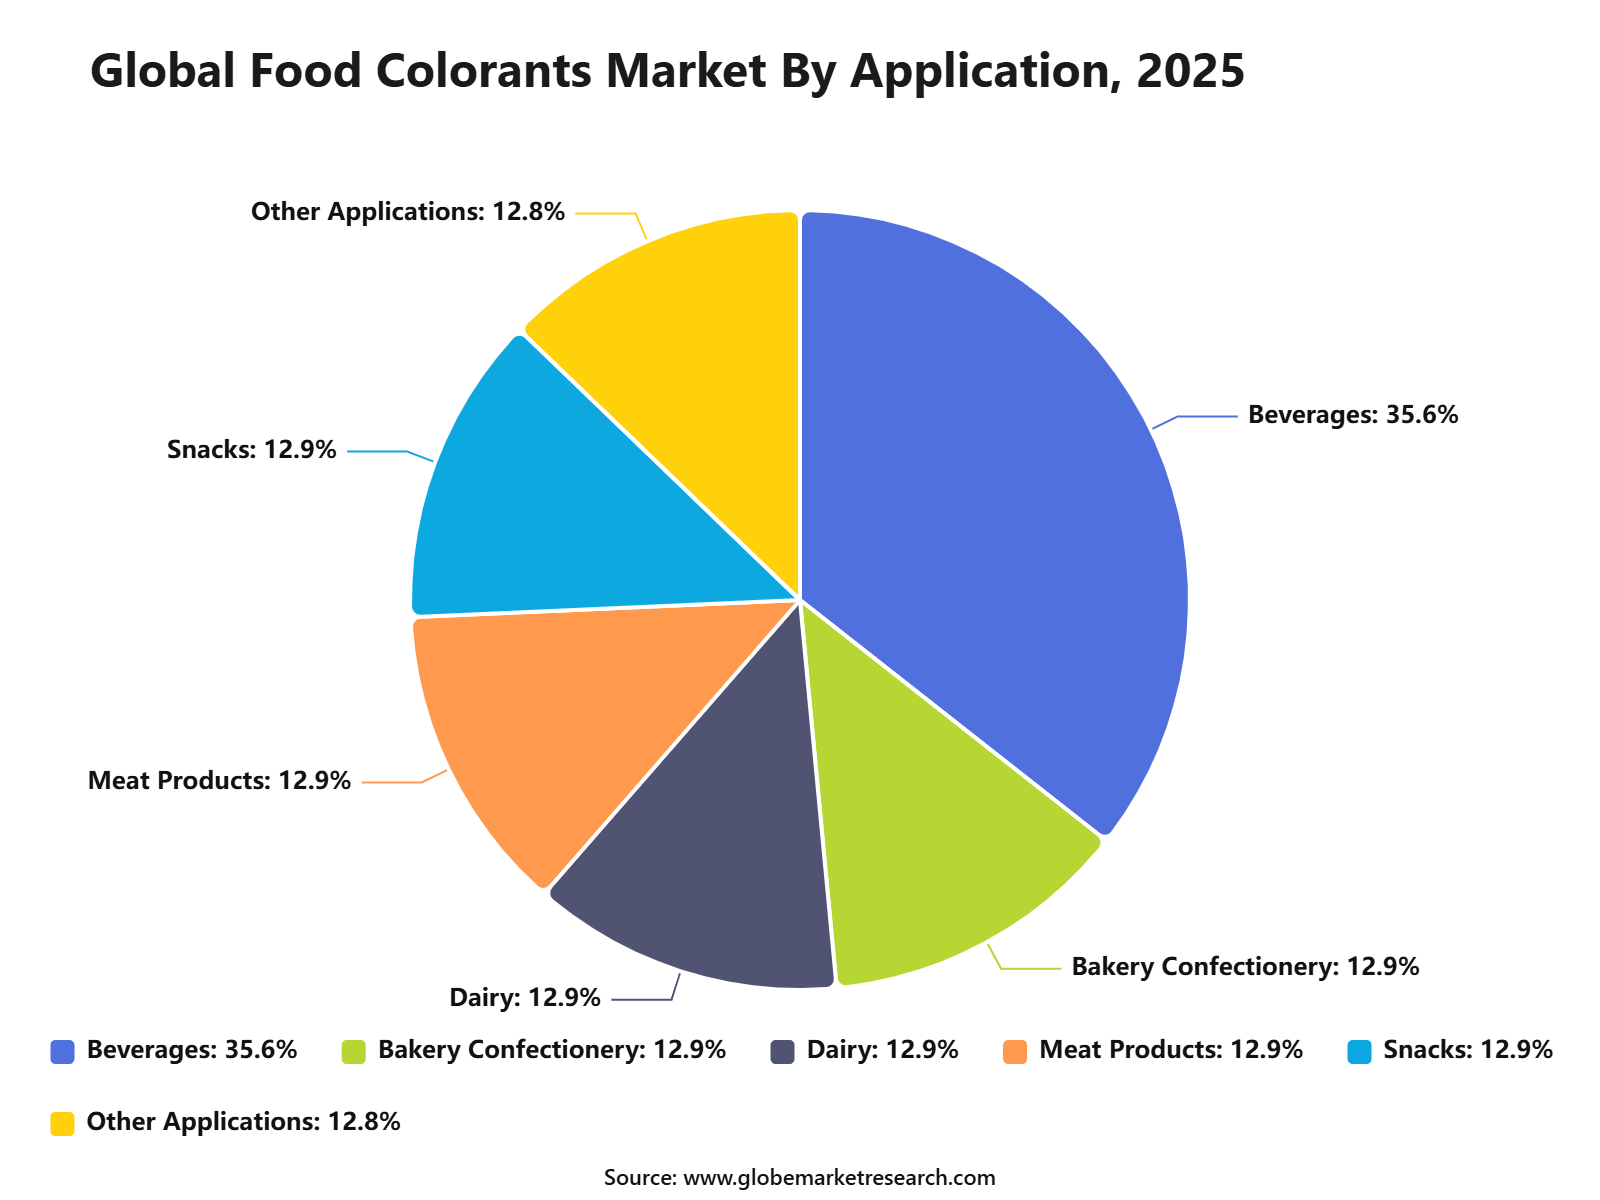 iThe graph shows projected market growth until 2035 based on CAGR analysis. Actual outcomes may vary depending on changing demand, competition, and economic factors.To gain greater insights - request a sample report PDF
By Region
Europe accounted for 30.9% share of the Food Colorants Market, reaching USD 1.5 billion. The region’s leadership is supported by strong clean-label demand, strict food ingredient standards, mature packaged food industries, and high consumer awareness of natural ingredients.
Germany, France, the United Kingdom, Italy, Spain, and the Netherlands are key contributors to regional demand. The region benefits from advanced food processing, premium beverage production, confectionery manufacturing, and strong adoption of natural colorants across branded food products.
Europe is expected to maintain a strong position as food companies continue to reformulate products with natural and transparent ingredients. Demand will remain supported by natural colorants, powder formats, beverage applications, and growing preference for clean-label food and drink products.
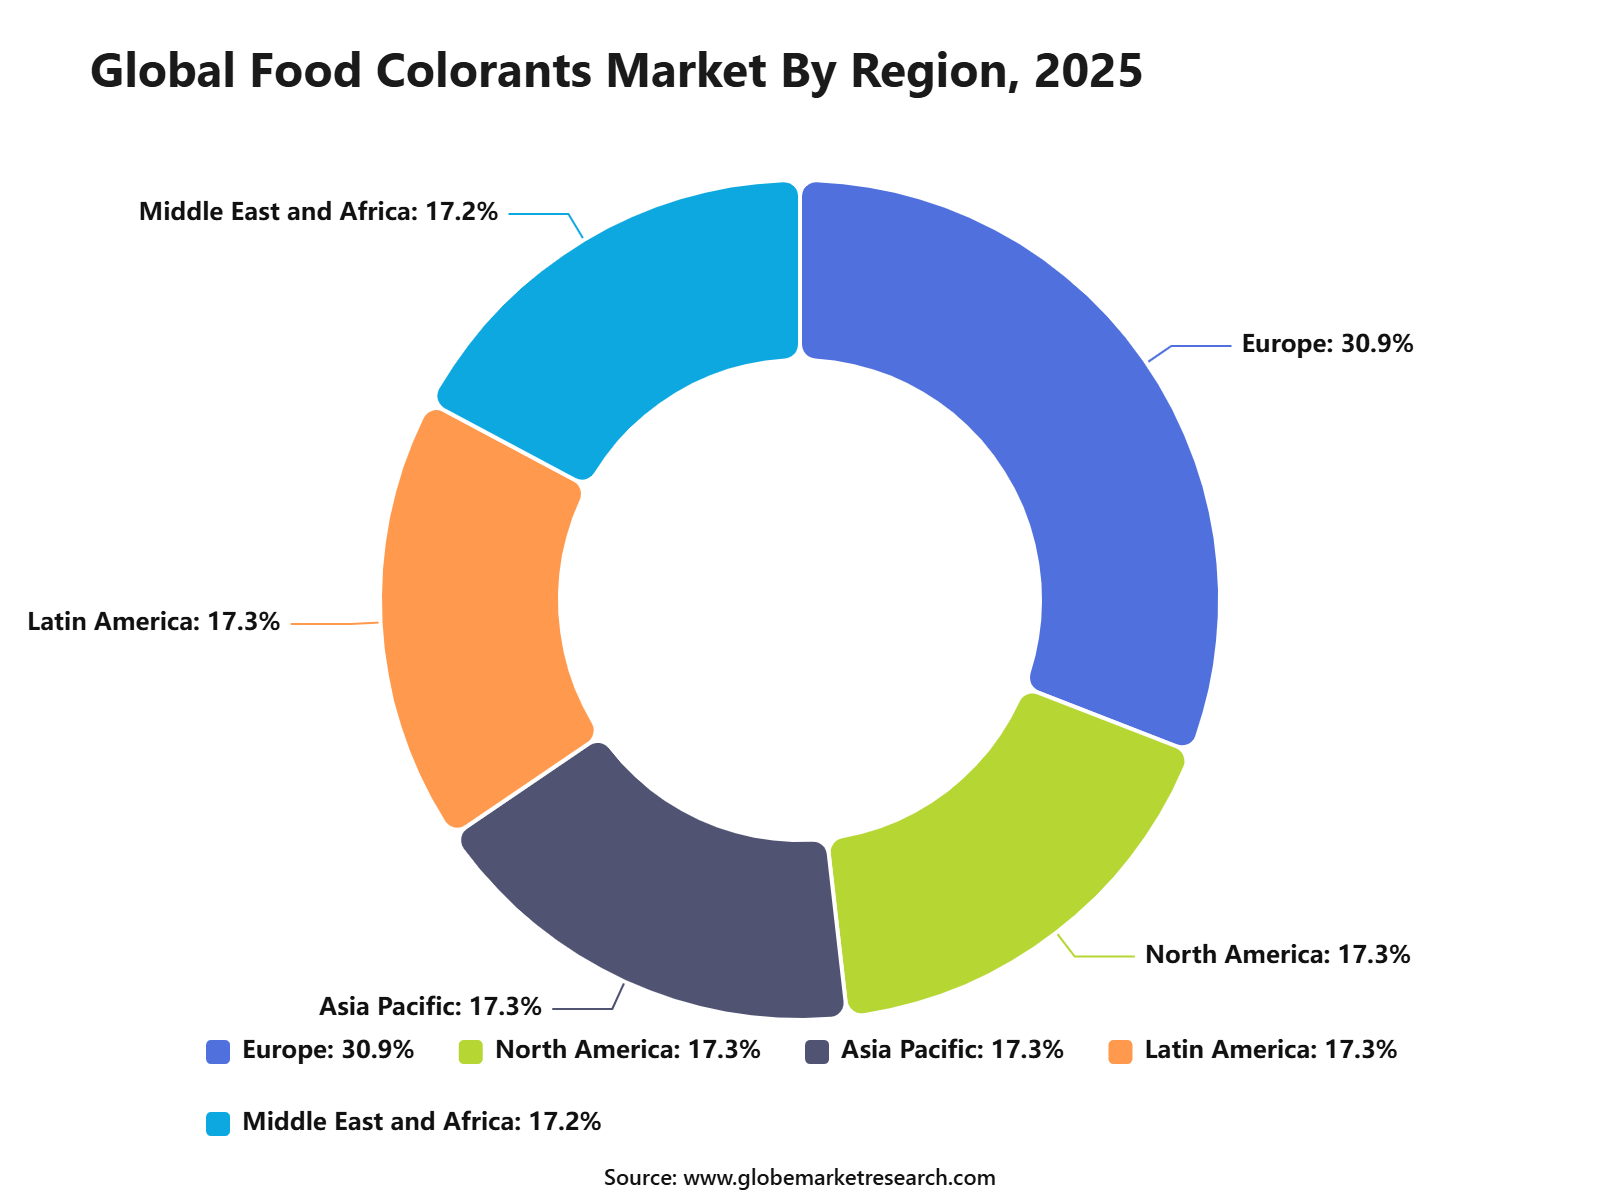 iThe graph shows projected market growth until 2035 based on CAGR analysis. Actual outcomes may vary depending on changing demand, competition, and economic factors.To gain greater insights - request a sample report PDF
Regional Impact Analysis
Europe leads the Food Colorants Market with 30.9% share in 2026, valued at around USD 1.5 billion, supported by strong demand for natural colors, clean-label foods, bakery products, confectionery, dairy, and beverages. Germany, France, the UK, Italy, Spain, and the Netherlands remain important markets due to mature food manufacturing and strict ingredient standards.
North America remains important because of rising clean-label reformulation, premium beverages, snacks, and plant-based foods. Asia Pacific supports future growth through expanding packaged food production, growing middle-class consumption, and increasing demand for visually appealing food products.
Impact Factor | Estimated CAGR Impact | Regional Relevance | Market Impact |
|---|---|---|---|
Europe market leadership | +1.9% | Europe, 30.9% share in 2026 | Leads global value demand. |
Germany food processing strength | +1.4% | Germany | Supports industrial colorant use. |
France and Italy premium food demand | +1.1% | France, Italy | Adds natural and premium color demand. |
North America clean-label reformulation | +0.9% | U.S. and Canada | Supports natural color innovation. |
Asia Pacific packaged food growth | +0.8% | China, India, Japan, Southeast Asia | Builds future market expansion. |
Go-To-Market and Sales Economics
Food colorant suppliers should target beverages, confectionery, bakery, dairy, snacks, sauces, and processed foods with application-specific systems. India’s food-processing industry is projected to reach USD 585 billion in 2026, creating a broad customer base for stable, heat-resistant, light-resistant, and clean-label colors designed for local recipes and manufacturing conditions.
Direct technical selling is important for large manufacturers because color performance changes with acidity, temperature, processing time, packaging, and storage. Regional distributors can serve smaller processors requiring shorter delivery times and lower order quantities. India’s packaged-food demand reached approximately USD 116 billion in 2025 and is projected to reach USD 175 billion by 2030.
Commercial proposals should compare dosage, processing stability, shelf-life performance, reformulation expenses, and regulatory support instead of focusing only on price per kilogram. The FDA’s June 2026 tracker shows that manufacturers are working toward removing certified colors from school meals during the 2026 school year, creating immediate demand for tested replacement formulations and technical assistance.
Risk Factors & Market Barriers
Regulatory differences remain a major barrier because approved colors, permitted applications, maximum levels, purity requirements, and labeling rules vary between countries. England’s June 2026 additive guidance states that most additives are permitted only in specified foods and are subject to quantitative limits. Suppliers must therefore maintain separate compliance documentation for each destination market and application.
Safety reassessments can increase testing costs and disrupt established product portfolios. EFSA introduced updated scientific guidance for food-additive applications on January 20, 2026, with the revised requirements applying to submissions from July 20, 2026. Stronger expectations for toxicology, exposure, manufacturing data, and impurity characterization may extend product-development and authorization timelines.
The transition away from petroleum-derived colors creates sourcing and performance risks. The FDA is encouraging manufacturers to eliminate six remaining synthetic dyes by the end of 2026. Natural alternatives may require higher dosage, specialized processing, improved encapsulation, or multiple ingredients to achieve comparable brightness, stability, and consistency across demanding food applications.
Revenue Potential Analysis
Revenue Landscape Across
North America offers near-term revenue opportunities through reformulation of cereals, dairy products, confectionery, beverages, snacks, and school foods. The FDA’s 2026 industry tracker records commitments covering major consumer brands and a broader objective to stop manufacturing foods with certified colors by December 31, 2027. This transition supports demand for natural color systems and application trials.
Asia provides a diverse revenue base because packaged-food manufacturing, urban retail, and convenience-food consumption continue to expand. India’s food-processing sector is expected to reach USD 585 billion in 2026. Suppliers can improve market access by offering locally available inventories, technical laboratories, cost-optimized blends, and colors suitable for high-temperature cooking, acidic beverages, dairy products, and regional confectionery.
Europe provides opportunities for high-purity colors, botanical extracts, vegetable carbon, and customized clean-label systems, but regulatory capability remains essential. EFSA opened its 2026 data-collection process on April 1, with complete analytical and use-level submissions required by June 30. Suppliers with reliable composition, usage, exposure, and impurity data can gain stronger customer confidence.
Financial Impact
Replacing synthetic colors can increase development costs because natural pigments may respond differently to light, oxygen, acidity, and heat. However, early reformulation can protect shelf availability and reduce the risk of rushed product changes. The FDA reported in 2025 that around 40% of the food industry had committed to voluntarily phasing out petroleum-based dyes.
Regulatory preparation has a direct financial effect because incomplete applications can delay revenue and require additional testing. EFSA’s 2026 application procedure includes four main phases: pre-submission, submission and suitability review, risk assessment, and post-adoption. Budgeting for analytical studies, exposure calculations, manufacturing documentation, and specialist support can reduce avoidable delays during commercialization.
Profitability can be improved through concentrated formulations, accurate dosing, extended color stability, and reduced batch rejection. FDA approval of three colors from natural sources expanded the available formulation palette, while its February 2026 labeling approach created clearer opportunities for qualifying absence-of-artificial-color claims. Suppliers that combine ingredients with validation services can capture higher-value contracts.
Natural Colors Drive Market Reformulation
Regulatory reformulation is the most important factor shaping the Food Colorants Market. In 2025, the FDA announced plans to eliminate six remaining certified synthetic dyes, begin revoking two additional color authorizations and accelerate natural alternatives. The agency also revoked authorization for Red No. 3, creating a clear commercial need for safer replacement colors and technical reformulation services.
Natural-color innovation strengthened further when the FDA approved three new naturally sourced color petitions and later increased the total number of newly approved food color options to six. These actions expand opportunities for algae-based blue, butterfly pea extracts, beetroot red, spirulina and other natural solutions, while increasing the importance of pigment stability, purity, regulatory documentation and reliable agricultural sourcing.
Important Data | Numeric Value |
|---|---|
Synthetic Dyes Targeted | 6 |
Color Rules Reviewed | 2 |
Natural Petitions Approved | 3 |
New Color Options | 6 |
Revoked Synthetic Dye | 1 |
National Transition Standard | 1 |
Natural Extract Petitions | 2 |
Drivers Impact Analysis
The Food Colorants Market is driven by rising demand from beverages, bakery, confectionery, dairy, snacks, sauces, plant-based foods, and processed meals. Food colorants help improve product appearance, brand identity, consumer appeal, and visual consistency across packaged food and beverage categories.
Europe leads the market due to strong demand for natural food colors, clean-label products, strict ingredient transparency, and mature processed food manufacturing. The region’s bakery, dairy, confectionery, beverage, and premium packaged food sectors support steady use of both natural and approved synthetic colorants.
Impact Factor | Estimated CAGR Impact | Regional Relevance | Market Impact |
|---|---|---|---|
Growth in packaged food production | +1.8% | Europe, North America, Asia Pacific | Drives core colorant demand. |
Rising demand for natural colors | +1.6% | Europe and North America | Supports clean-label reformulation. |
Expansion of beverage applications | +1.3% | Europe, Asia Pacific, U.S. | Adds high-volume usage. |
Growth in bakery and confectionery | +1.1% | Europe and urban markets | Improves product appeal. |
Demand for visually attractive foods | +0.8% | Global packaged food brands | Supports branding and differentiation. |
Restraints Impact Analysis
The market faces restraints from natural color stability issues, high extraction cost, regulatory limits, and sensitivity to heat, light, oxygen, and pH. Natural food colors often need careful formulation to maintain shade, brightness, and shelf-life performance.
Another restraint is price pressure from food manufacturers. Natural colors can cost more than synthetic alternatives, making adoption more difficult in low-margin food categories, especially in price-sensitive markets.
Impact Factor | Estimated CAGR Impact | Regional Relevance | Market Impact |
|---|---|---|---|
High cost of natural colorants | -0.9% | Europe, North America | Limits mass-market adoption. |
Stability issues in processing | -0.8% | Beverages, dairy, bakery | Affects color consistency. |
Regulatory approval complexity | -0.6% | Europe and export markets | Adds compliance burden. |
Raw material supply fluctuation | -0.5% | Plant-based color suppliers | Impacts price and availability. |
Synthetic color perception concerns | -0.4% | Clean-label markets | Reduces demand for artificial colors. |
Opportunities Impact Analysis
Opportunities are strong in natural colorants, plant-based pigments, carotenoids, anthocyanins, curcumin, spirulina extract, paprika extract, beetroot red, and caramel color. These ingredients benefit from clean-label demand and consumer preference for recognizable sources.
Higher-value opportunities are emerging in plant-based meat colors, dairy alternatives, functional beverages, premium confectionery, children’s foods, and organic packaged foods. Suppliers that improve stability, shade range, and application support can capture stronger demand.
Impact Factor | Estimated CAGR Impact | Regional Relevance | Market Impact |
|---|---|---|---|
Natural colorant adoption | +1.9% | Europe, North America, Asia Pacific | Builds clean-label growth. |
Plant-based pigment innovation | +1.5% | Premium packaged foods | Adds ingredient differentiation. |
Plant-based meat color solutions | +1.2% | Europe and North America | Supports alternative protein products. |
Functional beverage color demand | +1.0% | Health-focused beverage markets | Adds premium application value. |
Organic and clean-label products | +0.8% | Developed consumer markets | Supports higher-value positioning. |
Challenges Impact Analysis
The main challenge is maintaining color performance across different food systems. A colorant that works well in beverages may not perform the same way in bakery, dairy, sauces, frozen foods, or high-heat processing.
Another challenge is matching consumer expectations with technical feasibility. Food brands want natural, stable, affordable, and bright colors, but achieving all four together can be difficult without advanced formulation support.
Impact Factor | Estimated CAGR Impact | Regional Relevance | Market Impact |
|---|---|---|---|
Heat and pH sensitivity | -0.8% | Bakery, beverages, dairy | Affects color durability. |
Shade consistency challenges | -0.7% | Packaged food manufacturing | Impacts product appearance. |
Limited natural blue and green options | -0.6% | Confectionery and beverages | Restricts color palette. |
Cost-performance balancing | -0.5% | Mass-market food brands | Slows full conversion. |
Labeling and consumer perception risk | -0.4% | Europe and North America | Requires clear communication. |
Segment Covered in the Report
By Type
Natural
Synthetic
Nature-Identical
By Form
Powder
Liquid, Gel
By Application
Beverages
Bakery and Confectionery
Dairy
Meat Products
Snacks
Other Applications
By Region
North America
Europe
Asia Pacific
Latin America
Middle East and Africa
Market Trend Analysis
The market trend is moving toward natural food colors, clean-label reformulation, plant-derived pigments, customized color blends, and better stability systems. Food companies are reducing reliance on artificial colors where possible and selecting colorants that support transparent ingredient claims.
Europe remains the largest value region because of strict food ingredient standards, strong clean-label demand, and mature food processing. North America supports innovation in natural colors, while Asia Pacific is growing through packaged food expansion and beverage production.
Impact Factor | Estimated CAGR Impact | Regional Relevance | Market Impact |
|---|---|---|---|
Natural food colors gain share | +1.8% | Europe, North America | Supports reformulation demand. |
Clean-label product launches rise | +1.5% | Europe and developed markets | Improves consumer acceptance. |
Customized color blends expand | +1.2% | Food and beverage brands | Enhances application performance. |
Plant-based food colors grow | +1.0% | Alternative protein and dairy alternatives | Adds new demand areas. |
Premium visual branding increases | +0.7% | Snacks, beverages, confectionery | Supports product differentiation. |
Investor Type Impact Matrix
Investors should focus on companies with strong natural pigment sourcing, formulation expertise, color stability technology, regulatory knowledge, and application-specific support. Product performance, clean-label acceptance, shade consistency, and cost efficiency are key success factors.
Strategic investors can also target natural color producers, specialty ingredient companies, fermentation technology firms, plant extract suppliers, encapsulation technology providers, and food formulation businesses. Companies that combine natural positioning with reliable color performance are better positioned for long-term growth.
Investor Type | Estimated CAGR Impact | Regional Relevance | Market Impact |
|---|---|---|---|
Natural Colorant Producers | +1.4% | Europe, North America, Asia Pacific | Expands clean-label ingredient supply. |
Specialty Food Ingredient Companies | +1.2% | Global packaged food markets | Supports broad formulation demand. |
Fermentation Technology Firms | +1.0% | Novel colorant development | Adds innovation-led value. |
Plant Extract Suppliers | +0.8% | Natural pigment supply chains | Improves raw material access. |
Strategic Food-Tech Investors | +0.6% | Global food processing markets | Funds scale-up and product expansion. |
Recent Developments
May 2026: Oterra entered a multi-million-dollar collaboration with Debut Biotechnology to develop and scale a natural alternative to artificial red food colors, targeting FDA filing and commercial production within approximately three years.
March 2026: Sensient broke ground on a major expansion of its St. Louis color manufacturing plant, increasing natural-color production capabilities while supporting growing customer reformulation demand across food and beverage applications.
January 2026: ADM announced a USD 26 million expansion at its Erlanger facility, building on USD 15 million invested during 2025 to strengthen customer-led taste, flavor, and color reformulation capabilities.
Competitive Landscape
The market is characterized by intense competition among established players and emerging companies. Strategic partnerships, mergers and acquisitions, and product innovation are key strategies employed by market participants.
Key Market Players
Oterra A/S
Sensient Technologies Corporation
Givaudan S.A.
DSM-Firmenich
Archer Daniels Midland Company
Döhler GmbH
Kalsec Inc.
San-Ei Gen F.F.I., Inc.
ROHA Group
Naturex S.A.
Other Key Players
Research Methodology
This market study is prepared using a combination of primary and secondary research. Primary research includes discussions with manufacturers, suppliers, distributors, consultants, industry experts, and end users. Secondary research covers company reports, government databases, trade associations, technical publications, regulatory sources, and trusted industry documents. The collected information is used to assess market demand, pricing trends, technology adoption, competitive activity, and regional performance.
AI language models are not used as primary data sources, and publicly available AI-generated content is not treated as market evidence. Computational tools may be used to support data processing, translation, data classification, and pattern identification. However, every published assessment is supported by verified sources, human review, and primary market discussions.
Market estimates are developed through top-down and bottom-up approaches and validated using data triangulation. Revenue, production, shipment, pricing, and application-level data are compared across multiple sources. Forecasts consider economic conditions, regulatory changes, investment activity, innovation, supply chain developments, and industry risks. All findings are reviewed through source verification and internal quality checks before publication.
Part I
Source Management & Input Data Standards
Who provides data, how sources are qualified, and what types of evidence are admissible.
Part II
Research Scope & Market Coverage
How we define the markets we assess and the parameters that govern each product.
Part III
Data Collection, Verification & Submission
The mechanics of gathering, cross-checking, and hierarchically ranking evidence.
Part IV
Assessment Determination & Quality Controls
How raw data becomes a published assessment — normalisation, expert judgement, and outlier exclusion.
Part V
Publication, Corrections & Revision
Our publication schedule, corrections policy, and methodology review cycle.
Part VI
Independence, Ethics & Complaints
Conflict-of-interest policies, editorial independence, and how clients raise concerns.
Google · Preferred Sources
Don't miss the latest market research insights and industry updates on Google.
Add Globe Market Research as a preferred source in the Google app to see our reports, analysis, and market stories in your news suggestions.
Meet the Team
This report was prepared by our expert analysts with deep industry knowledge and research experience.
Kimaya brings more than five years of experience in market research, content review, and industry analysis to Globe Market Research. She plays an important role in maintaining the accuracy, clarity, consistency, and relevance of research content across a wide range of industries. Her responsibilities include reviewing market data, segment analysis, competitive landscapes, industry trends, company developments, and strategic insights. Each report is carefully assessed to ensure that the findings are supported by reliable data, presented in a structured format, and aligned with the information needs of business decision-makers. Kimaya has research experience across healthcare, information technology, consumer goods, and several cross-industry domains.
Pratiksha K. is a Senior Research Analyst with more than five years of experience in market research, industry analysis, competitive intelligence, and business strategy. She has contributed to detailed market reports, customized research studies, company profiling, market sizing, trend analysis, and strategic consulting projects for clients across different regions. Her industry expertise covers Chemical and Material, Consumer Goods, Food & Beverages and Energy & Power. She closely evaluates changing customer requirements, technology developments, regulatory conditions, supply chain structures, investment activity, and competitive strategies to provide clear and practical market insights.
Frequently Asked Questions
Related Reports
More in Food and Beverages
Refrigerated Ready Meals Market to Hit USD 355.8 Billion by 2035
Refrigerated Ready Meals Market Size, Share, Analysis By Product (Refrigerated Meals, Frozen Meals, Shelf-Stable Meals, Canned Meals), By Meal Type (Vegetarian, Non-Vegetarian, Vegan), By Distribution Channel (Supermarkets and Hypermarkets, Convenience Stores, Online Retail, Specialty Stores), By Regional Insights, Business plan and Project Report, Investment Opportunities, Profitability, Industry Trends, Leading Companies and Growth Forecasts by 2026-2035
Frozen Desserts Market to Hit USD 298.8 Billion by 2035
Frozen Desserts Market Size, Share, Analysis By Product (Ice Cream, Frozen Yogurt, Gelato, Sorbet, Frozen Cakes, Other Products), By Consumption (Retail Consumption, Foodservice Consumption), By Distribution Channel (Supermarkets and Hypermarkets, Convenience Stores, Specialty Stores, Online Retail), By Regional Insights, Business plan and Project Report, Investment Opportunities, Profitability, Industry Trends, Leading Companies and Growth Forecasts by 2026-2035
Frozen Meat and Seafood Market to Hit USD 181.1 Billion by 2035
Frozen Meat and Seafood Market Size, Share, Analysis By Product (Frozen Meat, Frozen Seafood), By Seafood Form (Whole, Fillets, Processed Seafood, Other Forms), By Seafood End Use (Retail and Household, Foodservice, Industrial), By Regional Insights, Business plan and Project Report, Investment Opportunities, Profitability, Industry Trends, Leading Companies and Growth Forecasts by 2026-2035
Frozen Meals Market to Hit USD 74.2 Billion by 2035
Frozen Meals Market Size, Share, Analysis By Product (Frozen, Chilled, Canned, Shelf-Stable), By Meal Type (Vegetarian, Non-Vegetarian, Vegan), By Distribution Channel (Supermarkets and Hypermarkets, Online Retail, Convenience Stores, Specialty Stores), By Regional Insights, Business plan and Project Report, Investment Opportunities, Profitability, Industry Trends, Leading Companies and Growth Forecasts by 2026-2035