

Revenue, 2025
USD 13.5 Bn
Forecast, 2035
USD 23.7 Bn
CAGR, 2025-2035
5.8%
Report Coverage
Global
Market Size and Forecast
The Global Oil and Gas Corrosion Protection Market was worth USD 13.5 billion in 2025 and is expected to reach USD 23.7 billion by 2035, growing at a CAGR of 5.8% from 2025 to 2035. Based on this growth rate, the market is estimated to reach around USD 14.5 billion in 2026. Middle East and Africa held the largest regional share of 34.7% in 2025, valued at around USD 4.6 billion, supported by large oil and gas production assets, offshore platforms, pipeline networks, refinery operations, and harsh operating environments.
The Oil and Gas Corrosion Protection Market includes coatings, inhibitors, cathodic protection systems, linings, monitoring tools, and maintenance solutions used to protect upstream, midstream, and downstream assets. These solutions help extend the service life of pipelines, storage tanks, drilling equipment, processing units, offshore structures, and refinery systems. The market is closely linked with asset integrity, operational safety, leakage prevention, and lifecycle cost reduction.
Key Parameter | Report Details |
|---|---|
Market Revenue, 2025 | USD 13.5 Billion |
Projected Revenue, 2035 | USD 23.7 Billion |
CAGR (2025-2035) | 5.8% |
Largest Region | Middle East and Africa (34.7%, USD 4.6 Bn ) |
Fastest Growing Region | Asia Pacific |
Market Concentration | Medium |
Base Year | 2024 |
Forecast Period | 2025-2035 |
The market outlook remains steady as oil and gas operators continue prioritizing infrastructure reliability and production continuity. Growth can be attributed to aging pipeline networks, rising offshore activity, stricter safety requirements, and the need to reduce unplanned shutdowns caused by corrosion damage. The strong presence of Middle East and Africa oilfields, LNG projects, refinery expansions, and long-distance transmission pipelines is expected to support long-term market demand.
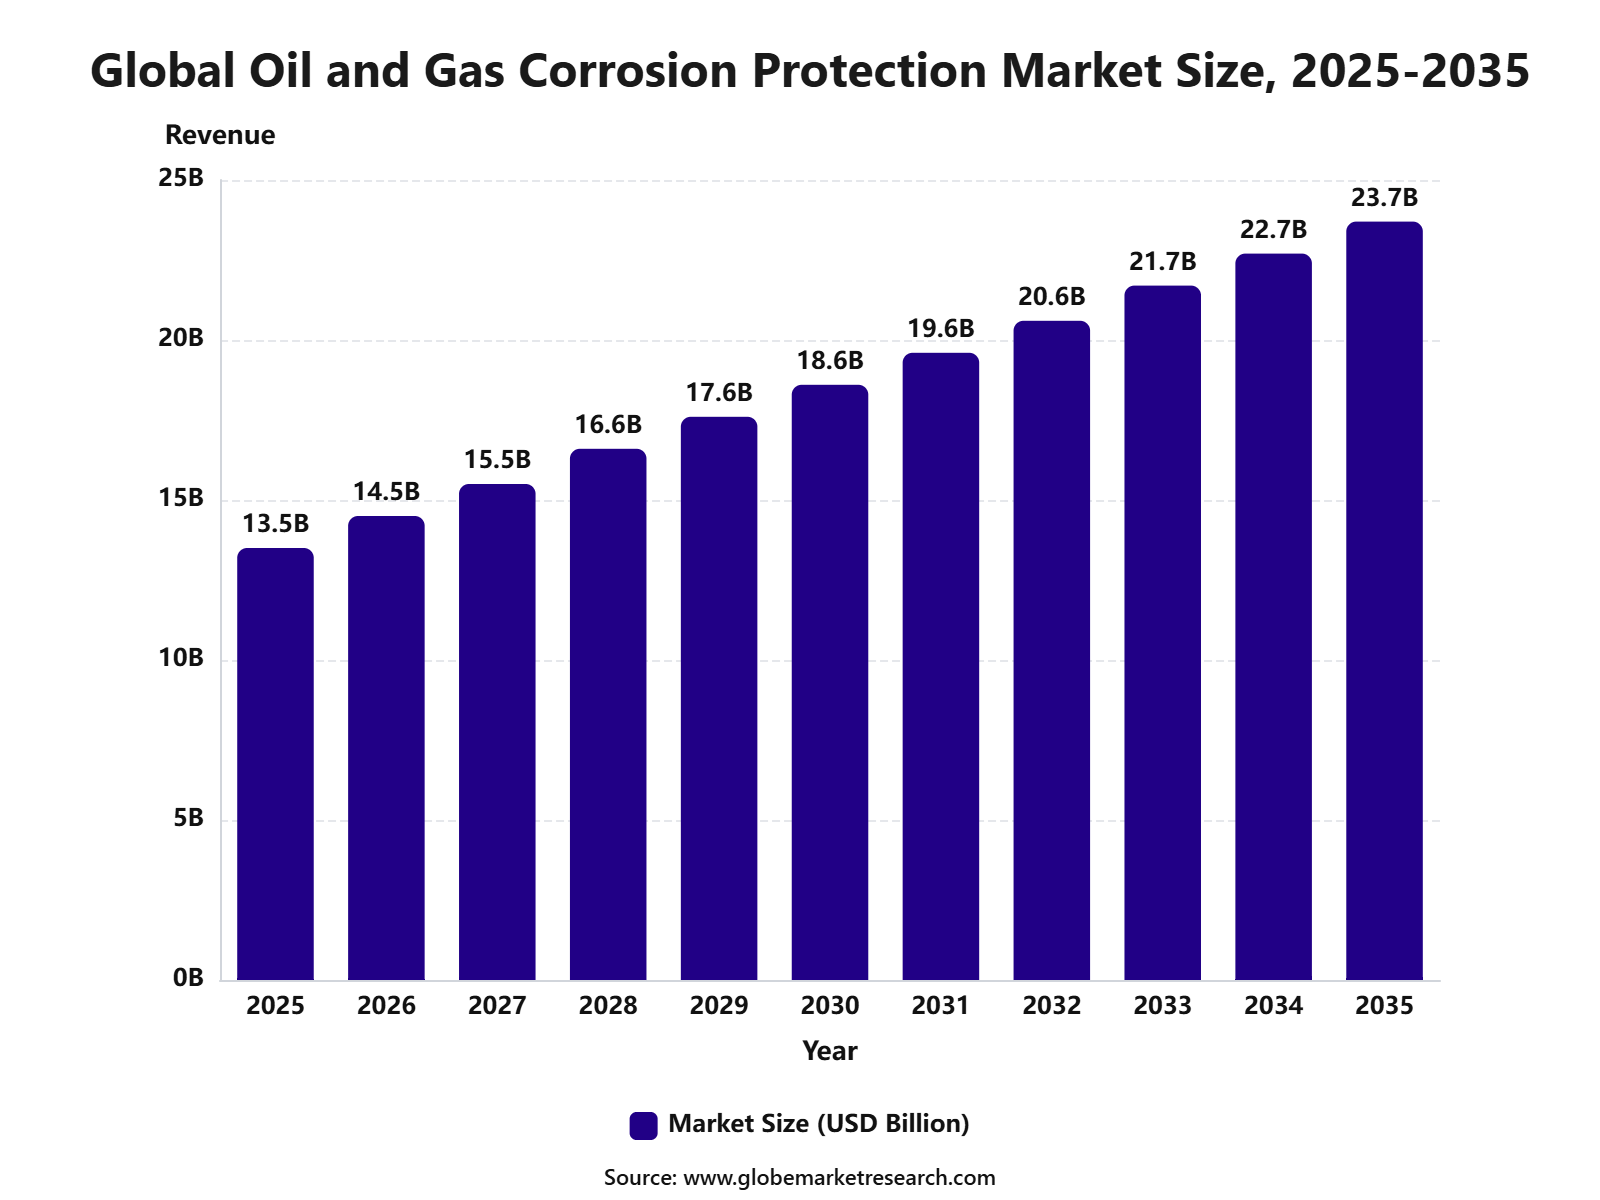 iThe graph shows projected market growth until 2035 based on CAGR analysis. Actual outcomes may vary depending on changing demand, competition, and economic factors.To gain greater insights - request a sample report PDF
Key Market Insights
Coatings led the type segment with 50.3% share, supported by their strong use in protecting pipelines, tanks, offshore platforms, drilling equipment, and processing assets from corrosion.
Offshore locations accounted for 69.3% share, driven by harsh marine conditions, saltwater exposure, high maintenance needs, and strong demand for long-lasting corrosion protection systems.
Upstream sector held 49.2% share, supported by corrosion risks in exploration, drilling, wellheads, subsea systems, and production infrastructure.
Middle East and Africa led the oil and gas corrosion protection market with 34.7% share, valued at USD 4.6 billion, supported by large oil and gas production capacity, offshore projects, and strong investment in asset protection across harsh operating environments.
Top Funding and Investment
Top Investments
South Bow committed approximately USD 40 million to strengthen stress prevention and detection across the Keystone Pipeline. The program includes enhanced operating procedures, employee training, pipeline specifications, monitoring systems, and preventive controls designed to reduce future leaks and improve long-term pipeline integrity.
Australian Gas Networks proposed an AUD 5.0 million cathodic protection investment for its 1,600-kilometre buried transmission pipeline network during 2026 to 2031. The program covers five solar-powered cathodic protection sites, two upgraded anode beds, five control units, new easements, and satellite data loggers installed at approximately 15-kilometre intervals.
Jotun ended 2025 with NOK 782 million in contractually committed capital expenditure, primarily for new plant and building projects in Malaysia and China. The company’s protective coatings division represented 29% of total sales and supplies anti-corrosion coating systems for offshore platforms, pipelines, refineries, storage tanks, and other oil and gas infrastructure.
Hempel reported EUR 43 million in net investment across property, plant, equipment, and intangible assets during 2025. Its Energy and Infrastructure business generated EUR 775 million in revenue and continued expanding corrosion protection and corrosion-under-insulation coating solutions for oil and gas facilities, pipelines, power assets, and industrial infrastructure.
WEG opened a protective coatings manufacturing facility and distribution centre in Manitowoc, Wisconsin, together with another distribution centre in Duluth, Georgia. The Manitowoc facility manufactures Heresite protective coatings for severe operating environments, while the Duluth site distributes industrial and anti-corrosive coatings used across oil and gas, water treatment, marine, and industrial applications.
Top Funding Rounds
Gecko Robotics raised USD 125 million in Series D funding at a USD 1.25 billion valuation. The round was led by Cox Enterprises with participation from USIT, XN, Founders Fund, and Y Combinator. The capital supports robotic inspection and asset-health technologies used to identify wall loss, degradation, and maintenance requirements across oil and gas infrastructure.
Voliro expanded its Series A financing, bringing total capital raised to USD 23 million. New investment was provided by noa, alongside a debt facility from UBS. Voliro’s aerial robots conduct more than 100 contact inspections per month, serving over 40 customers across 17 countries, including industrial and energy operators requiring non-destructive testing of difficult-to-access assets.
Energy Robotics, subsequently renamed Korial, secured USD 13.5 million in Series A funding co-led by Blue Bear Capital and Climate Investment. Its autonomous inspection systems had completed more than one million industrial inspections across five continents, supporting leak, corrosion, thermal, and equipment-condition monitoring at facilities operated by companies including Shell, BP, and Repsol.
Top Acquisitions
BirlaNu signed an agreement to acquire Clean Coats Private Limited for approximately INR 120 crore. Clean Coats manufactures epoxy and polyurethane coatings, anti-corrosion linings, waterproofing materials, flooring systems, and specialised construction chemicals supplied to oil and gas, water, food processing, and industrial customers across India and more than 27 countries.
NDT Global acquired Entegra, a specialist in ultra-high-resolution magnetic flux leakage inline pipeline inspection. The acquisition added technologies for detecting corrosion, third-party pipeline damage, hard spots, pipe-grade variations, and cathodic protection current patterns, complementing NDT Global’s ultrasonic testing, acoustic resonance, integrity assessment, and pipeline data-management capabilities
By Type
Coatings accounted for 50.3% share of the Oil and Gas Corrosion Protection Market. This leading position is supported by their wide use in protecting pipelines, offshore platforms, tanks, vessels, rigs, refineries, and processing equipment from corrosion damage.
The segment is widely preferred because coatings create a protective barrier against moisture, saltwater, chemicals, crude oil, gas, and harsh operating conditions. Epoxy, polyurethane, zinc-rich, fusion-bonded epoxy, and thermal spray coatings are commonly used across upstream, midstream, and downstream assets.
Demand for corrosion protection coatings is expected to remain strong as oil and gas companies focus on asset life extension, safety, and lower maintenance costs. Their ability to reduce equipment failure, leakage risk, and shutdown frequency will continue to support segment leadership.
By Location
Offshore locations accounted for 69.3% share of the Oil and Gas Corrosion Protection Market. This dominance is driven by the severe exposure of offshore assets to seawater, humidity, salt spray, high pressure, and changing temperatures.
Corrosion protection is critical for offshore platforms, subsea pipelines, drilling rigs, floating production units, risers, and marine structures. Protective coatings, cathodic protection, inhibitors, and monitoring systems are used to reduce corrosion risk and maintain operating safety.
The segment is expected to remain the largest location category as offshore oil and gas production continues in deepwater and harsh marine environments. High repair costs and difficult access to offshore assets make preventive corrosion protection essential for long-term operations.
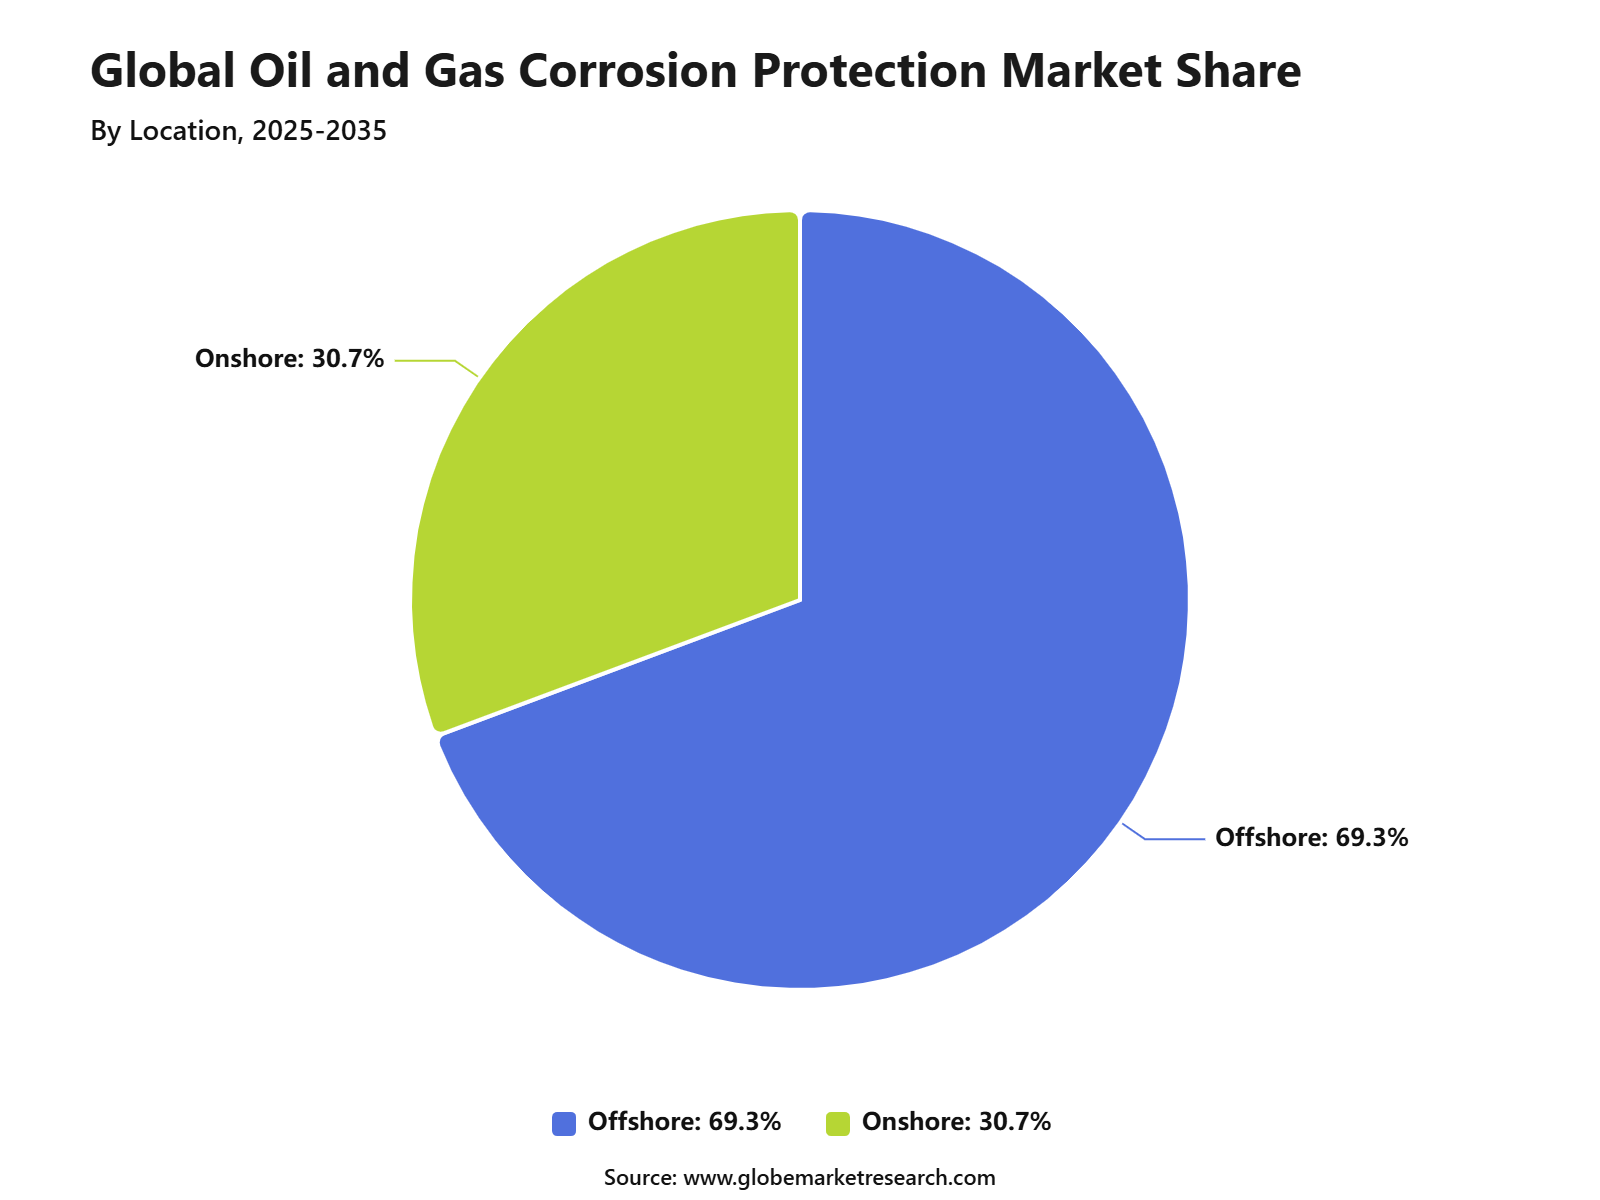 iThe graph shows projected market growth until 2035 based on CAGR analysis. Actual outcomes may vary depending on changing demand, competition, and economic factors.To gain greater insights - request a sample report PDF
By Sector
The upstream sector held 49.2% share of the Oil and Gas Corrosion Protection Market. This leading share is supported by heavy use of corrosion protection across exploration, drilling, wellheads, production platforms, pipelines, separators, storage units, and subsea systems.
Upstream equipment is exposed to corrosive elements such as hydrogen sulfide, carbon dioxide, saline water, drilling fluids, crude oil, and high operating pressure. Corrosion control helps protect production assets, improve worker safety, and reduce the risk of leaks or unplanned downtime.
Demand from the upstream sector is expected to remain strong as operators maintain mature fields and develop offshore and unconventional resources. Corrosion protection will remain essential for improving asset reliability and reducing lifecycle maintenance costs in production operations.
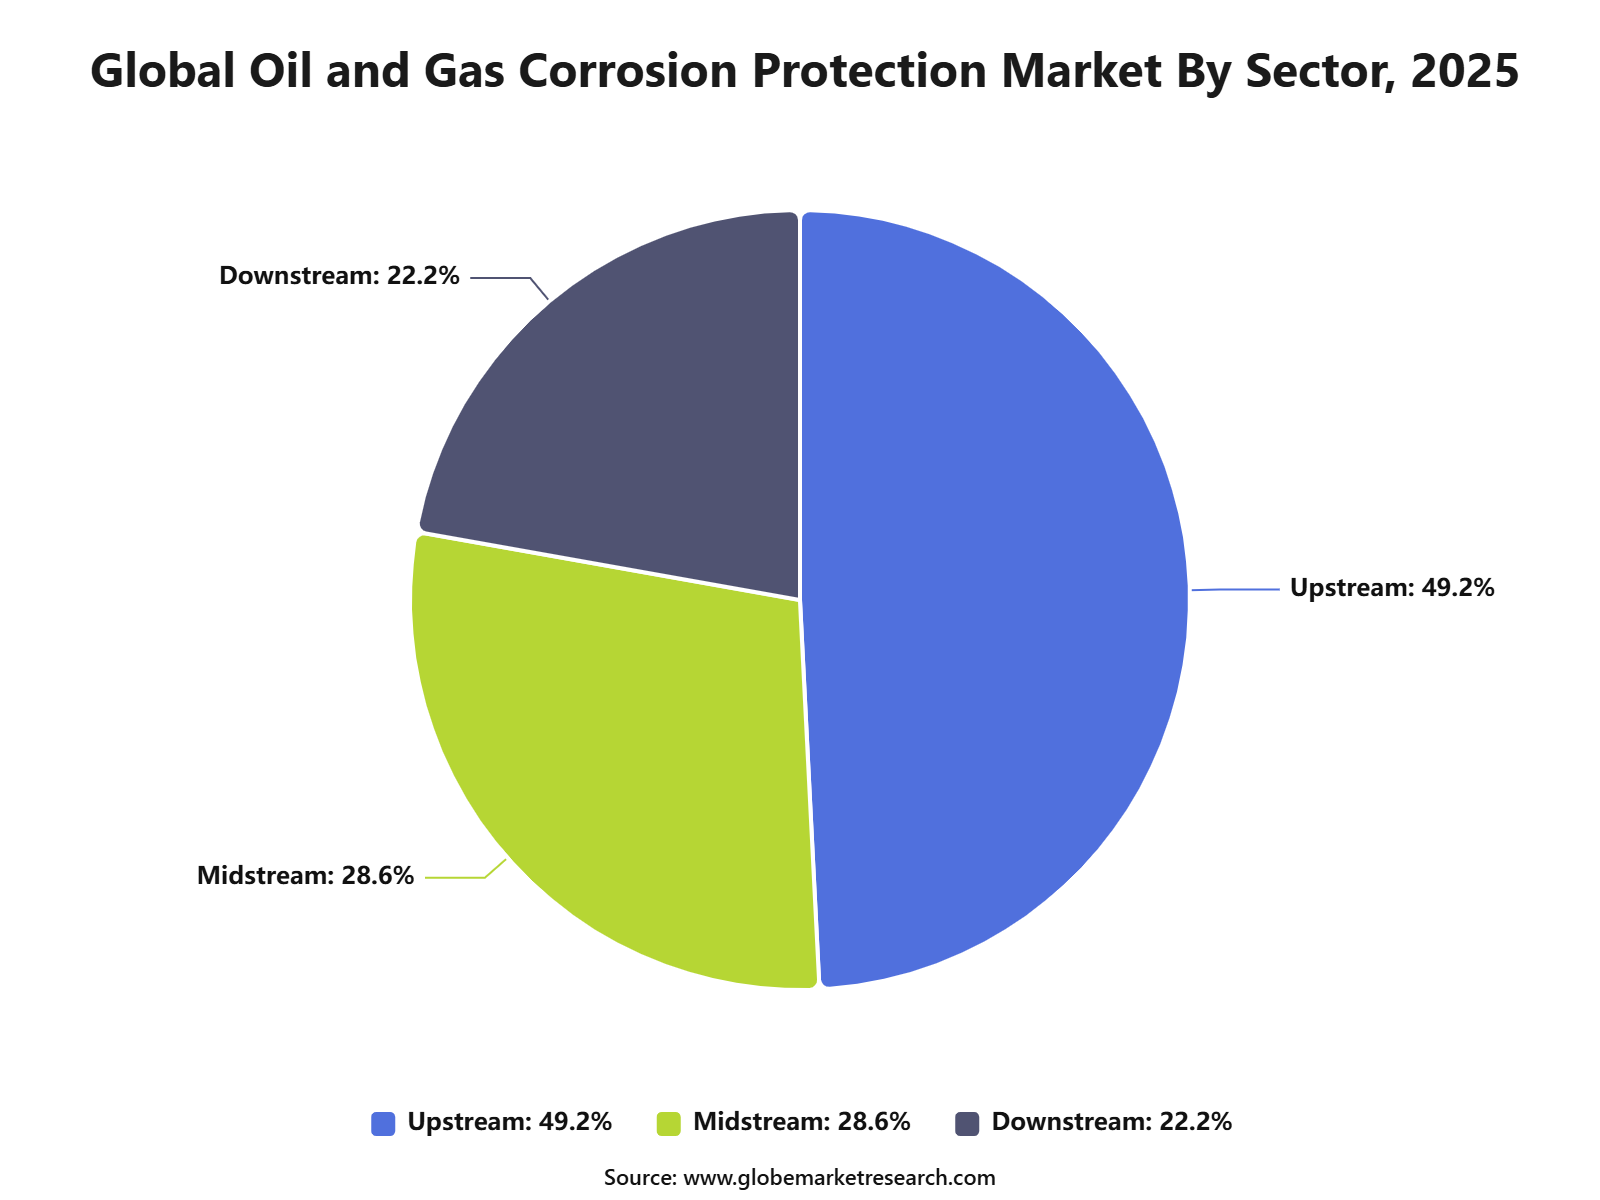 iThe graph shows projected market growth until 2035 based on CAGR analysis. Actual outcomes may vary depending on changing demand, competition, and economic factors.To gain greater insights - request a sample report PDF
By Region
Middle East and Africa accounted for 34.7% share of the Oil and Gas Corrosion Protection Market, reaching USD 4.6 billion. The region’s leadership is supported by large oil and gas production capacity, extensive pipeline networks, offshore fields, refineries, and petrochemical infrastructure.
Saudi Arabia, the United Arab Emirates, Qatar, Kuwait, Oman, Iraq, Nigeria, Angola, and South Africa are key contributors to regional demand. Corrosion protection is widely required due to high temperatures, saline environments, sour gas exposure, and heavy reliance on long-life energy infrastructure.
Middle East and Africa is expected to maintain a strong position as oil and gas producers invest in field development, asset maintenance, refinery upgrades, and offshore projects. Demand will remain supported by coatings, inhibitors, cathodic protection systems, and inspection technologies used to protect critical energy assets.
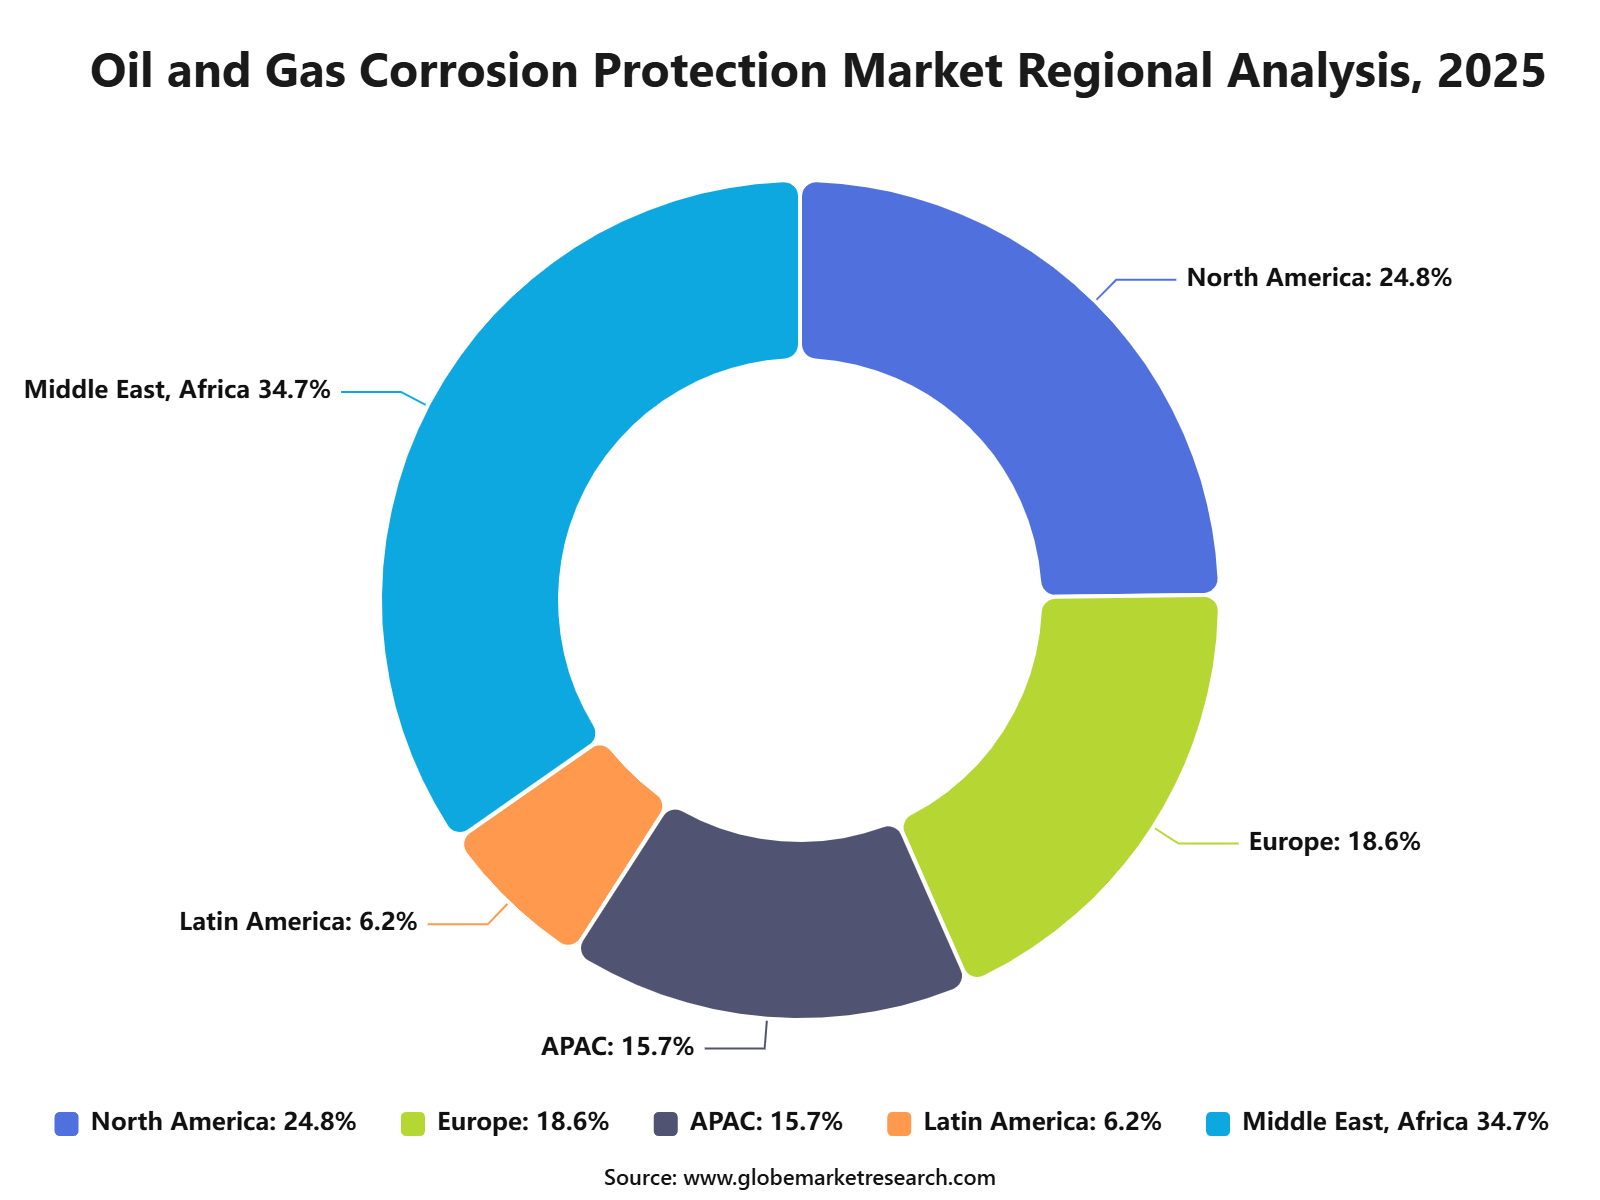 iThe graph shows projected market growth until 2035 based on CAGR analysis. Actual outcomes may vary depending on changing demand, competition, and economic factors.To gain greater insights - request a sample report PDF
Regional Impact Analysis
Middle East and Africa leads the Oil and Gas Corrosion Protection Market with 34.7% share in 2025, valued at around USD 4.7 billion, supported by large upstream production, offshore assets, refineries, pipelines, storage terminals, and harsh operating conditions. Saudi Arabia, UAE, Qatar, Kuwait, Nigeria, and South Africa remain key markets for corrosion protection demand.
North America remains important because of extensive pipeline systems, shale production assets, LNG infrastructure, and refinery maintenance needs. Asia Pacific supports future growth through refinery expansion, offshore development, petrochemical investment, and growing natural gas infrastructure.
Impact Factor | Estimated CAGR Impact | Regional Relevance | Market Impact |
|---|---|---|---|
Middle East and Africa market leadership | +1.9% | Middle East and Africa, 34.7% share in 2025 | Leads global value demand. |
Gulf oil and gas infrastructure | +1.3% | Saudi Arabia, UAE, Qatar, Kuwait | Drives regional demand. |
African offshore and pipeline activity | +0.9% | Nigeria, Angola, Egypt, South Africa | Supports asset protection. |
North America pipeline modernization | +0.8% | U.S. and Canada | Adds replacement demand. |
Asia Pacific refining and LNG growth | +0.7% | China, India, Southeast Asia | Builds future expansion. |
Go-To-Market and Sales Economics
Corrosion protection suppliers should focus on asset owners with high operating intensity, long service lives, and strict inspection cycles. The U.S. Energy Information Administration expects U.S. crude oil production to average 13.7 million barrels per day in 2026, while liquid-fuels consumption reaches 20.7 million barrels per day. This supports recurring demand for coatings, cathodic protection, monitoring, and repair services.
A strong sales model should combine specification support, field application, inspection, and lifecycle maintenance rather than selling coatings alone. PHMSA reported 227,457 miles of hazardous-liquid pipelines and 413,330 miles of gas transmission and gathering lines for 2025. Large installed networks create repeat opportunities through recoating, internal corrosion control, integrity assessments, and emergency rehabilitation contracts.
Offshore sales should be organized around engineering contractors, platform operators, fabricators, and maintenance shutdown schedules. BSEE reported record U.S. Outer Continental Shelf oil production of 714 million barrels in 2025, while BOEM states that the Gulf supplies about 97% of U.S. offshore oil and gas output. Vendor qualification, local applicator networks, and rapid mobilization are therefore critical.
Risk Factors & Market Barriers
Oil-price volatility remains the main commercial barrier because operators can delay discretionary maintenance when cash flows weaken. EIA reported Brent crude averaging USD 85 per barrel in June 2026 and forecast USD 74 per barrel for the third quarter. Suppliers should protect margins through indexed pricing, phased contracts, and service packages tied to mandatory integrity work rather than expansion-only spending.
Raw-material and logistics costs can reduce bid profitability, particularly for epoxy resins, zinc-rich systems, specialty pigments, and offshore transport. U.S. producer-price data showed stage-one intermediate-demand prices rising 12.3% year over year in May 2026, the strongest increase since June 2022. Multi-source procurement, regional stockholding, and shorter quotation-validity periods are required to manage this exposure.
Qualification cycles and regulatory compliance can slow market entry because operators require proven performance under pressure, temperature, immersion, and chemical exposure. PHMSA stated in 2026 that corrosion remains a primary threat to pipeline longevity, while BSEE continued risk-based offshore inspections and safety alerts. New suppliers must budget for testing, documentation, applicator training, audits, and extended approval timelines.
Revenue Potential Analysis
Revenue Landscape Across
Upstream assets provide the largest near-term opportunity because production growth requires continuous protection of wells, flowlines, separators, tanks, and processing equipment. Aramco issued 2026 capital-investment guidance of USD 50 billion to USD 55 billion, while ExxonMobil expects USD 27 billion to USD 29 billion. These budgets support demand for high-temperature coatings, chemical inhibitors, linings, and inspection technologies.
Midstream revenue is supported by the scale and strategic importance of pipeline infrastructure. PHMSA oversees about 3.3 million miles of regulated pipelines, and pipelines transport approximately 64% of U.S. energy commodities. Revenue opportunities are concentrated in integrity-management programs, corrosion mapping, cathodic-protection upgrades, inline inspection support, rehabilitation coatings, and condition-based maintenance for aging steel networks.
International offshore and refining programs offer additional revenue through large project pipelines and long-term service frameworks. Petrobras allocated USD 69.2 billion to exploration and production projects in its 2026–2030 plan. ADNOC also announced USD 55 billion of project awards for 2026–2028, expanding addressable demand across offshore structures, terminals, process units, storage assets, and export infrastructure.
Financial Impact
Financial returns improve when suppliers move from one-time product sales to multi-year asset-protection agreements. Chevron set an organic 2026 capital budget of USD 18 billion to USD 19 billion, while Shell expects cash capital expenditure of USD 24 billion to USD 26 billion. Bundled inspection, application, monitoring, and warranty services can secure recurring revenue and improve customer retention.
Contract value can be expanded through performance-based pricing linked to coating life, reduced shutdown frequency, leakage prevention, and inspection findings. BP maintained 2026 capital-expenditure guidance of USD 13 billion to USD 13.5 billion. Suppliers that document total ownership cost, application productivity, and avoided rework are better positioned to protect margins during procurement negotiations and budget reviews.
Customer spending capacity remains strong where production and cash generation are improving, but purchasing decisions are increasingly return-focused. Petrobras reported first-quarter 2026 net profit of USD 6.2 billion and adjusted EBITDA of USD 11.3 billion. Corrosion-protection proposals should therefore quantify service-life extension, maintenance savings, production continuity, safety improvement, and compliance value in financial terms.
Drivers Impact Analysis
The Oil and Gas Corrosion Protection Market is driven by aging pipeline networks, offshore production growth, refinery maintenance, harsh operating environments, and the need to reduce asset failure risk. Corrosion protection is essential for pipelines, storage tanks, drilling equipment, offshore platforms, processing units, and subsea infrastructure.
Middle East and Africa leads the market due to large oil and gas reserves, extensive upstream activity, offshore developments, and high exposure to heat, salinity, sand, moisture, and sour gas conditions. Saudi Arabia, UAE, Qatar, Kuwait, Nigeria, and South Africa remain important contributors because of major hydrocarbon infrastructure and long-term asset protection needs.
Impact Factor | Estimated CAGR Impact | Regional Relevance | Market Impact |
|---|---|---|---|
Aging oil and gas infrastructure | +1.6% | Middle East and Africa, North America, Europe | Drives replacement and maintenance demand. |
Offshore exploration and production growth | +1.3% | Middle East, Africa, North Sea, Brazil | Increases corrosion protection needs. |
Pipeline safety and integrity requirements | +1.1% | Global oil and gas networks | Supports coatings and monitoring use. |
Harsh operating environments | +0.9% | Gulf region, offshore Africa, deserts, marine fields | Raises protection intensity. |
Demand to reduce downtime and leaks | +0.7% | Upstream, midstream, downstream assets | Improves asset reliability. |
Restraints Impact Analysis
The market faces restraints from high application cost, complex surface preparation, project shutdown requirements, and volatility in oil and gas capital spending. Corrosion protection projects often require skilled labor, inspection, coatings, inhibitors, cathodic protection systems, and planned maintenance windows.
Another restraint is the technical difficulty of protecting assets in extreme conditions. Offshore platforms, sour gas fields, subsea pipelines, and high-temperature processing units require specialized materials and testing, which increases cost and slows adoption.
Impact Factor | Estimated CAGR Impact | Regional Relevance | Market Impact |
|---|---|---|---|
High coating and protection cost | -0.8% | Global oil and gas operators | Slows large-scale upgrades. |
Oil and gas investment volatility | -0.7% | Upstream and offshore markets | Affects project timing. |
Shutdown and maintenance disruption | -0.6% | Refineries, pipelines, platforms | Increases operational burden. |
Complex surface preparation needs | -0.5% | Coating and repair projects | Raises execution difficulty. |
Technical performance limits in extreme sites | -0.4% | Offshore and sour gas fields | Requires advanced solutions. |
Opportunities Impact Analysis
Opportunities are strong in protective coatings, corrosion inhibitors, cathodic protection, pipeline integrity systems, tank lining, offshore platform protection, and corrosion monitoring sensors. These applications benefit from rising focus on safety, reliability, and asset life extension.
Higher-value opportunities are also emerging in smart corrosion monitoring, nanocoatings, high-performance epoxy systems, subsea corrosion protection, and digital inspection platforms. Companies that reduce maintenance cost and extend asset life can capture stronger long-term demand.
Impact Factor | Estimated CAGR Impact | Regional Relevance | Market Impact |
|---|---|---|---|
Protective coating upgrades | +1.5% | Middle East and Africa, North America, Asia Pacific | Builds core market opportunity. |
Cathodic protection system expansion | +1.2% | Pipelines, tanks, offshore assets | Improves asset integrity. |
Corrosion inhibitors for production systems | +1.0% | Upstream and refinery operations | Reduces internal corrosion risk. |
Smart corrosion monitoring | +0.8% | Offshore and pipeline operators | Supports predictive maintenance. |
Subsea and offshore protection systems | +0.6% | Gulf, West Africa, North Sea | Adds high-value demand. |
Challenges Impact Analysis
The main challenge is ensuring long-term protection under high pressure, high temperature, saltwater exposure, chemical attack, and sour gas conditions. Oil and gas assets operate in demanding environments where coating failure or corrosion damage can cause costly shutdowns and safety risks.
Another challenge is inspection and maintenance access. Subsea pipelines, offshore structures, buried pipelines, and remote desert installations are difficult to monitor regularly, so operators need durable systems and reliable diagnostics.
Impact Factor | Estimated CAGR Impact | Regional Relevance | Market Impact |
|---|---|---|---|
Protecting assets in harsh environments | -0.7% | Offshore, desert, sour gas fields | Raises technical difficulty. |
Limited inspection access | -0.6% | Subsea, buried, remote assets | Increases monitoring risk. |
Ensuring coating durability | -0.5% | Pipelines, tanks, offshore platforms | Affects lifecycle performance. |
Managing skilled labor shortages | -0.4% | Maintenance and inspection markets | Slows project execution. |
Meeting strict safety standards | -0.4% | Regulated oil and gas operations | Adds compliance pressure. |
Segment Covered in the Report
By Type
Coatings
Paints
Corrosion Inhibitors
Others
By Location
Offshore
Onshore
By Sector
Upstream
Midstream
Downstream
By Region
North America
Europe
Asia Pacific
Latin America
Middle East and Africa
Market Trend Analysis
The market trend is moving toward advanced protective coatings, digital corrosion monitoring, cathodic protection upgrades, pipeline integrity management, and asset life extension programs. Operators are prioritizing preventive maintenance instead of reactive repair to reduce leaks, downtime, and safety incidents.
Middle East and Africa remains the largest value region because of extensive hydrocarbon infrastructure and harsh operating conditions. North America and Asia Pacific also support growth through pipeline modernization, LNG infrastructure, refinery maintenance, and offshore asset protection.
Impact Factor | Estimated CAGR Impact | Regional Relevance | Market Impact |
|---|---|---|---|
Advanced coating systems expand | +1.4% | Middle East and Africa, North America, Europe | Improves long-term protection. |
Digital corrosion monitoring rises | +1.1% | Offshore and pipeline operators | Enables early failure detection. |
Pipeline integrity programs strengthen | +0.9% | Global midstream markets | Supports safety and compliance. |
Asset life extension gains priority | +0.8% | Mature oil and gas assets | Reduces replacement cost. |
Offshore corrosion protection demand grows | +0.6% | Gulf region, Africa, North Sea | Adds premium applications. |
Investor Type Impact Matrix
Investors should focus on corrosion protection companies with proven coating performance, strong oilfield service relationships, inspection capability, and experience in offshore, pipeline, and refinery environments. Durability, compliance, technical support, and lifecycle savings are key success factors.
Strategic investors can also target coating manufacturers, corrosion inhibitor suppliers, cathodic protection firms, digital inspection platforms, offshore maintenance companies, and pipeline integrity service providers. Companies that reduce asset failure risk and extend infrastructure life are better positioned for steady growth.
Investor Type | Estimated CAGR Impact | Regional Relevance | Market Impact |
|---|---|---|---|
Protective Coating Manufacturers | +1.3% | Global | Expands surface protection supply. |
Corrosion Inhibitor Suppliers | +1.0% | Upstream, midstream, downstream markets | Supports internal corrosion control. |
Cathodic Protection Service Providers | +0.8% | Pipeline and storage infrastructure | Builds recurring service demand. |
Digital Inspection and Monitoring Firms | +0.7% | Offshore and large asset operators | Improves predictive maintenance. |
Strategic Oilfield Service Investors | +0.6% | Global oil and gas markets | Funds asset integrity solutions. |
Recent Developments
In June 2026, Chase Corporation detailed its Tapecoat corrosion-protection systems for pipelines, fittings, valves, flanges, and industrial assets, covering cold-applied tapes and hot-applied products for demanding moisture, soil, chemical, and mechanical exposures.
In May 2026, Ashland presented its expanded industrial-coatings additives portfolio, including rheology modifiers, foam-control agents, wetting agents, surface modifiers, and pH neutralizers designed to improve metal-coating application quality, stability, and performance.
In March 2025, RPM’s Carboline business reported independent laboratory testing of two-coat inorganic corrosion systems against galvanizing and thermal-spray alternatives, with one low-VOC system recording no scribe creep across all five tested panels.
In February 2025, 3M targeted a double-digit increase in product launches toward 1,000 introductions over three years, while continuing Scotchkote fusion-bonded and liquid epoxy systems for oil and gas pipeline corrosion protection.
Competitive Landscape
The market is characterized by intense competition among established players and emerging companies. Strategic partnerships, mergers and acquisitions, and product innovation are key strategies employed by market participants.
Key Market Players
3M Company
Aegion Corporation
Akzo Nobel N.V.
Ashland Global Specialty Chemicals Inc.
Axalta Coating Systems Ltd.
BASF SE
Chase Corporation
Hempel A/S
Jotun A/S
Metal Coatings Corp.
RPM International Inc.
The Sherwin-Williams Company
Other Key Players
Research Methodology
This market study is prepared using a combination of primary and secondary research. Primary research includes discussions with manufacturers, suppliers, distributors, consultants, industry experts, and end users. Secondary research covers company reports, government databases, trade associations, technical publications, regulatory sources, and trusted industry documents. The collected information is used to assess market demand, pricing trends, technology adoption, competitive activity, and regional performance.
AI language models are not used as primary data sources, and publicly available AI-generated content is not treated as market evidence. Computational tools may be used to support data processing, translation, data classification, and pattern identification. However, every published assessment is supported by verified sources, human review, and primary market discussions.
Market estimates are developed through top-down and bottom-up approaches and validated using data triangulation. Revenue, production, shipment, pricing, and application-level data are compared across multiple sources. Forecasts consider economic conditions, regulatory changes, investment activity, innovation, supply chain developments, and industry risks. All findings are reviewed through source verification and internal quality checks before publication.
Part I
Source Management & Input Data Standards
Who provides data, how sources are qualified, and what types of evidence are admissible.
Part II
Research Scope & Market Coverage
How we define the markets we assess and the parameters that govern each product.
Part III
Data Collection, Verification & Submission
The mechanics of gathering, cross-checking, and hierarchically ranking evidence.
Part IV
Assessment Determination & Quality Controls
How raw data becomes a published assessment — normalisation, expert judgement, and outlier exclusion.
Part V
Publication, Corrections & Revision
Our publication schedule, corrections policy, and methodology review cycle.
Part VI
Independence, Ethics & Complaints
Conflict-of-interest policies, editorial independence, and how clients raise concerns.
Google · Preferred Sources
Don't miss the latest market research insights and industry updates on Google.
Add Globe Market Research as a preferred source in the Google app to see our reports, analysis, and market stories in your news suggestions.
Meet the Team
This report was prepared by our expert analysts with deep industry knowledge and research experience.
Pratiksha K. is a Senior Research Analyst with more than five years of experience in market research, industry analysis, competitive intelligence, and business strategy. She has contributed to detailed market reports, customized research studies, company profiling, market sizing, trend analysis, and strategic consulting projects for clients across different regions. Her industry expertise covers Chemical and Material, Consumer Goods, Food & Beverages and Energy & Power. She closely evaluates changing customer requirements, technology developments, regulatory conditions, supply chain structures, investment activity, and competitive strategies to provide clear and practical market insights.
Sayali brings more than 7 years of experience to Globe Market Research, supporting the accuracy, clarity, and relevance of research content across multiple industries. She reviews market data, segment analysis, competitive insights, and industry trends to ensure each report meets strong quality standards and provides practical value to business decision-makers. Her expertise spans healthcare, information technology, consumer goods, and diverse cross-industry domains. With a strong focus on data reliability, structured analysis, and clear presentation, Sayali helps ensure that each research output delivers well-reviewed insights for clients, investors, consultants, and industry stakeholders.
Frequently Asked Questions
Related Reports
More in Energy and Power
Oil and Gas Turbomachinery Market to Hit USD 26.9 Billion by 2035
Oil and Gas Turbomachinery Market Size, Share, Analysis By Type (Gas Compressors, Gas and Steam Turbines, Pumps, Other Types), By Deployment (Onshore, Offshore), By Industry (Upstream, Midstream, Downstream), By Regional Insights, Business plan and Project Report, Investment Opportunities, Profitability, Industry Trends, Leading Companies and Growth Forecasts by 2025-2035
Liquefied Natural Gas (LNG) Bunkering Market to Hit USD 51.7 Billion by 2035
Liquefied Natural Gas (LNG) Bunkering Market Size, Share, Analysis By Product Type (Ship-to-Ship, Truck-to-Ship, Port-to-Ship, Portable Tanks), By Application (Cargo Fleet, Tanker Fleet, Container Fleet, Ferries, Inland Vessels, Others), By Regional Insights, Business plan and Project Report, Investment Opportunities, Profitability, Industry Trends, Leading Companies and Growth Forecasts by 2025-2035
Wind Energy Market to Hit USD 348.1 Billion by 2035
Wind Energy Market Size, Share, Analysis By Location (Onshore, Offshore), By Application (Utility, Non-Utility), By Component(Turbine, Support Structure, Electrical Infrastructure, Others), By Regional Insights, Business plan and Project Report, Investment Opportunities, Profitability, Industry Trends, Leading Companies and Growth Forecasts by 2025-2035
Power EPC Market to Hit USD 1,516.1 Billion by 2035
Power EPC Market Size, Share, Analysis By Type of Power Generation (Thermal Power, Renewable Energy, Nuclear Power, Hydropower, Others), By Service Type (Engineering, Procurement, Construction), By Equipment Type (Steam Turbines, Gas Turbines, Solar PV Systems, Wind Turbines, Boilers, Generators, Others), By Regional Insights, Business plan and Project Report, Investment Opportunities, Profitability, Industry Trends, Leading Companies and Growth Forecasts by 2025-2035