

Revenue, 2025
$ 42.1 Bn
Forecast, 2035
$ 83.6 Bn
CAGR, 2025-2035
7.1%
Report Coverage
Global
Market Size and Forecast
The Global Solvents Market was worth USD 42.1 billion in 2025 and is expected to reach USD 83.6 billion by 2035, growing at a CAGR of 7.1% from 2025 to 2035. Based on this growth rate, the market is estimated to reach around USD 46.3 billion in 2026. Asia Pacific held the largest regional share of 44.1% in 2025, valued at around USD 18.5 billion, supported by strong chemical manufacturing, paints and coatings demand, pharmaceutical production, and industrial processing activity.
The Solvents Market includes liquid chemical substances used to dissolve, disperse, or extract other materials without changing their chemical structure. These solvents are widely used in paints, coatings, adhesives, printing inks, pharmaceuticals, personal care products, cleaning agents, agrochemicals, polymers, and industrial formulations. The market is closely linked with construction, automotive, healthcare, packaging, textiles, and specialty chemical production.
Key Parameter | Report Details |
|---|---|
Market Revenue, 2025 | USD 42.1 Billion |
Projected Revenue, 2035 | USD 83.6 Billion |
CAGR (2025-2035) | 7.1% |
Largest Region | Asia Pacific (44.1% Share, USD 18.5 Bn) |
Market Concentration | Medium |
Base Year | 2025 |
Forecast Period | 2025-2035 |
The market outlook remains steady as demand continues to rise across manufacturing, coatings, cleaning, and formulation-based industries. Growth can be attributed to increasing use of solvent-based and bio-based formulations, expanding pharmaceutical production, and rising demand for high-performance coatings and adhesives. The expansion of greener solvents, low-VOC formulations, and sustainable chemical processing is expected to support long-term market demand.
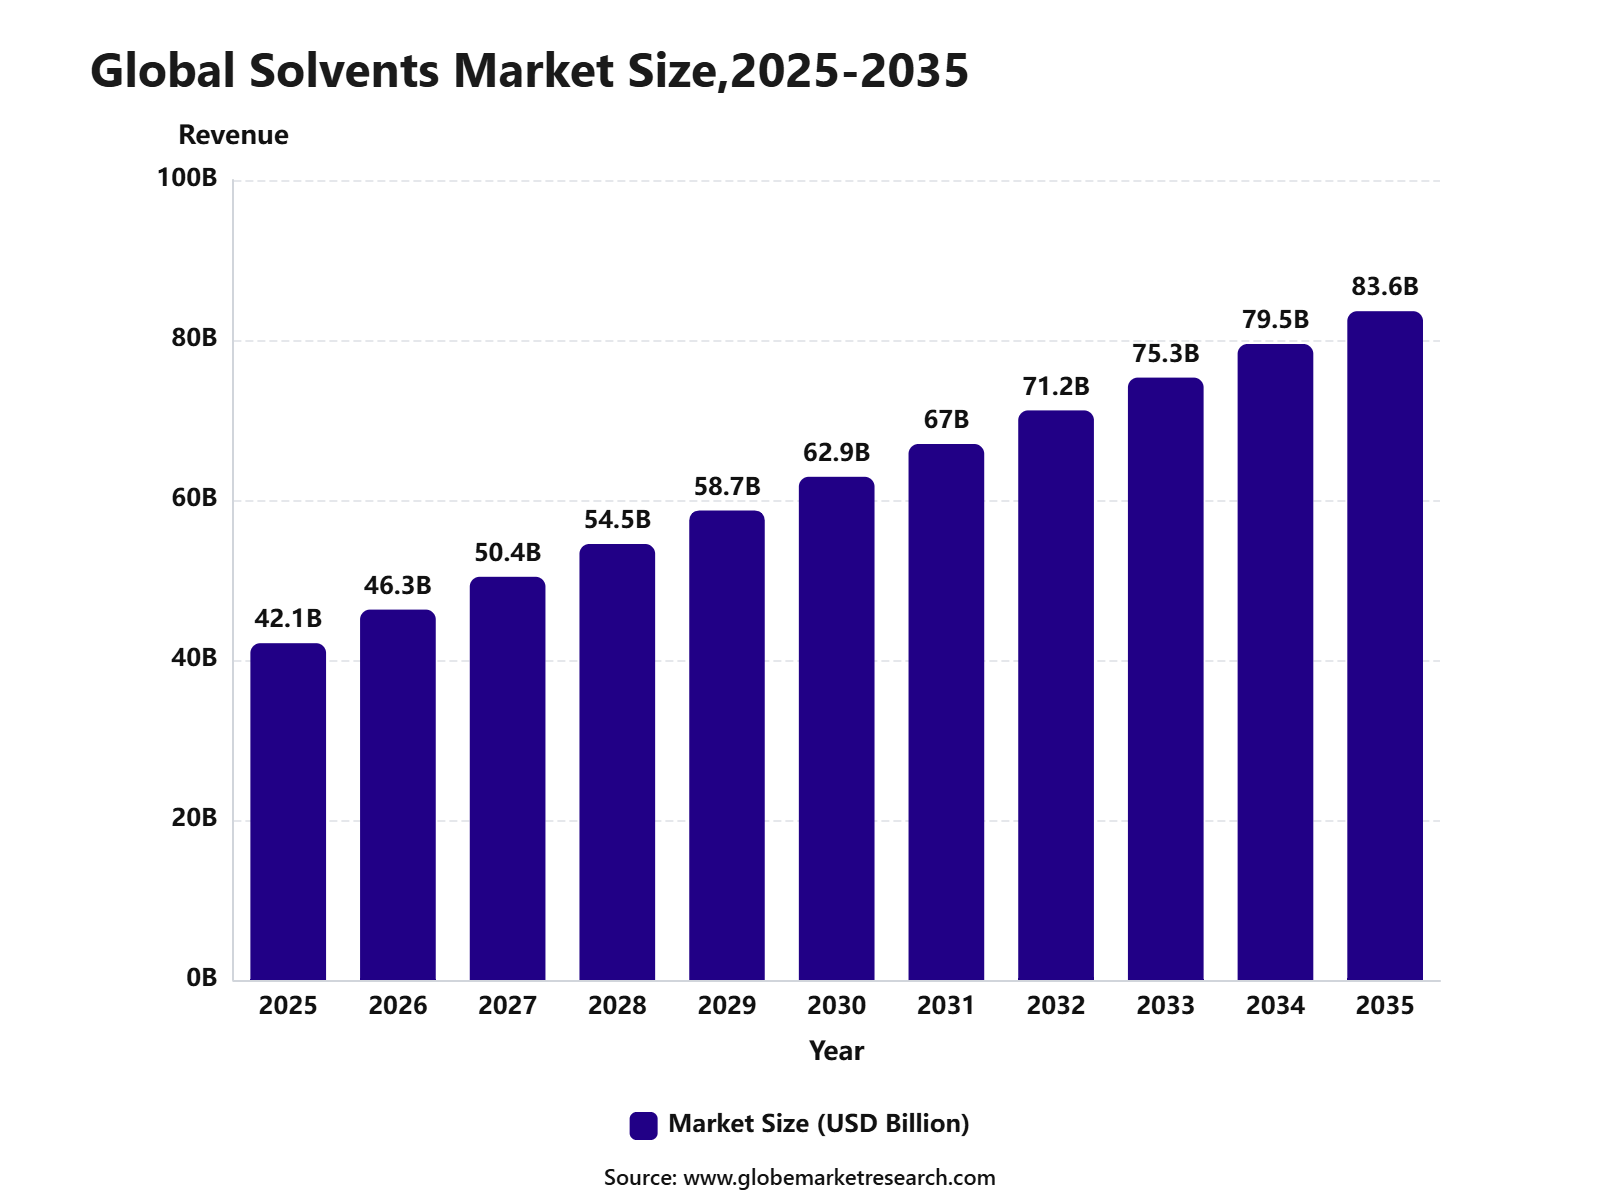 iThe graph shows projected market growth until 2035 based on CAGR analysis. Actual outcomes may vary depending on changing demand, competition, and economic factors.To gain greater insights - request a sample report PDF
Key Market Insights
Alcohols led the product type segment with 44.2% share, supported by their strong solvency, fast evaporation, wide availability, and broad use across coatings, inks, cleaning products, and chemical formulations.
Paints and coatings accounted for 57.8% share by application, driven by high solvent use in formulation, viscosity control, drying performance, surface finishing, and protective coating systems.
Asia Pacific led the solvents market with 44.1% share, supported by strong construction activity, expanding automotive production, large chemical manufacturing capacity, and rising demand from paints, coatings, and industrial applications.
Top Funding and Investment
Top Investments
In April 2025, Deepak Chem Tech approved a ₹3,500 crore investment for a Dahej complex with 300 KTA phenol, 185 KTA acetone, and 100 KTA IPA capacity.
In April 2026, SUEZ and partners advanced a RMB 190 million organic solvent recycling project in Chongqing, China, with Phase I capacity of 30,000 tonnes per year.
In 2025, Moeve/Cepsa targeted completion of a €75 million IPA plant in Spain, with 80,000 tonnes per year of isopropyl alcohol capacity.
In 2025, SOLRESS started a €9.1 million bio-based solvents project, supported by €7 million from the Circular Bio-based Europe Joint Undertaking.
In March 2026, an Exactmer-led consortium secured over £7 million for high-purity bio-based solvents for medicines manufacturing.
Top Funding
In March 2026, Exactmer-led consortium received over £7 million from Innovate UK and DHSC for pharmaceutical-grade bio-based solvents.
In September 2025, SOLRESS received €7 million CBE JU funding under a €9.1 million project budget for safer and sustainable bio-based solvents.
In 2025, solvent specialty-chemicals funding totaled $42.73 million.
By Product Type
Alcohols accounted for 44.2% share of the Solvents Market. This leading position is supported by their wide use as cleaning agents, extraction media, reaction carriers, and formulation solvents across paints, coatings, pharmaceuticals, personal care, adhesives, inks, and industrial processing.
Alcohol-based solvents such as ethanol, isopropanol, methanol, and butanol are preferred because they offer strong solvency, fast evaporation, easy blending, and compatibility with many organic and water-based systems. Their use is especially important where quick drying, surface cleaning, and formulation stability are required.
Demand for alcohols is expected to remain strong as manufacturers continue to use them in coatings, sanitizers, chemical intermediates, printing inks, and specialty formulations. Their broad availability and flexible performance make alcohols one of the most widely used solvent categories.
By Application
Paints and coatings accounted for 57.8% share of the Solvents Market. This dominance can be attributed to the high use of solvents in coating formulation, viscosity control, resin dissolution, surface wetting, drying performance, and film formation.
Solvents are used in architectural coatings, industrial coatings, automotive paints, marine coatings, wood finishes, protective coatings, and specialty surface treatments. They help improve application quality, leveling, adhesion, gloss, and overall coating performance.
The segment is expected to remain the largest application area as construction, automotive refinishing, industrial maintenance, and infrastructure protection continue to support coating demand. At the same time, manufacturers are shifting toward low-VOC and waterborne systems to meet environmental and worker safety requirements.
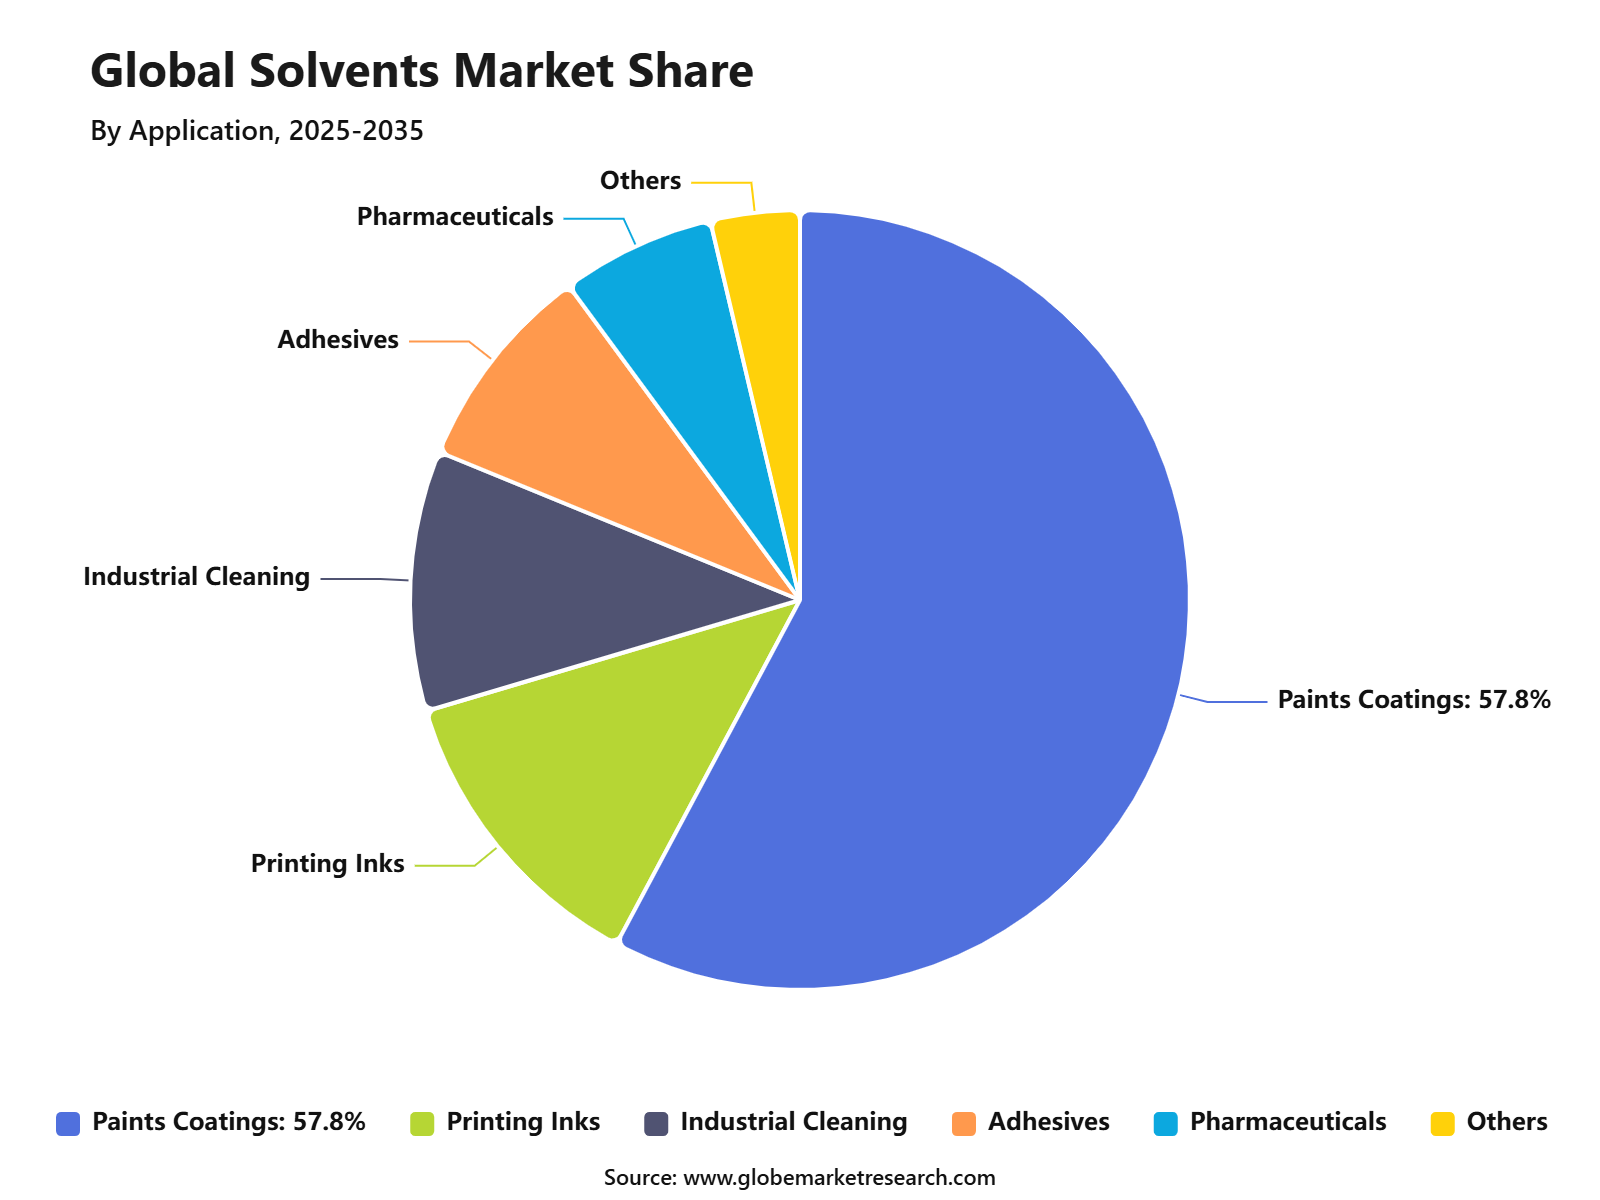 iThe graph shows projected market growth until 2035 based on CAGR analysis. Actual outcomes may vary depending on changing demand, competition, and economic factors.To gain greater insights - request a sample report PDF
By Region
Asia Pacific accounted for 44.1% share of the Solvents Market, reaching USD 18.5 billion. This leading position is supported by strong demand from paints and coatings, pharmaceuticals, adhesives, printing inks, personal care, electronics, and chemical manufacturing.
China, India, Japan, South Korea, Indonesia, Vietnam, and other Southeast Asian economies are major demand centers. The region benefits from large manufacturing capacity, rapid urban development, strong construction activity, and expanding industrial production.
Asia Pacific is expected to maintain its leading position as coating consumption, pharmaceutical production, packaging demand, and chemical processing continue to increase. Demand for cost-efficient, high-performance, and regulatory-compliant solvents will remain strong across the region.
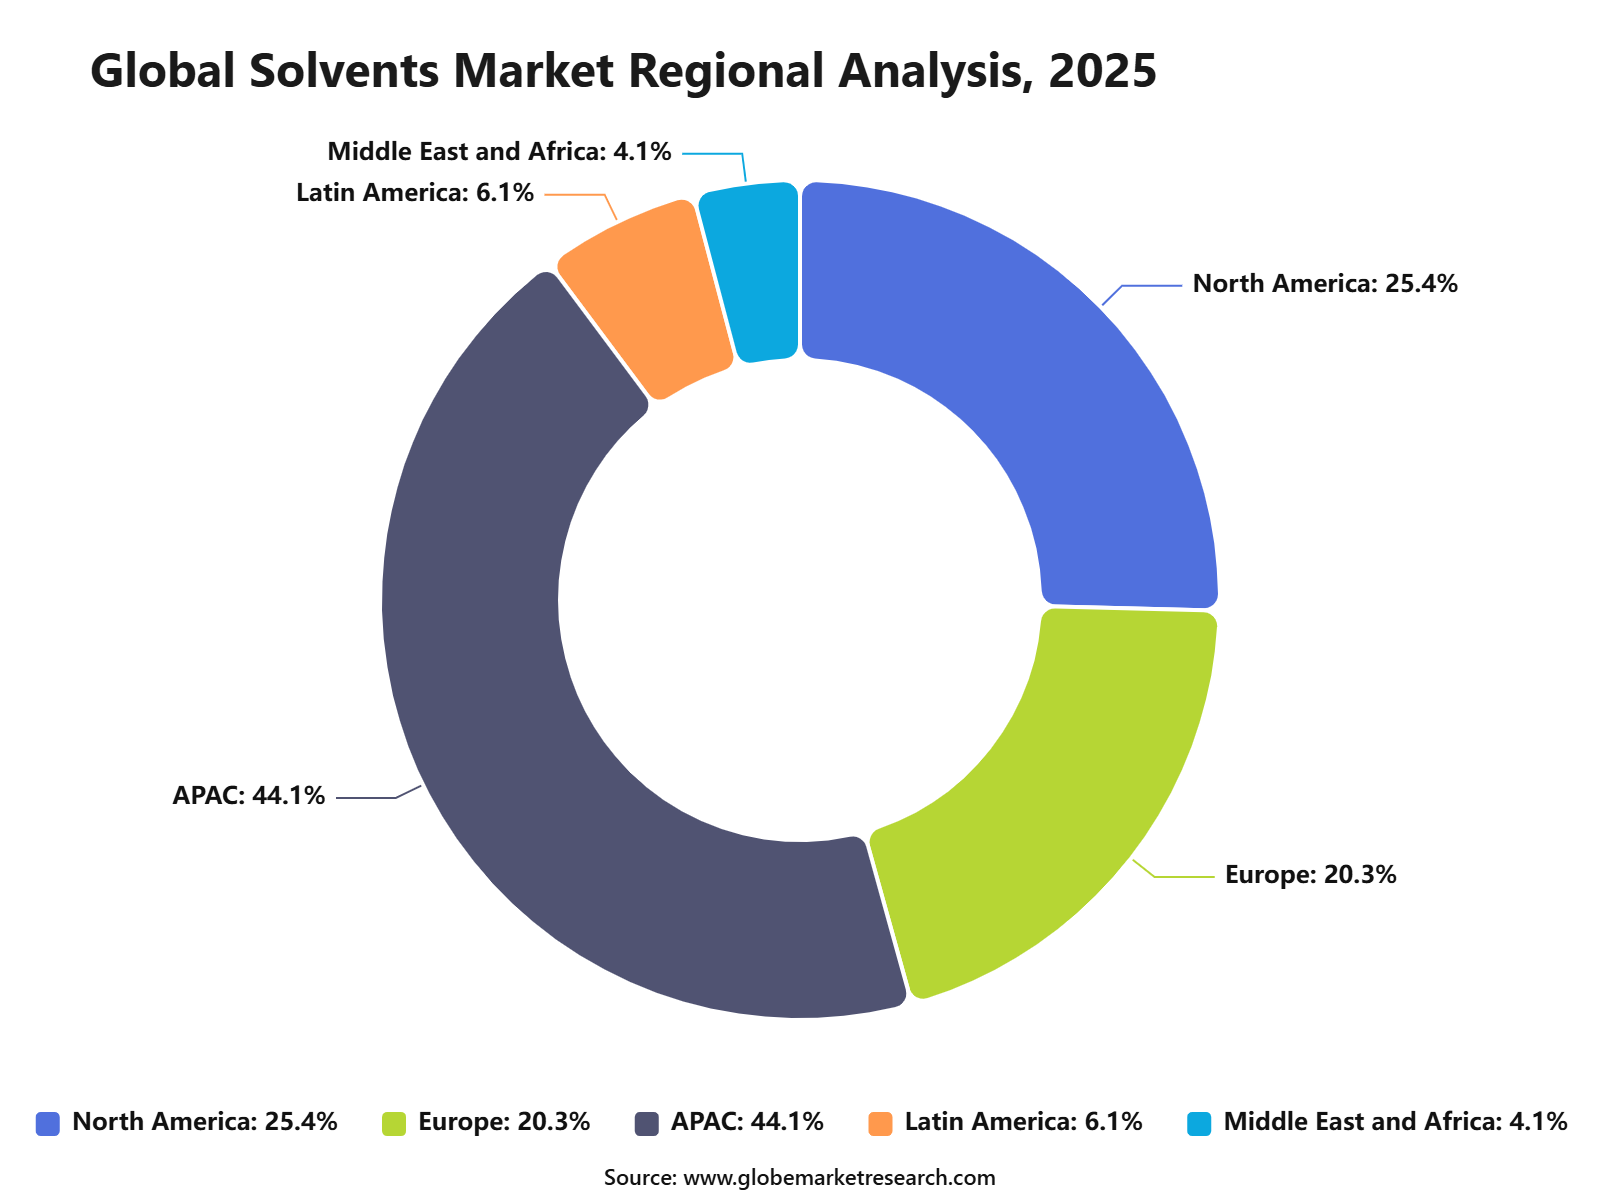 iThe graph shows projected market growth until 2035 based on CAGR analysis. Actual outcomes may vary depending on changing demand, competition, and economic factors.To gain greater insights - request a sample report PDF
Regional Impact Analysis
Asia Pacific leads the Solvents Market with 44.1% share in 2025, supported by strong coatings demand, pharmaceutical production, industrial manufacturing, chemical processing, and packaging growth. China and India remain major contributors due to large-scale chemical output, construction activity, and expanding domestic consumption.
North America remains important because of pharmaceutical manufacturing, specialty chemicals, coatings, and industrial cleaning demand. Europe supports value growth through low-VOC regulations, green chemistry adoption, solvent recovery, and sustainable formulation development.
Impact Factor | Estimated CAGR Impact | Regional Relevance | Market Impact |
|---|---|---|---|
Asia Pacific market leadership | +2.5% | Asia Pacific, 44.1% share in 2025 | Leads global demand. |
China coatings and chemical production | +1.5% | China | Drives regional consumption. |
India pharmaceutical and industrial growth | +1.2% | India | Supports future demand. |
North America specialty solvent demand | +0.9% | U.S. and Canada | Adds value growth. |
Europe low-VOC and green solvent adoption | +0.8% | Germany, France, UK, Italy | Supports premium solutions. |
Go-To-Market and Sales Economics
Solvents are commercialized through direct chemical supply contracts, distributors, formulators, coatings producers, pharmaceutical manufacturers, adhesive makers, electronics cleaning suppliers, and industrial cleaning companies. Demand is closely tied to wider chemical activity. The American Chemistry Council expects global chemical production to grow only 0.5% in 2026, making customer targeting and contract retention important.
Sales economics depend on purity grade, regulatory profile, bulk logistics, packaging format, and technical support. Paints, coatings, inks, adhesives, cleaning products, pharmaceuticals, and extraction processes remain core outlets. U.S. construction spending reached a seasonally adjusted annual rate of USD 2,210.2 billion in May 2026, supporting coating and adhesive demand.
Large suppliers are using scale and portfolio depth to protect sales in a softer chemical cycle. Dow reported Q1 2026 Industrial Intermediates & Infrastructure sales of USD 2.6 billion, down 8% year over year, while Performance Materials & Coatings sales were USD 2.1 billion. This shows mixed demand across solvent-linked applications.
Risk Factors & Market Barriers
The main barrier is regulatory pressure on hazardous and high-VOC solvents. EPA’s methylene chloride rule prohibits manufacturing, processing, and distribution for all consumer uses and restricts most industrial and commercial uses, including many paint and coating remover applications. This raises reformulation costs and shifts demand toward safer alternatives.
Feedstock volatility is another major risk because many solvents depend on crude oil, natural gas liquids, and petrochemical intermediates. EIA’s 2026 outlook shows global oil demand could fall by 1.1 million barrels per day from 104.0 million barrels per day in 2025, highlighting uncertainty across energy-linked chemical chains.
Customer-side weakness can also delay solvent purchases. Ashland reported Q2 fiscal 2026 sales of USD 482 million, up only 1%, with stable volumes, 2% pricing decline, and softness in Intermediates. This indicates that solvent-linked specialty markets remain exposed to pricing pressure, destocking, and slower industrial orders.
Revenue Potential Analysis
Revenue Landscape Across
Revenue is distributed across oxygenated solvents, hydrocarbon solvents, halogenated solvents, bio-based solvents, glycol ethers, alcohols, ketones, esters, and specialty blends. Coatings, printing inks, adhesives, personal care, agrochemicals, pharmaceuticals, and cleaning products remain major demand areas. Suppliers with customized blends can capture higher value than commodity bulk sellers.
Pharmaceutical and life-science applications provide a higher-value revenue base because solvent purity, documentation, and validated supply are critical. FDA notes that drug shortages can occur from manufacturing problems, quality issues, delays, and discontinuations. This makes reliable solvent supply important for active pharmaceutical ingredient production and finished-dose manufacturing.
Regional revenue is strongest where chemical production, construction, manufacturing, and consumer goods remain active. BASF’s Q1 2026 assumptions included 2.4% chemical production growth and a Brent oil price assumption of USD 65 per barrel for 2026. These indicators support steady solvent demand, but pricing discipline remains necessary.
Financial Impact
Solvents affect financial performance through production yield, drying speed, formulation stability, cleaning efficiency, and regulatory compliance. For customers, the lowest-cost solvent is not always the best option if it increases emissions, waste handling, worker-safety costs, or reformulation risk. This gives compliant, low-toxicity, and bio-based solvent suppliers stronger pricing power.
Margin pressure is visible when industrial demand slows or customers trade down to lower-cost blends. Dow’s Q1 2026 local price decline of 8% in Industrial Intermediates & Infrastructure shows how pricing can weaken even for large integrated suppliers. Solvent producers must manage feedstock exposure, inventory, and contract terms carefully.
The strongest financial impact is expected from safer solvents, high-purity grades, electronics cleaning, pharmaceutical processing, and low-VOC coatings. EPA’s restrictions on methylene chloride are pushing substitution toward dibasic esters, ethyl acetate, benzyl alcohol, aqueous systems, and other alternatives. Companies that support compliant reformulation can protect revenue and customer retention.
Drivers Impact Analysis
The Solvents Market is driven by rising demand from paints and coatings, adhesives, pharmaceuticals, personal care, printing inks, cleaning products, agrochemicals, and chemical processing. Solvents are widely used for dissolving, dispersing, extraction, purification, viscosity control, and surface preparation across industrial and consumer applications.
Asia Pacific leads the market due to strong manufacturing activity, large construction output, expanding automotive production, pharmaceutical growth, and high chemical consumption. China, India, Japan, South Korea, and Southeast Asia remain key contributors because of their large coatings, industrial chemicals, electronics, and packaging industries.
Impact Factor | Estimated CAGR Impact | Regional Relevance | Market Impact |
|---|---|---|---|
Growth in paints and coatings demand | +1.9% | Asia Pacific, North America, Europe | Drives core solvent usage. |
Expansion of pharmaceutical manufacturing | +1.5% | India, China, U.S., Europe | Supports high-purity solvent demand. |
Rising adhesive and sealant production | +1.3% | China, India, Southeast Asia | Adds industrial consumption. |
Growth in cleaning and degreasing applications | +1.1% | Global manufacturing hubs | Builds recurring demand. |
Chemical processing and extraction needs | +0.9% | Asia Pacific and chemical clusters | Supports process solvent use. |
Restraints Impact Analysis
The market faces restraints from volatile organic compound regulations, worker safety requirements, flammability risks, and environmental concerns. Solvents used in coatings, inks, cleaning, and industrial processing must meet stricter emission and exposure standards.
Another restraint is raw material price volatility. Many solvents are linked to petrochemical feedstocks, energy prices, logistics costs, and supply chain conditions, which can pressure manufacturers and end users.
Impact Factor | Estimated CAGR Impact | Regional Relevance | Market Impact |
|---|---|---|---|
VOC emission regulations | -1.0% | Europe, North America, Japan, China | Limits high-emission solvent use. |
Health and safety concerns | -0.9% | Industrial and consumer markets | Raises compliance burden. |
Raw material price volatility | -0.8% | Global solvent producers | Pressures margins. |
Shift toward water-based systems | -0.7% | Paints, coatings, adhesives | Reduces solvent intensity. |
Flammability and storage risks | -0.5% | Manufacturing and logistics sites | Adds handling cost. |
Opportunities Impact Analysis
Opportunities are strong in bio-based solvents, green solvents, oxygenated solvents, high-purity pharmaceutical solvents, specialty solvents, and low-VOC formulations. These areas benefit from regulatory pressure, sustainability targets, and demand for safer chemical solutions.
Higher-value opportunities are also emerging in electronics cleaning, battery manufacturing, agrochemical formulation, personal care, and advanced coatings. Companies that offer safer, lower-odor, high-performance, and compliant solvent systems can capture stronger long-term demand.
Impact Factor | Estimated CAGR Impact | Regional Relevance | Market Impact |
|---|---|---|---|
Bio-based solvent development | +1.8% | Europe, North America, Japan, India | Creates sustainable growth. |
High-purity pharmaceutical solvents | +1.5% | India, China, U.S., Europe | Builds premium demand. |
Low-VOC solvent formulations | +1.3% | Regulated coating markets | Supports compliance-led adoption. |
Electronics and precision cleaning solvents | +1.1% | China, South Korea, Japan, Taiwan | Adds specialty value. |
Agrochemical formulation solvents | +0.9% | Asia Pacific, Latin America | Expands application scope. |
Challenges Impact Analysis
The main challenge is balancing performance, cost, safety, and environmental compliance. Solvents must deliver strong solvency, evaporation rate, purity, and compatibility while meeting lower-emission and safer-use requirements.
Another challenge is reformulating products without affecting performance. Paints, coatings, inks, adhesives, pharmaceuticals, and personal care products often require precise solvent behavior, so replacement or reduction can take time and testing.
Impact Factor | Estimated CAGR Impact | Regional Relevance | Market Impact |
|---|---|---|---|
Balancing performance and compliance | -0.9% | Global formulation markets | Increases development complexity. |
Reformulation difficulty | -0.8% | Coatings, inks, adhesives | Slows product transition. |
Managing solvent recovery and disposal | -0.7% | Industrial processing plants | Adds operating cost. |
Maintaining consistent purity | -0.6% | Pharma and electronics sectors | Affects quality standards. |
Reducing workplace exposure risks | -0.5% | Manufacturing facilities | Raises safety investment. |
Segment Covered in the Report
By Product Type
Alcohols
Ketones
Esters
Hydrocarbons
Glycol Ethers
Others
By Application
Paints and Coatings
Printing Inks
Industrial Cleaning
Adhesives
Pharmaceuticals
Others
By Region
North America
Europe
Asia Pacific
Latin America
Middle East and Africa
Market Trend Analysis
The market trend is moving toward oxygenated solvents, alcohols, ketones, esters, glycol ethers, bio-based solvents, and low-VOC solvent systems. Demand remains strong where solvents provide essential performance in coatings, pharmaceuticals, adhesives, cleaning, and chemical processing.
Sustainable chemistry is becoming more important as manufacturers shift toward safer and lower-emission alternatives. Asia Pacific continues to lead volume demand, while Europe and North America support value growth through green solvent innovation and stricter compliance requirements.
Impact Factor | Estimated CAGR Impact | Regional Relevance | Market Impact |
|---|---|---|---|
Oxygenated solvent demand remains strong | +1.7% | Asia Pacific, Europe, North America | Leads broad application use. |
Low-VOC solvent systems expand | +1.4% | Europe, North America, developed Asia | Supports regulatory compliance. |
Bio-based solvents gain traction | +1.2% | Europe, U.S., Japan, India | Builds sustainable positioning. |
High-purity solvent use increases | +1.0% | Pharma and electronics markets | Adds premium demand. |
Solvent recovery and recycling rise | +0.8% | Industrial processing facilities | Improves cost and sustainability. |
Investor Type Impact Matrix
Investors should focus on solvent companies with strong feedstock access, specialty grade capability, regulatory compliance strength, solvent recovery services, and exposure to coatings, pharma, electronics, and industrial cleaning customers. Quality, safety, and supply reliability are key success factors.
Strategic investors can also target bio-based solvent producers, high-purity solvent suppliers, low-VOC formulation firms, recovery service providers, and specialty solvent distributors. Companies that reduce emissions while maintaining performance are better positioned for long-term growth.
Investor Type | Estimated CAGR Impact | Regional Relevance | Market Impact |
|---|---|---|---|
Solvent Manufacturers | +1.5% | Global | Expands industrial solvent supply. |
Bio-based Solvent Producers | +1.3% | Europe, North America, Asia Pacific | Supports sustainable chemistry. |
Pharmaceutical and Electronics Solvent Suppliers | +1.1% | India, China, U.S., Japan | Builds premium demand. |
Solvent Recovery Service Providers | +0.9% | Industrial processing hubs | Improves cost and compliance. |
Strategic Specialty Chemical Investors | +0.7% | Global chemical markets | Funds advanced solvent platforms. |
Recent Developments
May 2026: Sasol Chemicals announced solvent price increases effective May 7, 2026, covering methyl ethyl ketone and isopropyl alcohol. Its solvent portfolio includes ketones, alcohols and acrylates for industrial applications
April 2026: Eastman reported more than 10% sequential sales volume and mix improvement in specialty businesses and around USD 500 million of price increases, supporting specialty materials, intermediates and solvent-linked applications.
March 2025: ExxonMobil announced a USD 100 million Baton Rouge upgrade to produce 99.999% high-purity isopropyl alcohol for semiconductor cleaning, targeting domestic supply by 2027 and reducing reliance on long-distance imports.
Competitive Landscape
The market is characterized by intense competition among established players and emerging companies. Strategic partnerships, mergers and acquisitions, and product innovation are key strategies employed by market participants.
Key Market Players
Exxon Mobil Corporation
Shell plc
BASF SE
LyondellBasell Industries Holdings B.V.
Dow Inc.
Eastman Chemical Company
INEOS Group
Celanese Corporation
Solvay S.A.
Sasol Limited
Mitsubishi Chemical Group
Ashland Global Holdings Inc.
Huntsman Corporation
Arkema S.A.
Honeywell International Inc.
Other Key players
Research Methodology
This market study is prepared using a combination of primary and secondary research. Primary research includes discussions with manufacturers, suppliers, distributors, consultants, industry experts, and end users. Secondary research covers company reports, government databases, trade associations, technical publications, regulatory sources, and trusted industry documents. The collected information is used to assess market demand, pricing trends, technology adoption, competitive activity, and regional performance.
AI language models are not used as primary data sources, and publicly available AI-generated content is not treated as market evidence. Computational tools may be used to support data processing, translation, data classification, and pattern identification. However, every published assessment is supported by verified sources, human review, and primary market discussions.
Market estimates are developed through top-down and bottom-up approaches and validated using data triangulation. Revenue, production, shipment, pricing, and application-level data are compared across multiple sources. Forecasts consider economic conditions, regulatory changes, investment activity, innovation, supply chain developments, and industry risks. All findings are reviewed through source verification and internal quality checks before publication.
Part I
Source Management & Input Data Standards
Who provides data, how sources are qualified, and what types of evidence are admissible.
Part II
Research Scope & Market Coverage
How we define the markets we assess and the parameters that govern each product.
Part III
Data Collection, Verification & Submission
The mechanics of gathering, cross-checking, and hierarchically ranking evidence.
Part IV
Assessment Determination & Quality Controls
How raw data becomes a published assessment — normalisation, expert judgement, and outlier exclusion.
Part V
Publication, Corrections & Revision
Our publication schedule, corrections policy, and methodology review cycle.
Part VI
Independence, Ethics & Complaints
Conflict-of-interest policies, editorial independence, and how clients raise concerns.
Google · Preferred Sources
Don't miss the latest market research insights and industry updates on Google.
Add Globe Market Research as a preferred source in the Google app to see our reports, analysis, and market stories in your news suggestions.
Meet the Team
This report was prepared by our expert analysts with deep industry knowledge and research experience.
Pratiksha K. is a Senior Research Analyst with more than five years of experience in market research, industry analysis, competitive intelligence, and business strategy. She has contributed to detailed market reports, customized research studies, company profiling, market sizing, trend analysis, and strategic consulting projects for clients across different regions. Her industry expertise covers Chemical and Material, Consumer Goods, Food & Beverages and Energy & Power. She closely evaluates changing customer requirements, technology developments, regulatory conditions, supply chain structures, investment activity, and competitive strategies to provide clear and practical market insights.
Sayali brings more than 7 years of experience to Globe Market Research, supporting the accuracy, clarity, and relevance of research content across multiple industries. She reviews market data, segment analysis, competitive insights, and industry trends to ensure each report meets strong quality standards and provides practical value to business decision-makers. Her expertise spans healthcare, information technology, consumer goods, and diverse cross-industry domains. With a strong focus on data reliability, structured analysis, and clear presentation, Sayali helps ensure that each research output delivers well-reviewed insights for clients, investors, consultants, and industry stakeholders.
Frequently Asked Questions
Related Reports
More in Chemical and Material
Sulfuric Acid Market to Hit USD 61.5 Billion by 2035
Sulfuric Acid Market Size, Share, Analysis By Raw Material (Elemental Sulfur, Base Metal Smelters, Pyrite Ore, Others), By Application (Fertilizers, Chemical Manufacturing, Metal Processing, Petroleum Refining, Textile, Automotive, Pulp and Paper, Others), By Distribution Channel (Direct Sales, Distributors), By Regional Insights, Business plan and Project Report, Investment Opportunities, Profitability, Industry Trends, Leading Companies and Growth Forecasts by 2026-2035
Powder Metallurgy Market to Hit USD 17.0 Billion by 2035
Powder Metallurgy Market Size, Share, Analysis By Material (Ferrous Metals, Non-Ferrous Metals, Others), By Process (Additive Manufacturing, Powder Metal Hot Isostatic Pressing, Conventional Powder Metallurgy), By Application (Automotive, Aerospace and Defense, Healthcare, Electrical and Electronics, Industrial Machinery, Others) , By Regional Insights, Business plan and Project Report, Investment Opportunities, Profitability, Industry Trends, Leading Companies and Growth Forecasts by 2026-2035
Bromine Market to Hit USD 1.5 Billion by 2035
Bromine Market Size, Share, Analysis By Derivative (Organobromine, Clear Brine Fluids, Hydrogen Bromide, Others), By Application (Flame Retardants, Oil and Gas Drilling, Biocides, PTA Synthesis, Plasma Etching, Pharmaceuticals, Energy Storage, Others), By End-Use Industry (Chemicals, Oil and Gas, Pharmaceuticals, Electrical and Electronics, Automotive, Agriculture, Others), By Regional Insights, Business plan and Project Report, Investment Opportunities, Profitability, Industry Trends, Leading Companies and Growth Forecasts by 2026-2035
Hydrogen Cyanide Market to Hit USD 5.95 Billion by 2035
Hydrogen Cyanide Market Size, Share, Analysis By Product Form (Hydrogen Cyanide Liquid, Hydrogen Cyanide Gas), By Application (Adiponitrile, Acetone Cyanohydrin, Sodium Cyanide and Potassium Cyanide, Methionine, Cyanuric Chloride, Others), By End-Use Industry (Chemicals, Mining and Metallurgy, Pharmaceuticals, Agriculture, Textiles, Others), By Regional Insights, Business plan and Project Report, Investment Opportunities, Profitability, Industry Trends, Leading Companies and Growth Forecasts by 2026-2035