

Revenue, 2025
$ 25.5Bn
Forecast, 2035
$187.9 Bn
CAGR, 2025-2035
21.9%
Report Coverage
Global
Market Size and Forecast
The Global Sports Technology Market was valued at USD 25.5 billion in 2025 and is projected to reach USD 187.9 billion by 2035, growing at a CAGR of 21.9% from 2025 to 2035. North America held the largest regional share of 38.4% in 2025, supported by strong adoption of performance analytics, wearable devices, smart stadium systems, digital fan engagement platforms, and advanced broadcasting technologies across professional and collegiate sports.
Sports technology includes digital tools, devices, platforms, and systems used to improve athlete performance, team management, fan experience, venue operations, and sports broadcasting. The growth of the market can be attributed to rising demand for real-time performance tracking, injury prevention, data-based coaching, automated officiating, and personalized fan engagement. Teams, leagues, stadium operators, broadcasters, and sports brands are increasingly using technology to improve decision-making and create more connected sports experiences.
The market outlook remains strong as investment continues to increase in wearables, AI-based analytics, smart venues, virtual training, sports streaming, AR and VR fan experiences, and athlete monitoring platforms. North America is expected to maintain its leading position due to its mature sports ecosystem, high technology spending, strong presence of major sports leagues, and early adoption of digital solutions across sports operations. As sports organizations focus on performance, safety, monetization, and fan loyalty, technology is expected to become a core part of the global sports industry.
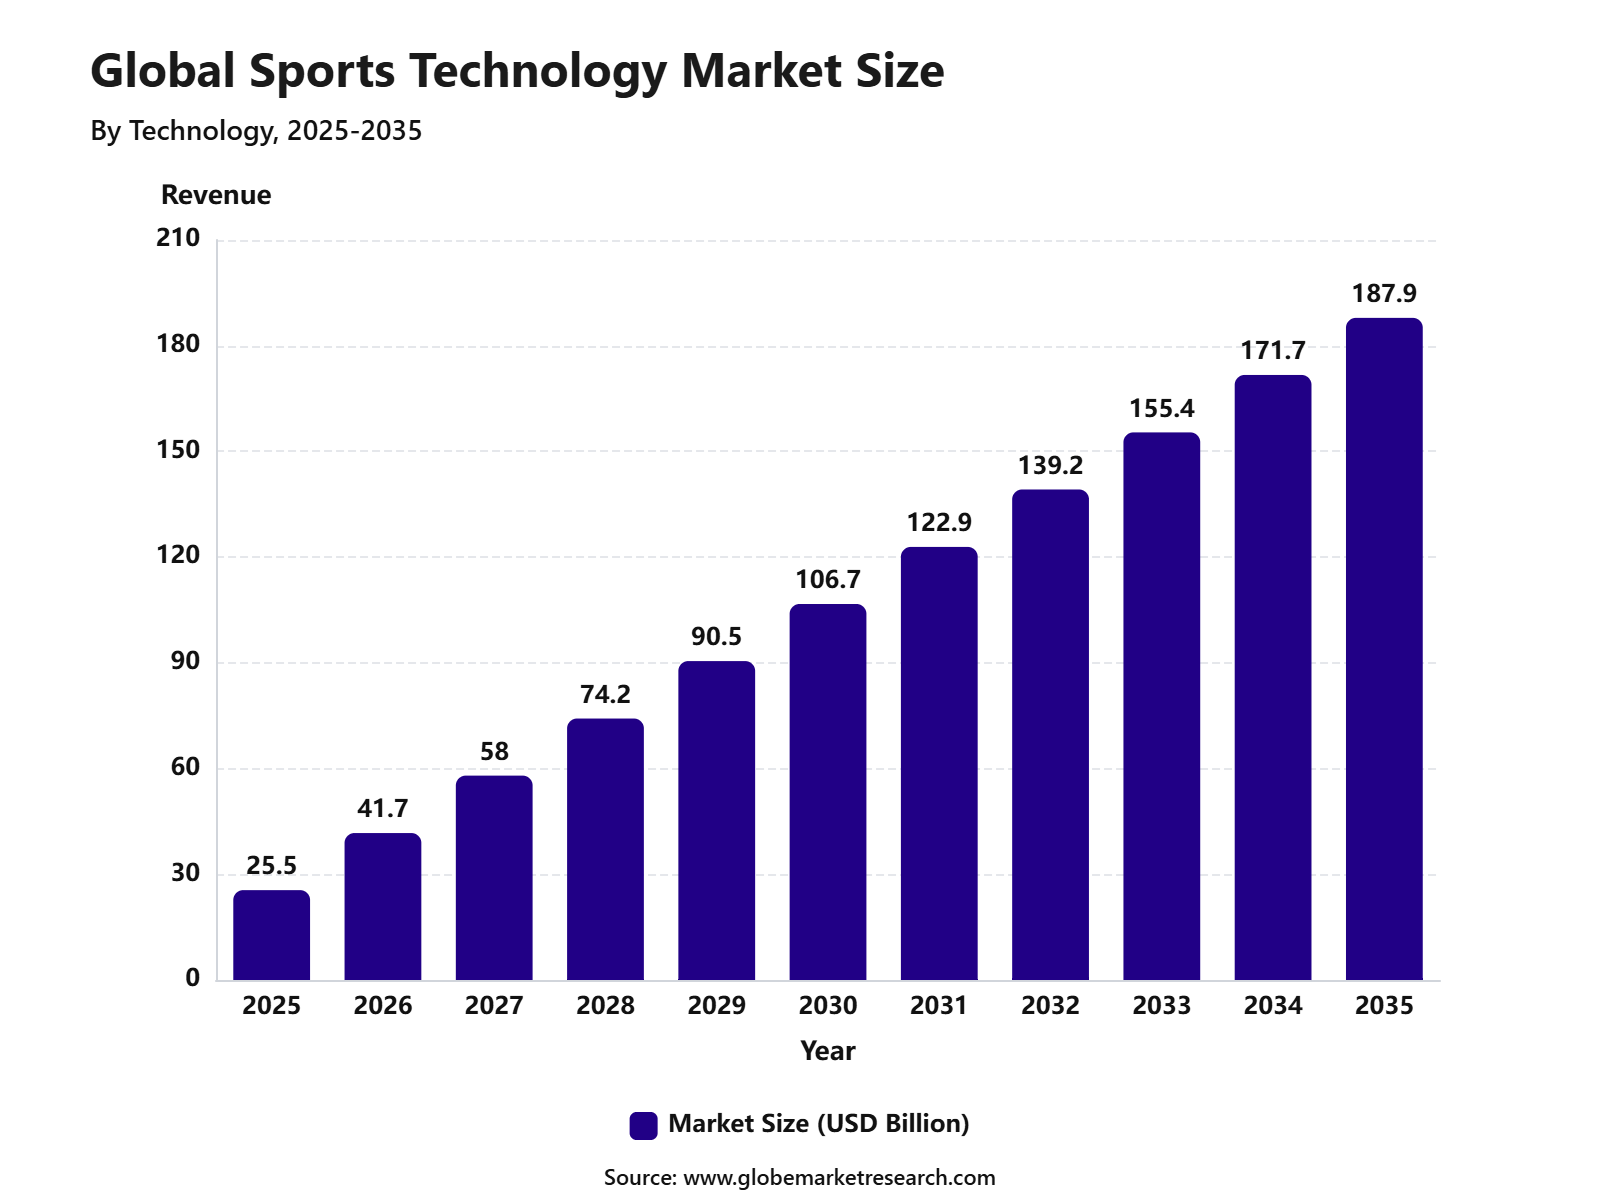 iThe graph shows projected market growth until 2035 based on CAGR analysis. Actual outcomes may vary depending on changing demand, competition, and economic factors.To gain greater insights - request a sample report PDF
Key Market Insights
Smart stadium technology led the market with 44.8% share, supported by rising use of connected seating, digital ticketing, crowd management systems, real-time analytics, and enhanced fan engagement tools.
Soccer accounted for 27.1% share by sport, driven by its large global fan base, strong club investments, high media coverage, and increasing use of performance tracking technologies.
Sports clubs held 39.2% share by end user, supported by growing adoption of athlete performance analytics, fan engagement platforms, training technologies, and venue management solutions.
North America led the sports technology market with 38.4% share, supported by strong investment in smart stadiums, advanced sports analytics, digital broadcasting, and technology-driven fan experiences.
AI’s Role in Sports Technology
AI is contributing to the Sports Technology Industry by improving athlete performance, training quality, and injury prevention. Teams now use AI with wearable sensors, video analytics, GPS tracking, and medical data to monitor fatigue, movement load, speed, acceleration, recovery, and injury risk. In 2026, 82% of sports organizations had adopted AI, and nearly 98% planned to increase AI use over the next 12 months, showing that AI is now becoming part of daily sports operations.
AI is also improving fan engagement, media production, and sponsorship value. Sports broadcasters and teams use AI to create faster highlights, personalized content, automated match stories, multilingual clips, real-time statistics, and sponsor performance reports. Stats Perform’s 2026 survey of 675 sports media executives found that 81% had expanded AI use in the past year, while 70% said sponsors now demand more digital content.
AI is further supporting officiating, stadium operations, and cybersecurity. FIFA’s semi-automated offside technology uses 12 dedicated tracking cameras to monitor the ball and up to 29 player data points, 50 times per second, helping officials make faster and more accurate decisions. At the same time, AI is being used for smart stadium crowd flow, ticketing, security, energy management, and threat detection, as Darktrace reported that 57% of professional sports organizations experienced multiple cyber incidents in the last 12 months.
Go-to-Market and Sales Strategy
The Sports Technology Market needs a performance-led and fan-engagement-led go-to-market strategy. Vendors should position solutions around athlete tracking, video analytics, injury prevention, smart stadium operations, ticketing, broadcast automation, wearable sensors, data platforms, officiating tools, and fan engagement. A 2026 sports technology report found that 82% of sports organizations had adopted AI, while 98% planned to increase AI use over the next 12 months, showing that AI is now moving into daily sports operations rather than staying at the pilot stage.
Sales economics are strongest when technology is sold as a recurring platform, managed service, data product, or long-term integration contract. Teams, leagues, broadcasters, and venues need software, cloud hosting, device management, analytics, cybersecurity, and staff training, not only hardware. FIFA World Cup 2026 shows this model clearly, as Lenovo is deploying more than 17,000 Lenovo and Motorola devices and 200+ engineers across venues and team base camps to support operations and broadcast technology.
Technology Analysis
Smart stadium technology led the Sports Technology Market with 44.8% share, supported by rising investment in connected venues, digital ticketing, crowd management, high-speed connectivity, smart security, real-time data systems, and fan engagement platforms. Stadium operators are using technology to improve both live-event experience and venue efficiency. The growth of this segment can be attributed to the need for better crowd movement, faster entry, safer operations, and stronger revenue generation from digital signage, mobile ordering, loyalty programs, and personalized fan services.
Smart stadium systems also help operators monitor facility performance, manage energy use, improve security response, and support event-day decision-making. Smart stadium adoption is expected to remain strong as sports venues become more data-driven and experience-focused. Demand is likely to increase for AI-based crowd analytics, 5G connectivity, biometric access, digital wayfinding, cashless payments, smart parking, and connected broadcast infrastructure.
Sport Analysis
Soccer accounted for 27.1% share of the Sports Technology Market, supported by its large global fan base, strong club structure, high media visibility, and growing investment in match analytics, fan engagement, performance tracking, and broadcast technologies. The sport has broad participation and viewership across Europe, Latin America, Asia Pacific, Africa, and North America. The segment is being supported by the growing use of video analysis, wearable tracking, smart balls, referee technology, player performance systems, and digital fan platforms.
Clubs and leagues are using technology to improve match preparation, player fitness, injury prevention, tactical analysis, ticketing, and fan communication. Soccer is expected to remain a major sports technology segment as clubs, leagues, and stadium operators continue to modernize. Growth opportunities are likely to remain strong in player tracking, VAR-linked systems, fan apps, digital content platforms, smart stadium upgrades, and data-based sponsorship activation.
End User Analysis
Sports clubs held 39.2% share, making them the leading end-user group in the Sports Technology Market. Clubs are adopting technology to improve player performance, fan engagement, ticketing, training management, injury monitoring, sponsorship value, and stadium operations. The growth of this segment can be attributed to rising competition among clubs to improve sporting results and commercial performance.
Technology helps clubs track athlete workload, analyze match data, manage memberships, personalize fan communication, and create new revenue streams through digital platforms. Sports clubs are expected to remain major buyers of sports technology because they operate at the center of athlete performance and fan relationships. Demand is likely to remain strong for performance analytics, wearable systems, CRM platforms, ticketing software, content tools, smart venue systems, and sponsorship measurement solutions.
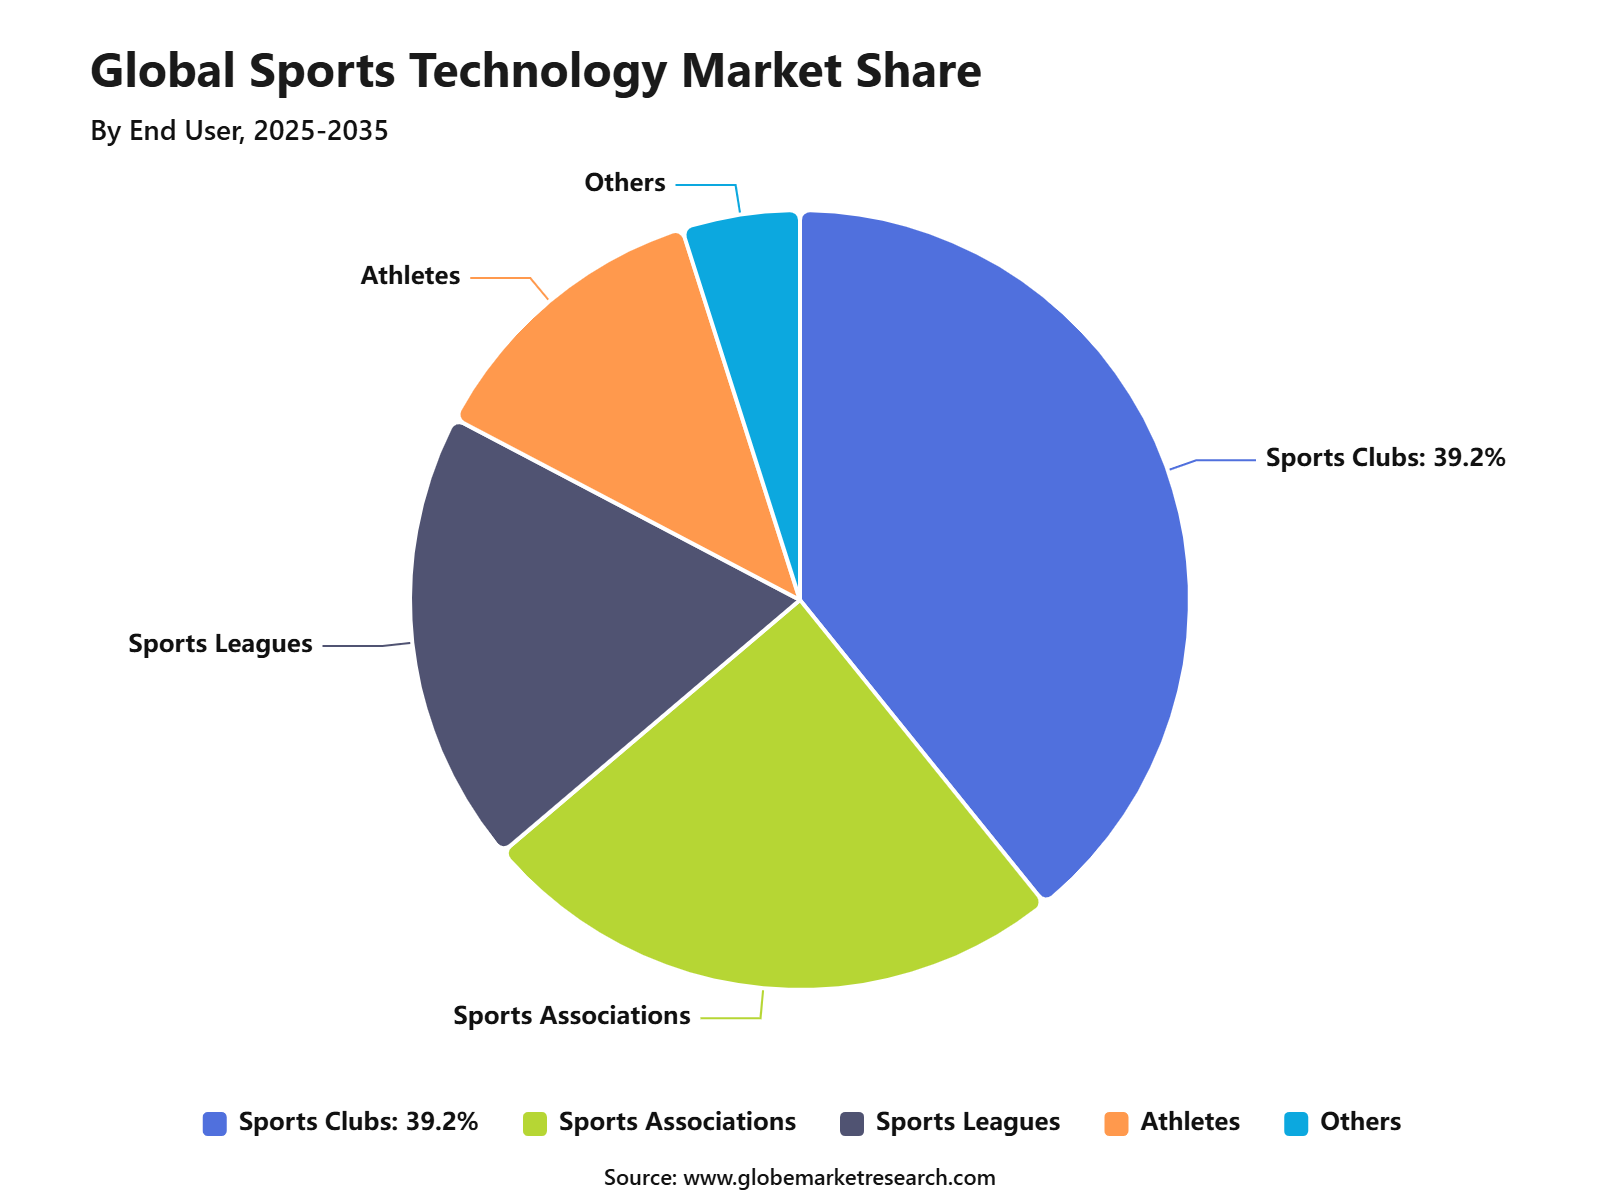 iThe graph shows projected market growth until 2035 based on CAGR analysis. Actual outcomes may vary depending on changing demand, competition, and economic factors.To gain greater insights - request a sample report PDF
Regional Analysis
North America led the Sports Technology Market with 38.4% share, supported by advanced sports infrastructure, high technology spending, strong professional leagues, large sponsorship activity, and strong adoption of digital fan engagement tools. The region has a mature sports ecosystem across football, basketball, baseball, hockey, soccer, motorsports, and collegiate athletics.
The growth of North America is being driven by stadium modernization, connected venue investment, sports analytics, live streaming, fantasy sports, fan apps, and AI-based content tools. The region also benefits from strong demand for technology that improves event-day operations, player performance, audience data, and sponsor returns.
North America is expected to remain a leading region as sports organizations continue to invest in digital platforms and venue upgrades. Future opportunities are likely to be seen in smart stadium systems, biometric entry, AI-powered fan engagement, athlete performance analytics, data-driven sponsorship tools, and connected media experiences.
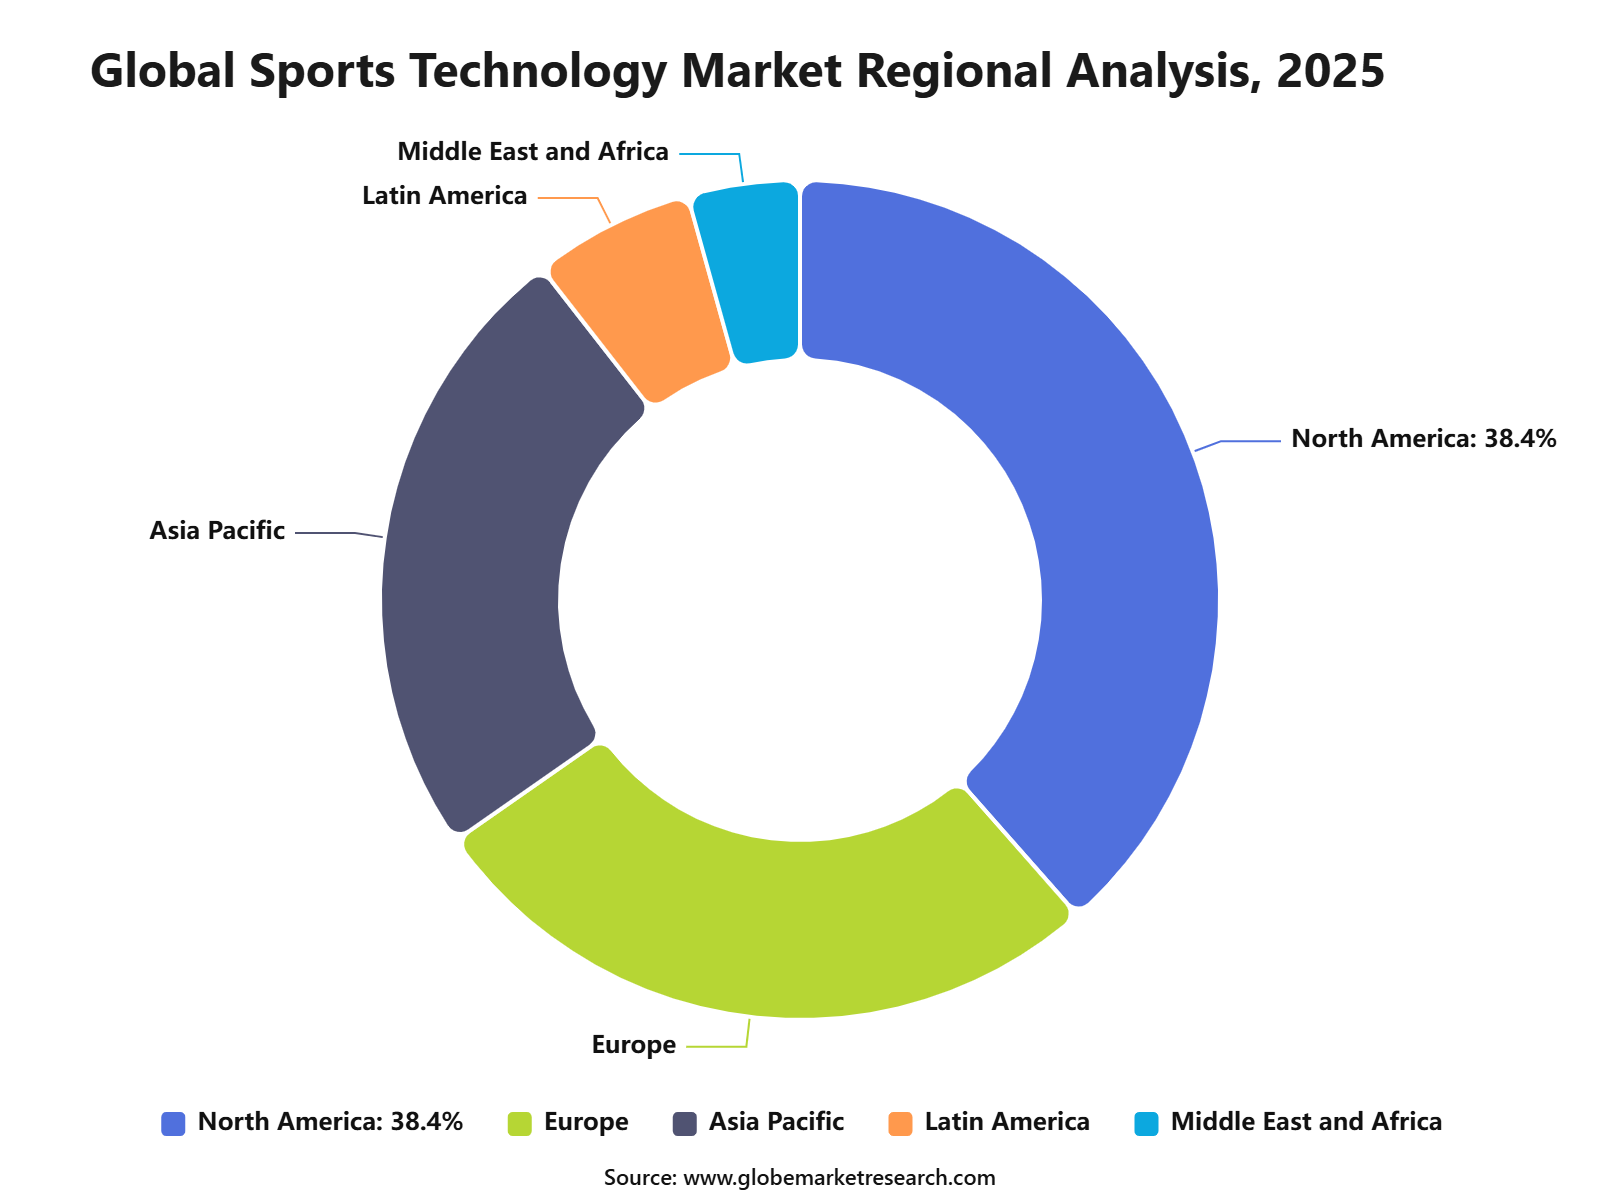 iThe graph shows projected market growth until 2035 based on CAGR analysis. Actual outcomes may vary depending on changing demand, competition, and economic factors.To gain greater insights - request a sample report PDF
Regional Impact Analysis
Impact Factor | Estimated CAGR Impact | Regional Relevance | Market Impact |
|---|---|---|---|
North America market leadership | +6.0% | U.S. and Canada | Leads sports innovation. |
Europe football technology adoption | +4.8% | UK, Germany, France, Spain, Italy | Supports club analytics. |
Asia Pacific rapid sports digitalization | +4.5% | China, India, Japan, South Korea, Australia | Drives future growth. |
Middle East smart venue investment | +3.2% | UAE, Saudi Arabia, Qatar | Supports premium stadiums. |
Latin America football-led adoption | +2.4% | Brazil, Mexico, Argentina, Chile | Builds gradual demand. |
Revenue Potential Analysis
Revenue Landscape Across
The revenue landscape is spread across athlete analytics, smart stadium systems, fan engagement apps, ticketing platforms, sports data feeds, video analysis, AI coaching tools, referee technology, connected equipment, broadcast automation, sponsorship analytics, cybersecurity, and betting data infrastructure. Revenue is also shifting toward digital content because sponsors and fans expect more real-time, personalized, and interactive sports experiences. A 2026 survey of 675 sports media executives found that 81% had expanded AI use in the past year, while 70% said sponsors now demand more digital content.
Major events create strong revenue opportunities for sports technology vendors because they need reliable systems at global scale. FIFA and Lenovo have also introduced AI-powered Referee View improvements, including real-time AI stabilization for referee camera footage, which shows how sports technology is being used for both officiating support and broadcast experience. These types of projects create opportunities for device makers, cloud providers, AI software companies, camera suppliers, connectivity firms, and systems integrators.
Financial Impact
The financial impact can be positive for companies that provide recurring software, data licensing, managed services, AI analytics, cybersecurity, and venue technology support. Public company results show that sports data and technology revenues are already material. Genius Sports reported USD 669.5 million in full-year 2025 group revenue, while its Sports Technology and Services revenue reached USD 14.9 million, driven mainly by products built on GeniusIQ technology.
Financial risk remains linked to long sales cycles, hardware costs, tariff exposure, data rights, cybersecurity, and approval from leagues or governing bodies. Buyers may test sports technology through pilots before moving to full deployment, which can delay revenue conversion for vendors. The strongest financial resilience is expected from companies that combine hardware, software, data, support services, compliance readiness, and measurable outcomes linked to athlete performance, fan revenue, venue efficiency, sponsorship value, or broadcast quality.
Risk Factors & Market Barriers
The main risk factor is integration complexity. Sports organizations often use separate systems for athlete performance, medical data, ticketing, fan apps, payments, venue security, sponsorship reporting, broadcast feeds, and betting data. If these systems do not connect properly, AI and analytics tools may produce limited value. This is why vendors need strong APIs, clean data architecture, cybersecurity controls, and implementation support rather than only dashboards.
Cybersecurity is another major barrier because sports properties are high-visibility targets. A 2026 Darktrace-based report found that 84% of sports organizations experienced at least one cyber incident in the past year, more than half were targeted multiple times, and each incident cost about USD 170,000 on average. This creates demand for cybersecurity, identity protection, secure fan data systems, threat monitoring, and incident response planning.
Regulatory & Compliance Risks
Regulatory risk is high because sports technology often collects biometric, health, location, identity, payment, and performance data. Wearables, smart cameras, AI scouting tools, facial recognition, fan apps, and athlete monitoring platforms must manage consent, privacy, data retention, cybersecurity, and ownership rights. A 2025 review on athlete data rights noted that existing privacy law and sports governance frameworks do not fully define ownership and control over digital traces created during training or competition.
AI compliance is becoming more important for sports technology companies operating in Europe. Reuters reported that the EU AI Act becomes fully effective on August 2, 2026, with rules covering areas such as abusive AI practices, biometric systems, transparency, and high-risk applications. Sports technology providers using AI for scouting, fan personalization, ticketing risk control, facial recognition, content generation, or performance prediction will need stronger documentation, human oversight, data governance, and risk controls.
Market Adoption Barriers
Market adoption barriers are mainly linked to budget pressure, unclear return on investment, staff readiness, and trust in data accuracy. Coaches, players, analysts, venue operators, and medical teams may resist technology if it creates extra work, produces unclear insights, or does not match real match conditions. Officiating technology also faces public scrutiny because fans expect faster and fairer decisions, but system errors can quickly create controversy.
FIFA World Cup 2026 shows how adoption can improve when technology is connected to clear match outcomes. FIFA confirmed that goal-line technology, an advanced version of semi-automated offside technology, and connected ball technology will be used at the tournament. FIFA’s semi-automated offside system uses 16 dedicated cameras to track players and the ball, typically 50 times per second, helping match officials make faster and more accurate decisions.
Segment Covered in the Report
By Technology
Smart Stadium
Devices
Analytics and Statistics
Esports
By Sport
Soccer
Baseball
Basketball
Ice Hockey
American Football/Rugby
Tennis
Cricket
Golf
Esports
Others
By End User
Sports Clubs
Sports Associations
Sports Leagues
Athletes
Others
By Region
North America
Europe
Asia Pacific
Latin America
Middle East and Africa
Drivers Impact Analysis
Impact Factor | Estimated CAGR Impact | Regional Relevance | Market Impact |
|---|---|---|---|
Rising use of smart stadium technologies | +5.8% | North America, Europe, Asia Pacific | Improves fan experience. |
Growth in athlete performance analytics | +5.1% | U.S., UK, Germany, Japan, Australia | Supports data-based training. |
Increasing sports digitalization | +4.7% | Global | Drives technology adoption. |
Expansion of connected wearables | +4.2% | North America, Europe, Asia Pacific | Tracks player performance. |
Rising demand for fan engagement platforms | +3.8% | Global sports leagues | Improves audience interaction. |
Restraints Impact Analysis
Impact Factor | Estimated CAGR Impact | Regional Relevance | Market Impact |
|---|---|---|---|
High technology deployment cost | -2.8% | Emerging markets, smaller clubs | Limits fast adoption. |
Data privacy and athlete monitoring concerns | -2.4% | North America, Europe, developed Asia | Raises compliance pressure. |
Integration with legacy stadium systems | -2.0% | Older sports venues | Delays modernization. |
Limited budgets among small clubs | -1.7% | Regional teams and local leagues | Slows technology upgrades. |
Lack of skilled analytics professionals | -1.5% | Global | Affects platform usage. |
Opportunities Impact Analysis
Impact Factor | Estimated CAGR Impact | Regional Relevance | Market Impact |
|---|---|---|---|
Expansion of smart stadium infrastructure | +5.5% | North America, Europe, GCC, Asia Pacific | Creates large-scale demand. |
Growth in sports analytics platforms | +4.9% | U.S., Europe, Asia Pacific | Improves team decisions. |
Rising adoption of AI in sports | +4.4% | Developed sports markets | Enhances performance insights. |
Wearable technology for athletes | +4.0% | Global professional sports | Supports real-time tracking. |
Digital ticketing and venue management | +3.5% | Global stadium operators | Improves event operations. |
Challenges Impact Analysis
Impact Factor | Estimated CAGR Impact | Regional Relevance | Market Impact |
|---|---|---|---|
Managing large sports data volumes | -2.3% | Global clubs and leagues | Increases data complexity. |
Cybersecurity risks in connected venues | -2.0% | Smart stadium markets | Raises security burden. |
Ensuring accuracy of performance data | -1.8% | Professional sports teams | Affects decision quality. |
Resistance to technology-led coaching | -1.5% | Traditional sports organizations | Slows adoption speed. |
Interoperability between platforms | -1.4% | Clubs, venues, broadcasters | Limits system efficiency. |
Recent Developments
January 2026, WSC Sports acquired Partnerbrite to add campaign execution and sponsorship activation tools to its AI-powered sports content platform. The acquisition helps sports rights holders connect real-time content, fan engagement, and sponsor activation more directly. This development shows that sports technology is moving beyond highlights and video automation into measurable sponsorship revenue tools.
March 2026, WHOOP raised USD 575 million in Series G funding at a USD 10.1 billion valuation. The funding supports global expansion and personalized health technology, while strengthening the role of wearables in athlete performance, recovery tracking, sleep monitoring, and preventive health. The company’s funding round also shows strong investor confidence in subscription-based performance data platforms.
March 2026, Capstone Partners reported that the sports technology market continued to sustain M&A momentum in 2026. The report highlighted strong interest in technologies linked to professional and amateur athletics, youth sports, esports, and product platforms that improve performance, content, operations, and engagement. This indicates that sports tech buyers are targeting assets that can add data, automation, and recurring software revenue.
Report Scope
Report Highlights | Details |
|---|---|
Market Revenue (2025) | USD 25.5 Billion |
Forecast Revenue (2035) | USD 187.9 Billion |
CAGR (2025-2035) | 21.9% |
Base Year for Estimation | 2025 |
Historic Data | 2020-2024 |
Forecast Period | 2025-2035 |
Report Coverage | AI market impact analysis, market surveys, trade analysis, Industry & competitive intelligence, Revenue projections, company positioning, competitive analysis, growth drivers, and emerging market trends, Strategic Consultation & Advisory Services |
Segments Covered | By Technology (Smart Stadium, Devices, Analytics and Statistics, Esports), By Sport (Soccer, Baseball, Basketball, Ice Hockey, American Football/Rugby, Tennis, Cricket, Golf, Esports, Others), By End User (Sports Clubs, Sports Associations, Sports Leagues, Athletes, Others), By Regional Insights |
Regional Analysis | North America - US, Canada; Europe - Germany, France, The UK, Spain, Italy, Russia, Netherlands, Rest of Europe; Asia Pacific - China, Japan, South Korea, India, New Zealand, Singapore, Thailand, Vietnam, Rest of Latin America; Latin America - Brazil, Mexico, Rest of Latin America; Middle East & Africa - South Africa, Saudi Arabia, UAE, Rest of MEA |
Key companies profiled | Catapult Sports, STATSports, Fitbit, Samsung, Xiaomi, IBM Corporation, Oracle Corporation, Cisco Systems, SAP SE, Sony Corporation, Panasonic Corporation, Garmin Ltd., Apple Inc., WHOOP, and Zebra Technologies. |
Customization Scope | Tailored insights for specific regions, countries, and market segments can be provided. Additional report customization is available upon request. |
Competitive Landscape
The market is characterized by intense competition among established players and emerging companies. Strategic partnerships, mergers and acquisitions, and product innovation are key strategies employed by market participants.
Key Market Players
Catapult Sports
STATSports
Fitbit
Samsung
Xiaomi
IBM Corporation
Oracle Corporation
Cisco Systems
SAP SE
Sony Corporation
Panasonic Corporation
Garmin Ltd
Apple Inc.
WHOOP
Other Key Players
Research Methodology
This market study is prepared using a combination of primary and secondary research. Primary research includes discussions with manufacturers, suppliers, distributors, consultants, industry experts, and end users. Secondary research covers company reports, government databases, trade associations, technical publications, regulatory sources, and trusted industry documents. The collected information is used to assess market demand, pricing trends, technology adoption, competitive activity, and regional performance.
AI language models are not used as primary data sources, and publicly available AI-generated content is not treated as market evidence. Computational tools may be used to support data processing, translation, data classification, and pattern identification. However, every published assessment is supported by verified sources, human review, and primary market discussions.
Market estimates are developed through top-down and bottom-up approaches and validated using data triangulation. Revenue, production, shipment, pricing, and application-level data are compared across multiple sources. Forecasts consider economic conditions, regulatory changes, investment activity, innovation, supply chain developments, and industry risks. All findings are reviewed through source verification and internal quality checks before publication.
Part I
Source Management & Input Data Standards
Who provides data, how sources are qualified, and what types of evidence are admissible.
Part II
Research Scope & Market Coverage
How we define the markets we assess and the parameters that govern each product.
Part III
Data Collection, Verification & Submission
The mechanics of gathering, cross-checking, and hierarchically ranking evidence.
Part IV
Assessment Determination & Quality Controls
How raw data becomes a published assessment — normalisation, expert judgement, and outlier exclusion.
Part V
Publication, Corrections & Revision
Our publication schedule, corrections policy, and methodology review cycle.
Part VI
Independence, Ethics & Complaints
Conflict-of-interest policies, editorial independence, and how clients raise concerns.
Google · Preferred Sources
Don't miss the latest market research insights and industry updates on Google.
Add Globe Market Research as a preferred source in the Google app to see our reports, analysis, and market stories in your news suggestions.
Meet the Team
This report was prepared by our expert analysts with deep industry knowledge and research experience.
Pratiksha K. is a Senior Research Analyst with more than five years of experience in market research, industry analysis, competitive intelligence, and business strategy. She has contributed to detailed market reports, customized research studies, company profiling, market sizing, trend analysis, and strategic consulting projects for clients across different regions. Her industry expertise covers Chemical and Material, Consumer Goods, Food & Beverages and Energy & Power. She closely evaluates changing customer requirements, technology developments, regulatory conditions, supply chain structures, investment activity, and competitive strategies to provide clear and practical market insights.
Sayali brings more than 7 years of experience to Globe Market Research, supporting the accuracy, clarity, and relevance of research content across multiple industries. She reviews market data, segment analysis, competitive insights, and industry trends to ensure each report meets strong quality standards and provides practical value to business decision-makers. Her expertise spans healthcare, information technology, consumer goods, and diverse cross-industry domains. With a strong focus on data reliability, structured analysis, and clear presentation, Sayali helps ensure that each research output delivers well-reviewed insights for clients, investors, consultants, and industry stakeholders.
Frequently Asked Questions
Related Reports
More in Information and Technology
Edtech SaaS Tools Market Size to hit USD 217.6 billion by 2035
EdTech SaaS Tools Market Size, Share, Trends and Growth Analysis Report By Software (Classroom Management Systems, Document Management Systems, Learning and Gamification Platforms, Learning Management Systems, Student Collaboration Systems, Assessment and Analytics Tools, Content Authoring Tools, Other Software), By Sector (Preschool, K-12, Higher Education, Other Education Sectors), By Deployment (Cloud-Based, Hybrid), By End Use (Businesses, Educational Institutions, Individual Learners and Consumers), By Regional Insights, Technology Trends, Competitive Landscape, Strategic Opportunities and Growth Forecast, 2026–2035
Marketing Technology Market Size to Reach USD 3,810.8 billion by 2035
Marketing Technology Market Size, Share, Trends and Growth Analysis Report By Marketing Type (Digital Marketing, Offline Marketing), By Product (Social Media Tools, Content Marketing Tools, Rich Media Tools, Marketing Automation Tools, Data and Analytics Tools, Sales Enablement Tools), By Deployment (Cloud-Based, On-Premises, Other Deployment Models), By Enterprise Type (Large Enterprises, Small and Medium-Sized Enterprises), By Application (IT and Telecommunication, Retail and E-commerce, Healthcare, Media and Entertainment, Sports and Events, BFSI, Real Estate, Other Applications), By Regional Insights, Technology Trends, Competitive Landscape, Strategic Opportunities and Growth Forecast, 2026-2035
AI Watermarking Market Size to hit USD 10.9 billion by 2035
AI Watermarking Market Size, Share, Trends and Growth Analysis Report By Type (Invisible Watermarking, Visible Watermarking), By Technology (Non-Reversible Watermarking, Reversible Watermarking), By Deployment (Cloud, On-Premises), By Application (Copyright Protection, Authentication and Security, Branding and Marketing, Other Applications), By Content Type (Video, Image, Model Watermarking, Audio, Text), By End Use (Media and Entertainment, BFSI, Healthcare, Government and Defense, Retail and E-commerce, Other End-Use Industries), By Regional Insights, Technology Trends, Regulatory Landscape, Competitive Analysis, Strategic Opportunities and Growth Forecast, 2026-2035
Environmental, Social and Governance (ESG) Consulting Market to hit USD 49.4 billion by 2035
Environmental, Social and Governance (ESG) Consulting Market Size, Share, Trends and Growth Analysis Report By Service Type (Testing, Auditing and Verification, Technical Support, Sustainability Marketing, Strategy and Planning, Other Services), By Enterprise Size (Small and Medium-Sized Enterprises, Large Enterprises), By End User (Corporates, Investors, Government Bodies, Non-Profit Organizations, Other End Users), By Industry Vertical (BFSI, Energy and Utilities, Manufacturing, Healthcare, Retail and Consumer Goods, IT and Telecom, Transportation and Logistics, Other Industries), By Regional Insights, Regulatory Trends, Competitive Landscape, Strategic Opportunities and Growth Forecast, 2026-2035