

Revenue, 2025
$ 79.2 Bn
Forecast, 2035
$ 147.3 Bn
CAGR, 2025-2035
6.4%
Report Coverage
Global
Market Size and Forecast
The Global Energy Drinks Market was worth USD 79.2 billion in 2025 and is expected to reach USD 147.3 billion by 2035, growing at a CAGR of 6.4% from 2025 to 2035. Based on this growth rate, the market is estimated to reach around USD 86.0 billion in 2026. Asia Pacific held the largest regional share of 53.2% in 2025, supported by rising youth consumption, expanding retail availability, strong fitness culture, and growing demand for functional beverages.
Key Parameter | Report Details |
|---|---|
Market Revenue, 2025 | USD 79.2 Billion |
Projected Revenue, 2035 | USD 147.3 Billion |
CAGR (2025-2035) | 6.4% |
Largest Region | Asia Pacific |
Market Concentration/Structure | High/Consolidated |
Base Year | 2025 |
Forecast Period | 2025-2035 |
What is the Energy Drinks Market?
The Energy Drinks Market includes ready-to-drink beverages formulated with caffeine, taurine, vitamins, amino acids, electrolytes, herbal extracts, sweeteners, and flavoring ingredients. These drinks are widely consumed for energy support, alertness, sports performance, endurance, and daily refreshment. The market is closely linked with convenience stores, supermarkets, gyms, sports events, online retail, and lifestyle-focused beverage branding.
The market outlook remains positive as consumers continue to seek convenient drinks that support energy, focus, and active lifestyles. Growth can be attributed to rising demand for sugar-free variants, natural energy drinks, performance beverages, and functional hydration products. The expansion of new flavors, clean-label formulations, and targeted products for athletes, students, and working professionals is expected to support long-term market demand.
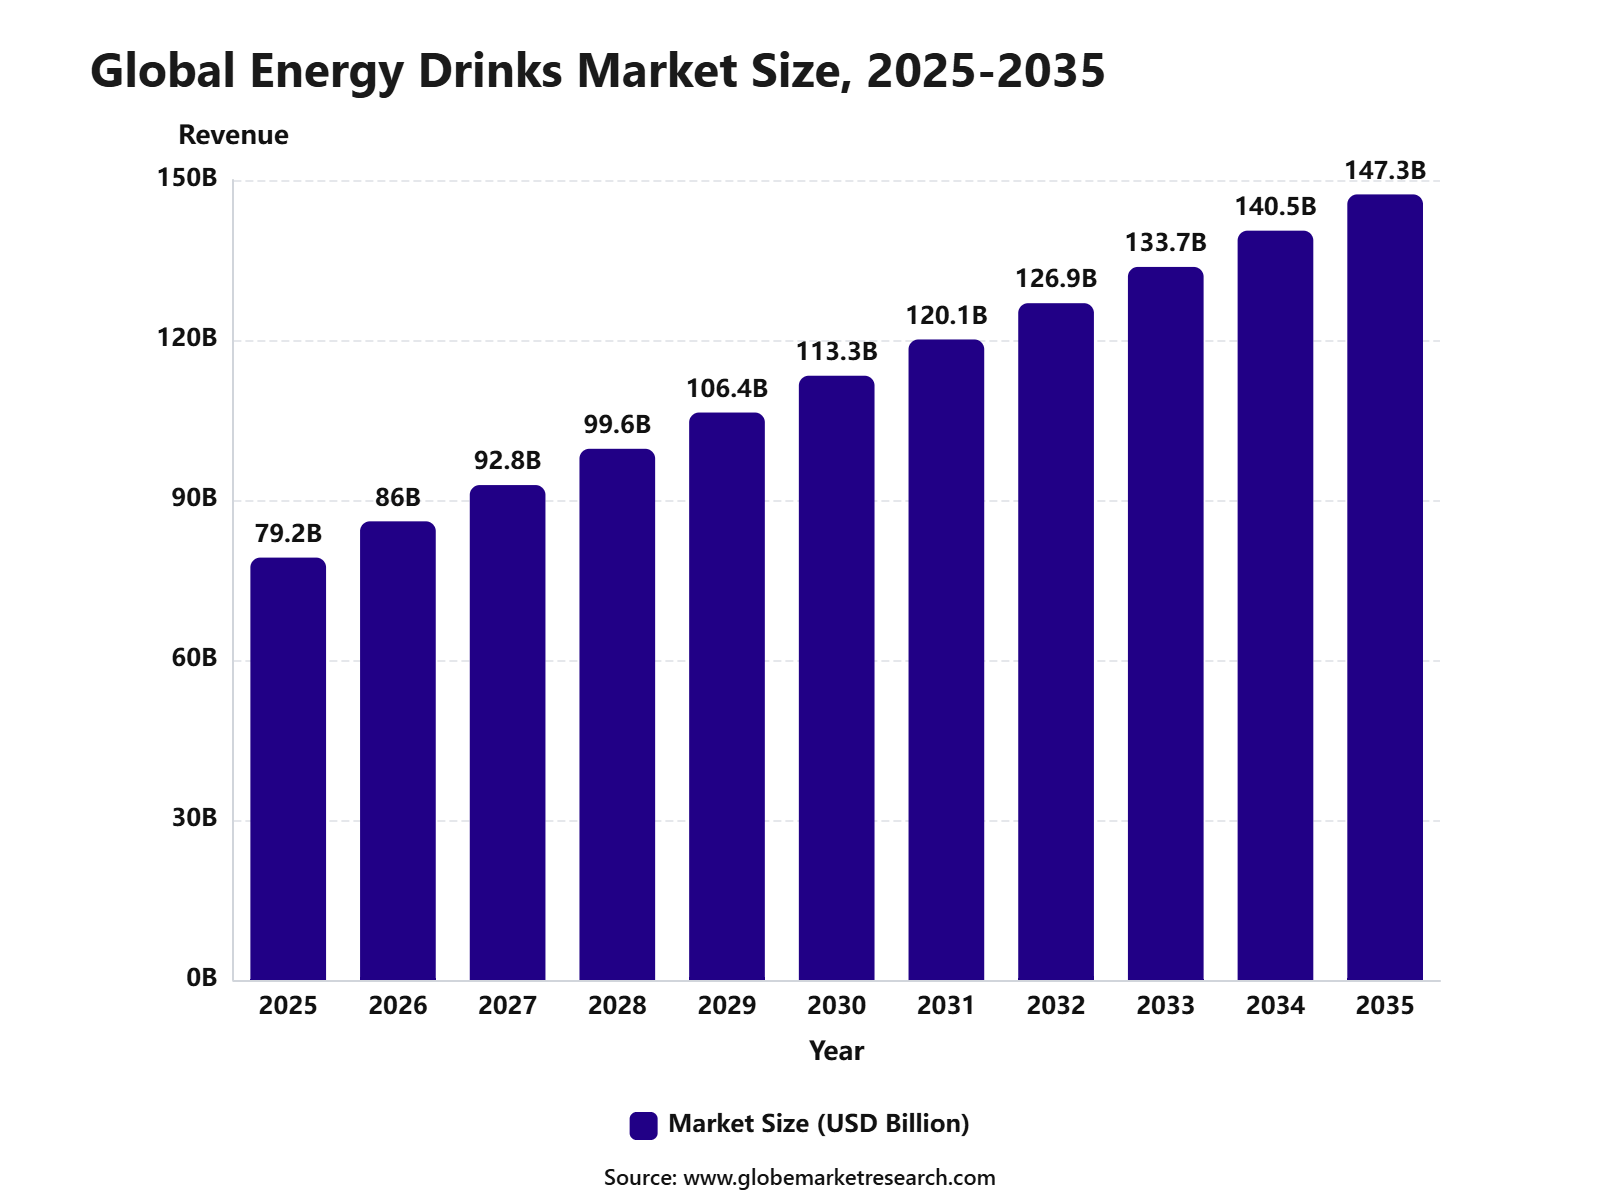 iThe graph shows projected market growth until 2035 based on CAGR analysis. Actual outcomes may vary depending on changing demand, competition, and economic factors.To gain greater insights - request a sample report PDF
Key Market Insights
Traditional energy drinks led the type segment with 44.8% share, supported by strong consumer demand for quick energy, familiar formulations, and wide availability across retail and convenience channels.
Metal cans accounted for 55.3% share by packaging type, driven by portability, longer shelf life, easy chilling, and strong suitability for single-serve energy drink consumption.
Endurance and energy boost held 56.2% share by functionality, supported by rising demand from students, athletes, working professionals, and consumers seeking alertness and stamina support.
Retail channels captured 78.4% share, driven by supermarkets, convenience stores, grocery outlets, fuel stations, and strong impulse purchases.
Asia Pacific led the energy drinks market with 53.2% share, supported by a large young population, rising urban lifestyles, expanding retail networks, and growing demand for functional ready-to-drink beverages.
By Type
Traditional energy drinks accounted for 44.8% share of the Energy Drinks Market. This leadership can be attributed to strong consumer familiarity, wide retail availability, and established demand for caffeine-based beverages that support alertness, stamina, and quick energy.
The segment remains popular among students, working professionals, athletes, drivers, and young consumers who seek fast energy support during busy schedules. Strong branding, flavor variety, and frequent promotional campaigns continue to support repeat purchases.
Traditional energy drinks are expected to remain a major product category as companies introduce new flavors, sugar-free extensions, and larger pack formats. Their strong visibility across convenience stores, supermarkets, gyms, vending machines, and online platforms will continue to support demand.
By Packaging Type
Metal cans held 55.3% share of the Energy Drinks Market. Their dominance is supported by strong durability, quick cooling, lightweight handling, and suitability for single-serve consumption. Energy drink brands prefer metal cans because they protect product freshness, support attractive branding, and are convenient for on-the-go use.
Cans are also easy to stack, transport, and display across retail shelves and chilled beverage sections. The segment is expected to maintain its leading position as consumers continue to prefer ready-to-drink formats. Rising demand from convenience retail, sports events, travel, and fitness-focused consumption will further support the use of metal cans in energy drinks.
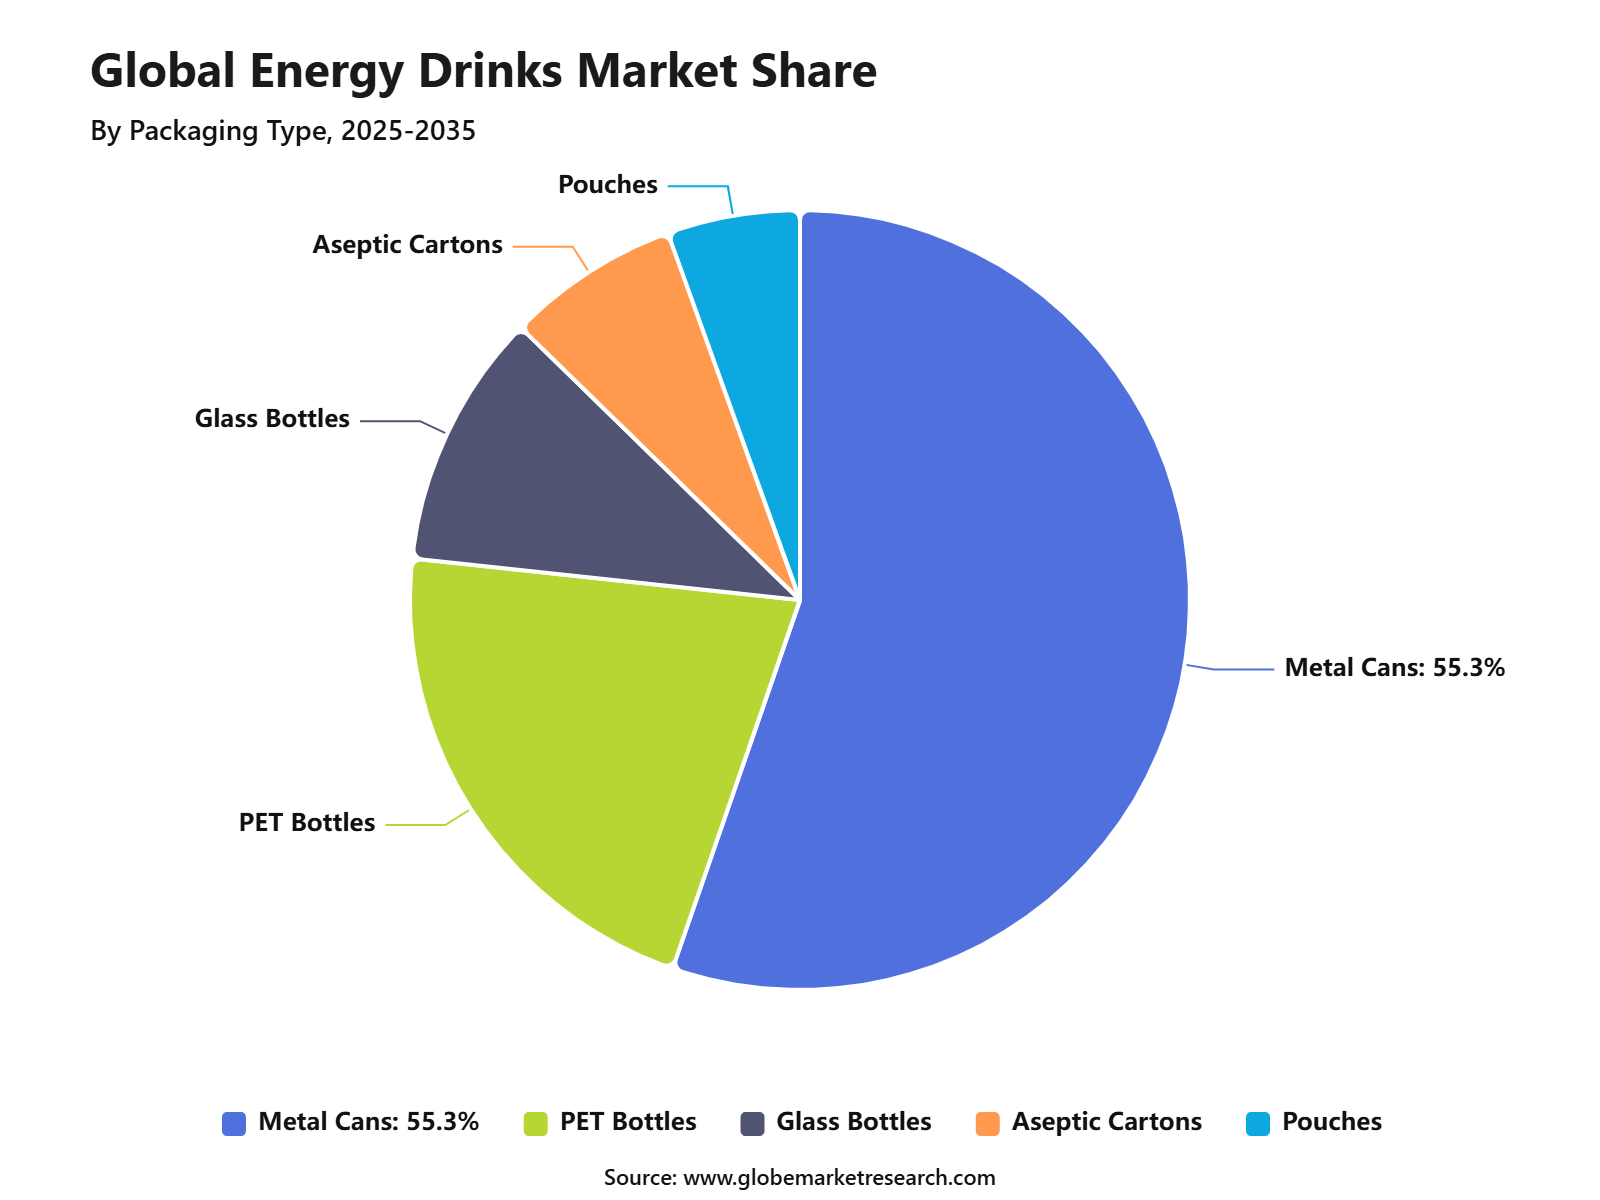 iThe graph shows projected market growth until 2035 based on CAGR analysis. Actual outcomes may vary depending on changing demand, competition, and economic factors.To gain greater insights - request a sample report PDF
By Functionality
Endurance and energy boost functionality accounted for 56.2% share of the Energy Drinks Market. This leading share is driven by high demand for beverages that provide quick stimulation, reduced fatigue, and improved physical or mental performance. These drinks are commonly consumed before workouts, during long working hours, while studying, gaming, driving, or participating in sports activities.
Ingredients such as caffeine, taurine, B vitamins, electrolytes, and amino acids are widely used to support energy-related positioning. The segment is expected to remain strong as active lifestyles, fitness participation, and performance-focused beverage demand continue to rise. Brands are also expanding with low-calorie, natural caffeine, and functional ingredient blends to attract health-conscious consumers.
By Distribution Channel
Retail channels captured 78.4% share of the Energy Drinks Market. This dominance is supported by the strong presence of supermarkets, hypermarkets, convenience stores, grocery stores, fuel stations, vending machines, and online retail platforms. Energy drinks are high-frequency, impulse-driven products, making retail visibility very important.
Chilled displays, point-of-sale promotions, multi-pack offers, and strong shelf placement help brands increase consumer reach and repeat purchases. The segment is expected to maintain its leadership as modern retail and quick-commerce platforms continue to expand. Convenience stores and fuel stations will remain especially important because energy drinks are often purchased during travel, work breaks, workouts, and late-night activities.
By Region
Asia Pacific accounted for 53.2% share of the Energy Drinks Market, making it the leading regional market. Growth is supported by a large young population, rising disposable income, urban lifestyles, and increasing demand for convenient functional beverages. China, India, Japan, South Korea, Thailand, Indonesia, Vietnam, and Australia are important demand centers in the region.
Consumption is supported by sports participation, gaming culture, long working hours, expanding retail networks, and rising acceptance of ready-to-drink beverages. Asia Pacific is expected to maintain its leading position as energy drink brands increase local flavors, affordable pack sizes, and wider distribution. Strong growth in convenience retail, e-commerce grocery, fitness culture, and youth-focused marketing will continue to support regional demand.
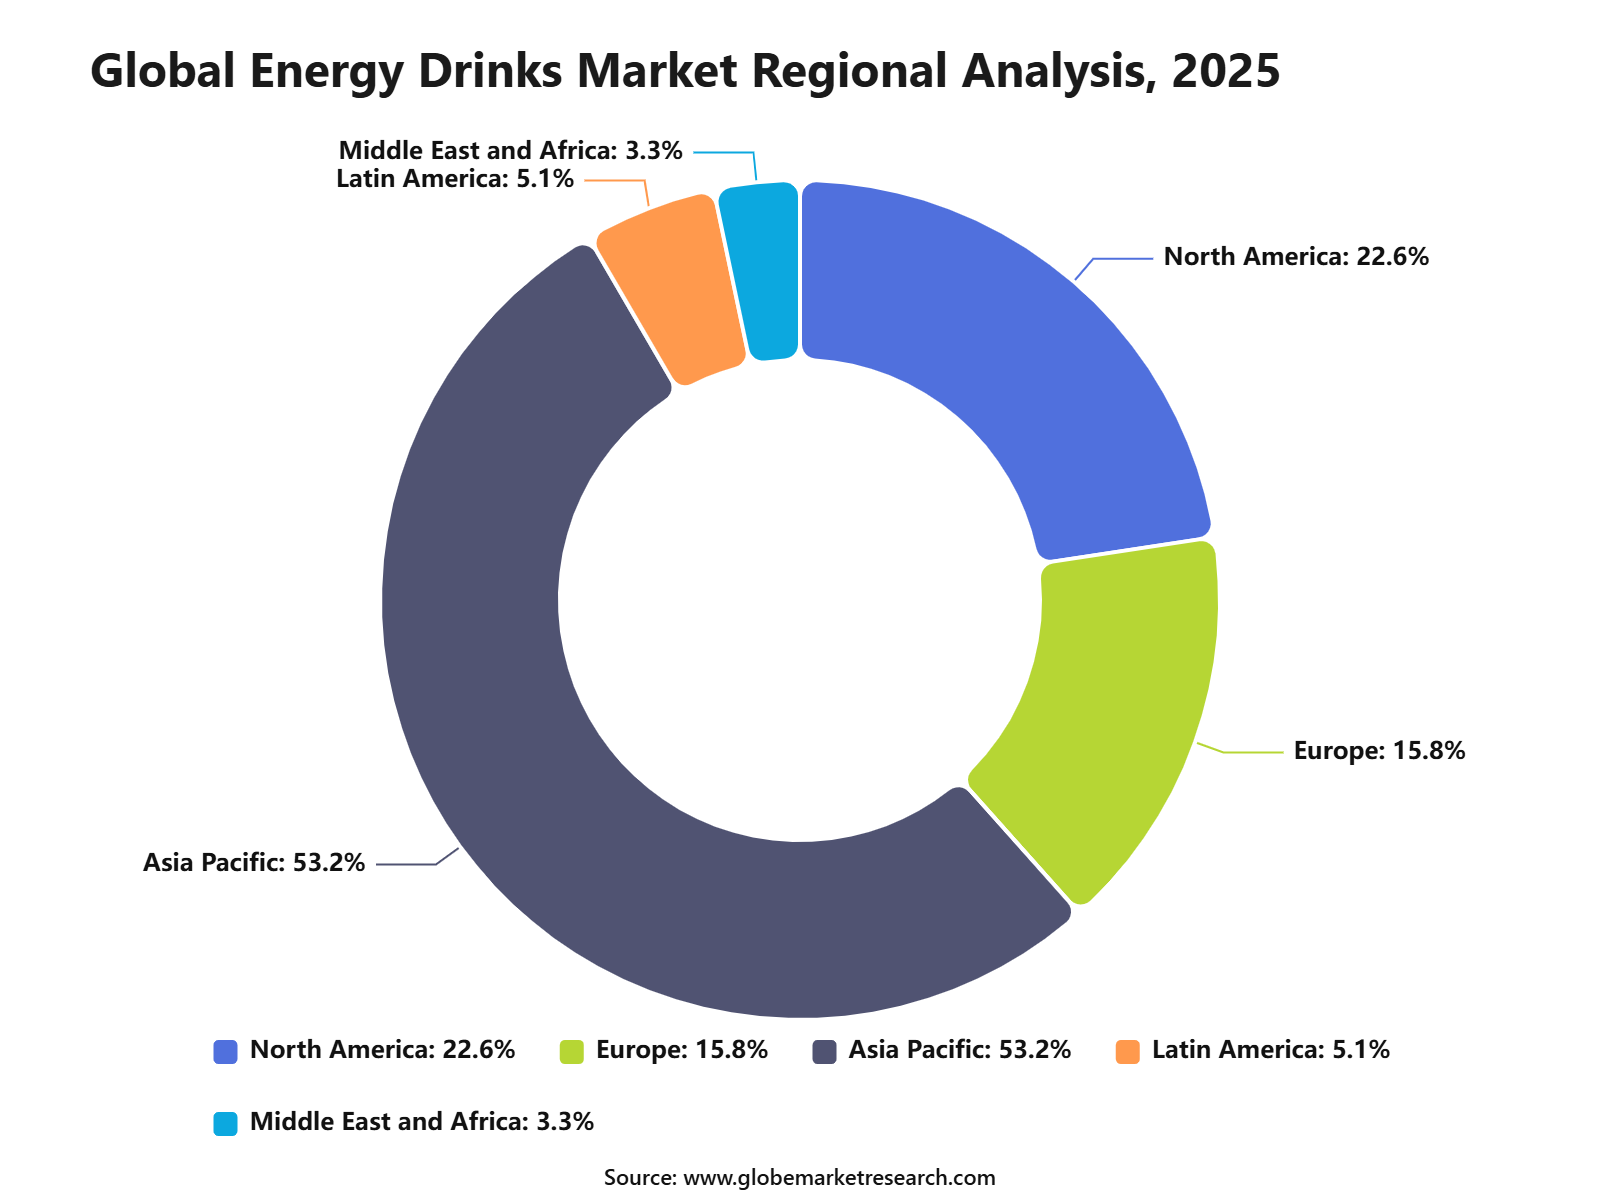 iThe graph shows projected market growth until 2035 based on CAGR analysis. Actual outcomes may vary depending on changing demand, competition, and economic factors.To gain greater insights - request a sample report PDF
Go-To-Market and Sales Economics
Energy drinks are sold through high-frequency channels where impulse purchase, cold availability, and brand visibility matter most. In the U.S., convenience retail remains a strong route because in-store convenience sales reached USD 341.2 billion in 2025, while the 2026 store count stood at 151,975 outlets. This supports cooler-door placement, single-can trials, and repeat consumption.
Sales economics are being supported by premium pricing, functional positioning, and strong packaged beverage demand. Energy drinks generated USD 24.8 billion in U.S. sales for the year ended March 7, 2026, making the category the second-largest nonalcoholic packaged beverage segment after regular carbonated beverages. This makes shelf space, retailer margins, and multipack promotions important growth levers.
Large brands are using scale, sponsorship, and distribution partnerships to protect velocity. Red Bull sold 13.969 billion cans worldwide in 2025 and increased turnover by 8.6% to EUR 12.196 billion. Monster’s Energy Drinks segment rose 27.6% to USD 2.19 billion in Q1 2026, showing strong sales conversion across global retail channels.
Risk Factors & Market Barriers
Health and caffeine safety remain the main barriers for wider adoption, mainly among younger consumers. The FDA states that 400 mg of caffeine per day is generally not linked with negative effects for most adults, but sensitivity varies by person. The CDC also notes that stimulants in energy drinks have no place in children’s and adolescents’ diets.
Regulatory pressure can affect product labeling, school access, advertising claims, and youth-focused marketing. Pediatric guidance is especially strict because caffeine and other stimulant substances are not considered appropriate for children and adolescents. This can limit sales in family, school, and youth sports environments, while forcing companies to improve caffeine disclosure and responsible-consumption messaging.
Cost pressure is another barrier, as cans, sweeteners, logistics, and retailer promotions can affect margins. Monster reported company net sales growth of 26.9% to USD 2.35 billion in Q1 2026, but the business remains exposed to aluminum, freight, currency, and promotional costs. Strong volume growth must therefore be balanced with pricing discipline.
Drivers Impact Analysis
The Energy Drinks Market is driven by rising demand for instant energy, mental alertness, sports performance, busy lifestyles, gaming culture, and convenient ready-to-drink beverages. Caffeine, taurine, vitamins, amino acids, electrolytes, and natural extracts are widely used to support product positioning.
Asia Pacific leads the market due to its young population, urbanization, expanding retail access, fitness trends, and rising demand for functional beverages. China, India, Japan, South Korea, Thailand, Indonesia, and Australia remain important markets for both global and regional energy drink brands.
Impact Factor | Estimated CAGR Impact | Regional Relevance | Market Impact |
|---|---|---|---|
Rising demand for functional beverages | +1.7% | Asia Pacific, North America, Europe | Drives core growth. |
Growth in fitness and active lifestyles | +1.4% | China, India, U.S., Australia | Supports performance demand. |
Expanding youth and student consumer base | +1.2% | Asia Pacific, Latin America, Middle East | Adds frequent consumption. |
Wider retail and convenience-store access | +1.0% | Global retail channels | Improves product reach. |
Growth in gaming and late-night work culture | +0.8% | Urban consumer markets | Supports energy positioning. |
Restraints Impact Analysis
The market faces restraints from health concerns linked to high caffeine, sugar content, artificial ingredients, and overconsumption. Consumers and regulators are paying closer attention to labeling, age-sensitive marketing, and responsible intake. Competition from sports drinks, coffee, functional waters, soft drinks, and ready-to-drink tea also affects growth. Brands must continue improving taste, formulation, and trust to retain consumers in a crowded beverage market.
Impact Factor | Estimated CAGR Impact | Regional Relevance | Market Impact |
|---|---|---|---|
Health concerns over caffeine intake | -0.9% | North America, Europe, developed Asia | Pressures consumption. |
Sugar content and calorie concerns | -0.8% | Global consumer markets | Drives reformulation need. |
Regulatory scrutiny on labeling | -0.7% | Europe, North America, Japan | Raises compliance burden. |
Competition from coffee and sports drinks | -0.6% | Global beverage markets | Limits category share. |
Negative perception among parents and schools | -0.5% | Mature consumer markets | Restricts youth marketing. |
Opportunities Impact Analysis
Opportunities are strong in sugar-free energy drinks, natural caffeine products, sports energy beverages, clean-label formulations, energy shots, and functional blends with vitamins and electrolytes. These formats help brands appeal to consumers seeking energy with better ingredient transparency. Premium and localized flavor innovation also creates strong opportunity. Companies that offer regional taste profiles, smaller packs, affordable pricing, and strong cold-chain distribution can capture deeper penetration in Asia Pacific and other emerging regions.
Impact Factor | Estimated CAGR Impact | Regional Relevance | Market Impact |
|---|---|---|---|
Sugar-free energy drink expansion | +1.6% | Asia Pacific, North America, Europe | Builds health-aligned demand. |
Natural caffeine and clean-label products | +1.3% | U.S., Europe, Japan, South Korea | Adds premium value. |
Sports and fitness energy drinks | +1.1% | Global active lifestyle markets | Supports performance positioning. |
Local flavor innovation | +0.9% | Asia Pacific, Latin America, Middle East | Improves consumer relevance. |
Energy shots and compact formats | +0.7% | Convenience and travel channels | Adds impulse demand. |
Challenges Impact Analysis
The main challenge is balancing strong energy performance with safety, taste, and responsible consumption. Consumers want fast results, but brands must manage caffeine dosage, sugar reduction, ingredient claims, and regulatory expectations. Another challenge is standing out in a highly competitive beverage shelf. Energy drink brands compete not only with each other but also with coffee, carbonated soft drinks, hydration products, and functional wellness beverages.
Impact Factor | Estimated CAGR Impact | Regional Relevance | Market Impact |
|---|---|---|---|
Balancing caffeine strength and safety | -0.8% | Global energy drink brands | Affects consumer trust. |
Maintaining taste after sugar reduction | -0.7% | Health-focused markets | Impacts repeat purchase. |
Differentiating in crowded retail shelves | -0.6% | Supermarkets and convenience stores | Raises marketing cost. |
Managing responsible marketing | -0.5% | North America, Europe, Asia Pacific | Limits promotional flexibility. |
Packaging and ingredient cost pressure | -0.4% | Global producers | Pressures margins. |
Segment Covered in the Report
By Type
Traditional Energy Drinks
Sugar-free or Low-calorie Energy Drinks
Natural or Organic Energy Drinks
By Packaging Type
PET Bottles
Glass Bottles
Aseptic Cartons
Pouches
By Functionality
Endurance and Energy Boost
Muscle Recovery
Cognitive Enhancement
Electrolyte-based Energy Drinks
By Distribution Channel
Retail
HoReCa
By Region
North America
Europe
Asia Pacific
Latin America
Middle East and Africa
Market Trend Analysis
The market trend is moving toward zero-sugar energy drinks, natural energy sources, sports performance positioning, vitamin-enriched beverages, and functional hydration blends. Traditional energy drinks remain important, but reformulated options are gaining stronger shelf space. Metal cans remain a major packaging format because they support portability, chilled consumption, branding, and convenience. Asia Pacific continues to lead volume demand, while North America and Europe support premium and sugar-free product growth.
Impact Factor | Estimated CAGR Impact | Regional Relevance | Market Impact |
|---|---|---|---|
Zero-sugar energy drinks gain momentum | +1.5% | Asia Pacific, North America, Europe | Supports reformulated growth. |
Natural energy ingredients rise | +1.2% | Europe, U.S., Japan, Australia | Builds clean-label demand. |
Sports performance positioning expands | +1.0% | Fitness and gym consumer markets | Adds active lifestyle use. |
Vitamin and electrolyte blends increase | +0.8% | Global functional beverage markets | Supports added-value claims. |
Premium flavor launches grow | +0.7% | Urban and young consumers | Improves repeat buying. |
Investor Type Impact Matrix
Investors should focus on energy drink companies with strong brand identity, distribution reach, reformulation capability, and exposure to sugar-free, functional, and sports-positioned products. Channel execution and flavor innovation remain key growth factors. Strategic investors can also target packaging suppliers, natural caffeine ingredient producers, flavor technology companies, e-commerce beverage platforms, and regional energy drink brands. Businesses that combine taste, energy performance, responsible positioning, and retail visibility are better placed for long-term growth.
Investor Type | Estimated CAGR Impact | Regional Relevance | Market Impact |
|---|---|---|---|
Energy Drink Producers | +1.5% | Global | Expands beverage supply. |
Sugar-Free Beverage Brands | +1.3% | Asia Pacific, North America, Europe | Supports health-focused growth. |
Sports and Functional Beverage Companies | +1.0% | Fitness and active lifestyle markets | Builds premium demand. |
Packaging and Distribution Partners | +0.8% | Global retail channels | Improves market reach. |
Flavor and Ingredient Technology Firms | +0.7% | Global beverage innovation hubs | Supports product differentiation. |
Recent Developments
May 2026: Monster Beverage reported Q1 2026 net sales of USD 2.35 billion, up 26.9%. Monster Energy Drinks segment sales increased 27.6% to USD 2.19 billion, supported by demand and international expansion
June 2026: PepsiCo India launched Adrenaline Rush energy drink in India, adding to Sting. The mass-premium can, priced at INR 60, was introduced in Passion Rush and Classic Rush variants for Gen Z consumers.
Market Concentration
Consolidated
The Energy Drinks Market is highly consolidated, as a small group of leading brands controls most retail visibility, distributor access, chilled shelf space, and consumer recall. In the U.S., the top five energy drink companies account for more than 90% of category sales, which shows that national scale is strongly concentrated among a few established players.
This concentration is supported by strong brand loyalty, large advertising budgets, sports and gaming sponsorships, and wide convenience-store distribution. Red Bull and Monster remain the strongest global brand anchors, while Celsius, Alani Nu, GHOST, C4, and other challengers are gaining share through fitness, lifestyle, and zero-sugar positioning.
Market Structure
The market structure is led by large multinational brands at the top, followed by fast-growing lifestyle brands, regional players, private labels, and niche functional beverage companies. Large companies dominate mainstream energy drinks, while smaller brands compete through clean-label claims, natural caffeine, sugar-free variants, performance positioning, and unique flavor launches.
Entry barriers remain high because new brands need cold-chain access, retailer listing fees, strong distributor partnerships, influencer marketing, and repeat purchase strength. However, the market is still open to innovation, especially in plant-based energy drinks, women-focused energy products, fitness drinks, gaming-focused formats, and low-calorie functional beverages.
Competitive Landscape
The market is characterized by intense competition among established players and emerging companies. Strategic partnerships, mergers and acquisitions, and product innovation are key strategies employed by market participants.
Key Market Players
Red Bull GmbH
Monster Beverage Corporation
PepsiCo, Inc.
The Coca-Cola Company
Keurig Dr Pepper Inc.
Suntory Holdings Limited
T.C. Pharmaceutical Industries Company Limited
Celsius Holdings, Inc.
AriZona Beverages
5-hour Energy
Rockstar Energy
NOS Energy Drink
Applied Nutrition
Other Key Players
Research Methodology
This market study is prepared using a combination of primary and secondary research. Primary research includes discussions with manufacturers, suppliers, distributors, consultants, industry experts, and end users. Secondary research covers company reports, government databases, trade associations, technical publications, regulatory sources, and trusted industry documents. The collected information is used to assess market demand, pricing trends, technology adoption, competitive activity, and regional performance.
AI language models are not used as primary data sources, and publicly available AI-generated content is not treated as market evidence. Computational tools may be used to support data processing, translation, data classification, and pattern identification. However, every published assessment is supported by verified sources, human review, and primary market discussions.
Market estimates are developed through top-down and bottom-up approaches and validated using data triangulation. Revenue, production, shipment, pricing, and application-level data are compared across multiple sources. Forecasts consider economic conditions, regulatory changes, investment activity, innovation, supply chain developments, and industry risks. All findings are reviewed through source verification and internal quality checks before publication.
Part I
Source Management & Input Data Standards
Who provides data, how sources are qualified, and what types of evidence are admissible.
Part II
Research Scope & Market Coverage
How we define the markets we assess and the parameters that govern each product.
Part III
Data Collection, Verification & Submission
The mechanics of gathering, cross-checking, and hierarchically ranking evidence.
Part IV
Assessment Determination & Quality Controls
How raw data becomes a published assessment — normalisation, expert judgement, and outlier exclusion.
Part V
Publication, Corrections & Revision
Our publication schedule, corrections policy, and methodology review cycle.
Part VI
Independence, Ethics & Complaints
Conflict-of-interest policies, editorial independence, and how clients raise concerns.
Google · Preferred Sources
Don't miss the latest market research insights and industry updates on Google.
Add Globe Market Research as a preferred source in the Google app to see our reports, analysis, and market stories in your news suggestions.
Meet the Team
This report was prepared by our expert analysts with deep industry knowledge and research experience.
Pratiksha K. is a Senior Research Analyst with more than five years of experience in market research, industry analysis, competitive intelligence, and business strategy. She has contributed to detailed market reports, customized research studies, company profiling, market sizing, trend analysis, and strategic consulting projects for clients across different regions. Her industry expertise covers Chemical and Material, Consumer Goods, Food & Beverages and Energy & Power. She closely evaluates changing customer requirements, technology developments, regulatory conditions, supply chain structures, investment activity, and competitive strategies to provide clear and practical market insights.
Sayali brings more than 7 years of experience to Globe Market Research, supporting the accuracy, clarity, and relevance of research content across multiple industries. She reviews market data, segment analysis, competitive insights, and industry trends to ensure each report meets strong quality standards and provides practical value to business decision-makers. Her expertise spans healthcare, information technology, consumer goods, and diverse cross-industry domains. With a strong focus on data reliability, structured analysis, and clear presentation, Sayali helps ensure that each research output delivers well-reviewed insights for clients, investors, consultants, and industry stakeholders.
Frequently Asked Questions
Related Reports
More in Food and Beverages
Food Preservatives Market to Hit USD 8.0 Billion by 2035
Food Preservatives Market Size, Share, Analysis By Source (Natural, Synthetic), By Function (Antimicrobial, Antioxidant, Other Functions), By Application (Meat, Poultry and Seafood, Bakery, Dairy, Beverages, Snacks, Other Applications), By Regional Insights, Business plan and Project Report, Investment Opportunities, Profitability, Industry Trends, Leading Companies and Growth Forecasts by 2026-2035
Mezcal Market to Hit USD 6.1 Billion by 2035 | CAGR of 9.1%
Mezcal Market Size, Share, Analysis By Product (Joven, Reposado, Añejo, Others), By Formulation: (100% Agave, Blended Mezcal), By Distribution Channel (On-Trade, Off-Trade, Online Retail, Specialty Stores, Others), By Price Range (Premium / Luxury, Standard, Economy), By Regional Insights, Business plan and Project Report, Investment Opportunities, Profitability, Industry Trends, Leading Companies and Growth Forecasts by 2026-2035
Food Flavors and Enhancers Market to Hit USD 18.40 Bn by 2035 | CAGR of 6.1%
Food Flavors and Enhancers Market Size, Share, Analysis By Product Type (Glutamates, Yeast Extracts, Acidulants, Hydrolyzed Vegetable Protein, Others), By Source (Plant-Based, Synthetic, Microbial, Animal-Based, Others), By Application (Processed Foods, Soups & Sauces, Snacks, Meat Products, Beverages, Others), By Regional Insights, Business plan and Project Report, Investment Opportunities, Profitability, Industry Trends, Leading Companies and Growth Forecasts by 2026-2035
Ready-to-Cook Food Market to Hit USD 10.3 Bn by 2035 | CAGR of 8.1%
Ready-to-Cook Food Market Size, Share, Analysis By Product Type (Frozen Meals, Ready-to-Cook Mixes, Meal Kits, Instant Food Products, Others), By Distribution Channel (Supermarkets & Hypermarkets, Convenience Stores, Online Retail, Specialty Stores, Others), By End User (Household / Residential, Foodservice, Institutional, Others), By Cuisine Type (Western Cuisine, Asian Cuisine, Italian Cuisine, Indian Cuisine, Others), By Regional Insights, Business plan and Project Report, Investment Opportunities, Profitability, Industry Trends, Leading Companies and Growth Forecasts by 2026-2035