

Revenue, 2025
$ 170.1 Bn
Forecast, 2035
$ 347.3 Bn
CAGR, 2025-2035
7.4%
Report Coverage
Global
Market Size and Forecast
The Global Functional Beverages Market was worth USD 170.1 billion in 2025 and is expected to reach USD 347.3 billion by 2035, growing at a CAGR of 7.4% from 2025 to 2035. Based on this growth rate, the market is estimated to reach around USD 187.8 billion in 2026. North America held the largest regional share of 44.8% in 2025, valued at around USD 76.2 billion, supported by strong demand for health-focused beverages, sports drinks, energy drinks, probiotic drinks, and ready-to-drink wellness products.
The Functional Beverages Market includes drinks formulated to provide additional health, nutrition, energy, hydration, or performance benefits beyond basic refreshment. These beverages include energy drinks, sports drinks, fortified water, probiotic drinks, vitamin-enriched beverages, plant-based drinks, functional teas, and wellness shots. The market is closely linked with health-conscious consumption, active lifestyles, convenience retail, and premium beverage innovation.
Key Parameter | Report Details |
|---|---|
Market Revenue, 2025 | USD 170.1 Billion |
Projected Revenue, 2035 | USD 347.3 Billion |
CAGR (2025-2035) | 7.4% |
Largest Region | North America (44.8%, USD 76.2 Bn) |
Fastest Growing Region | Asia Pacific |
Market Concentration | Medium |
Base Year | 2025 |
Forecast Period | 2025-2035 |
The market outlook remains strong as consumers increasingly prefer beverages that support daily wellness, immunity, digestion, focus, and physical performance. Growth can be attributed to rising demand for low-sugar formulations, natural ingredients, functional hydration, and clean-label beverages. The expansion of personalized nutrition, e-commerce beverage sales, and innovative functional ingredients is expected to support long-term market demand.
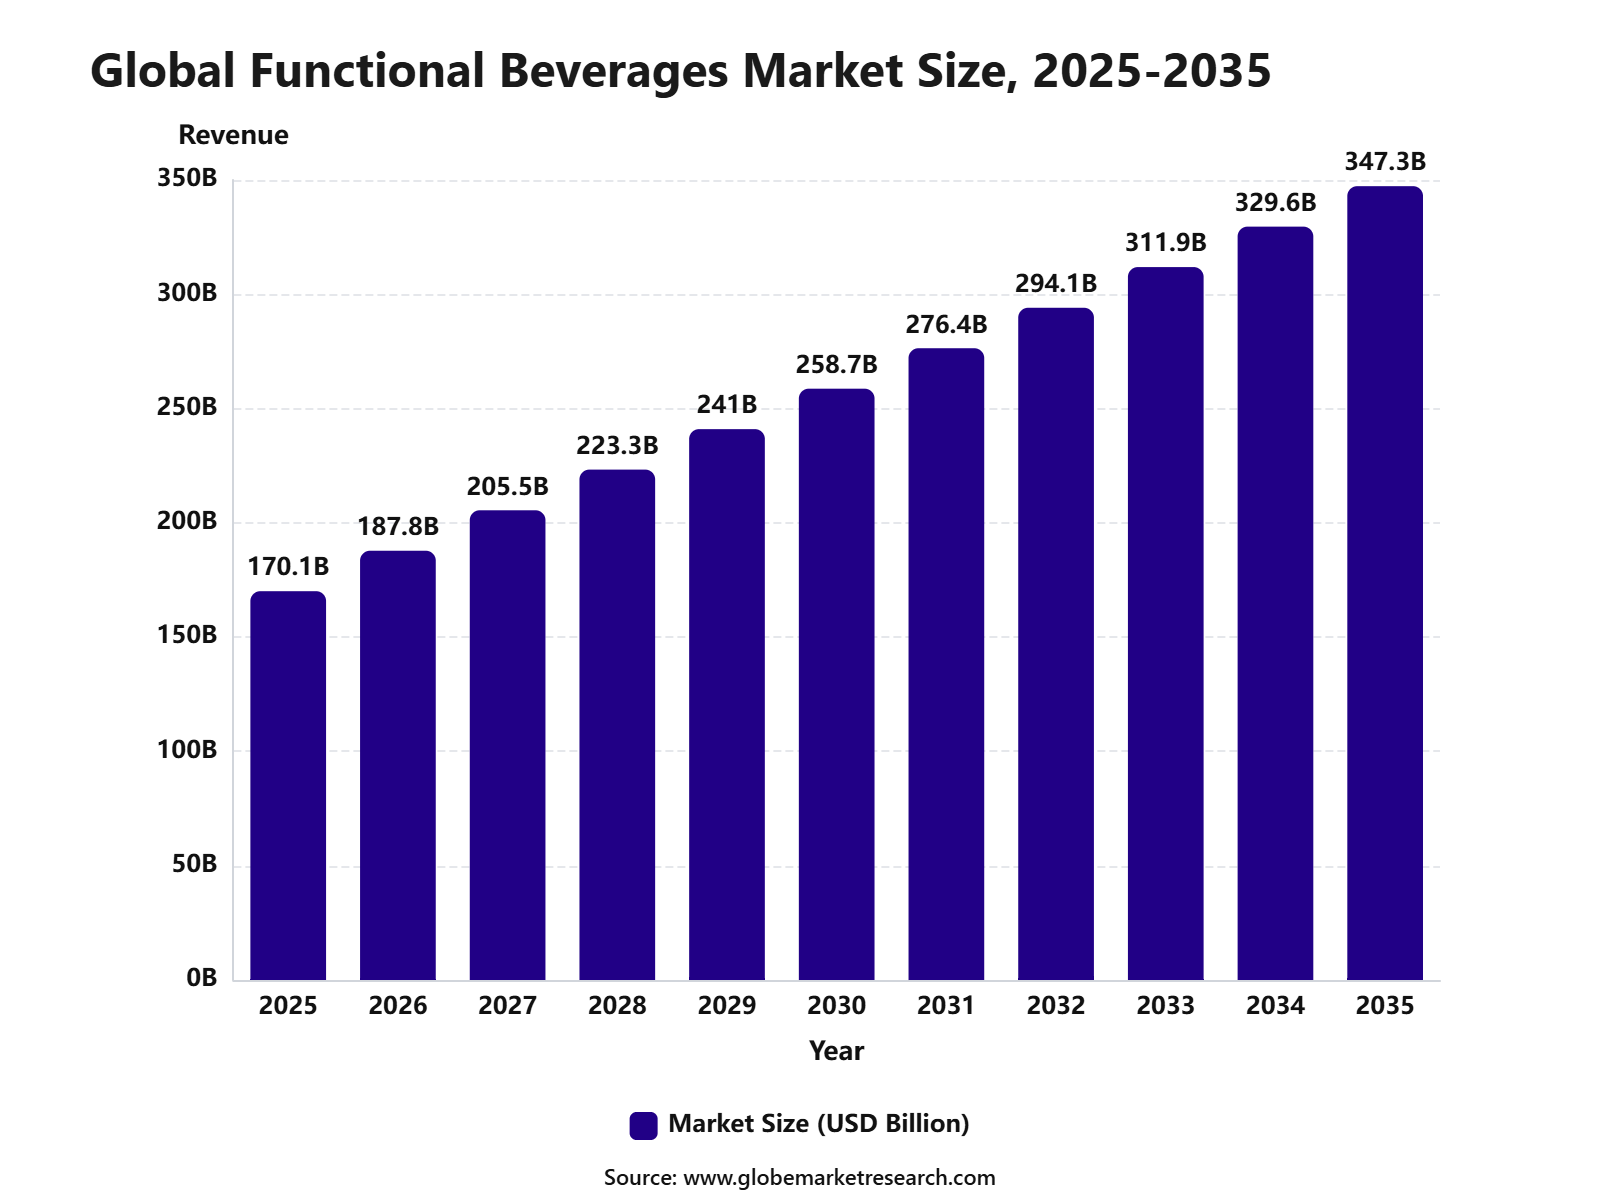 iThe graph shows projected market growth until 2035 based on CAGR analysis. Actual outcomes may vary depending on changing demand, competition, and economic factors.To gain greater insights - request a sample report PDF
Key Market Insights
Energy drinks led the type segment with 43.2% share, supported by strong demand for ready-to-drink products that offer energy, alertness, stamina, and active lifestyle support.
Fitness lifestyle users accounted for 46.1% share by end user, driven by rising health awareness, gym participation, sports nutrition demand, and preference for functional drinks that support hydration, recovery, and performance.
North America led the functional beverages market with 44.8% share, valued at USD 76.2 billion, supported by high consumer spending on wellness drinks, strong retail availability, and growing demand for energy, protein, probiotic, and vitamin-enriched beverages.
Top Funding and Investment
Top 5 Investment
In February 2026, Eastroc Beverage raised about USD 1.3 billion through its Hong Kong share sale, with proceeds planned for expansion, branding, supply-chain upgrades, overseas growth, and acquisitions.
In April 2026, Reliance Consumer Products planned a ₹1,500 crore non-alcoholic beverage hub in Katol, Maharashtra, covering beverages, fruit juices, and energy drinks.
In May 2025, Coca-Cola Europacific Partners Australia invested AUD 75 million in a Richlands canning line designed mainly for Monster Energy production, with capacity of up to 120,000 cans per hour.
In March 2026, Fullife Healthcare raised ₹300 crore from Elev8 Venture Partners to scale Fast&Up, Chicnutrix, manufacturing, distribution, and product innovation across health and wellness categories.
In January 2025, Hiyo secured USD 19 million in funding, including Series A funds, prior convertibles, and recapitalization, for its non-alcoholic functional beverage business.
Top 3 Funding
In February 2025, OLIPOP raised USD 50 million in Series C funding led by J.P. Morgan Private Capital, valuing the prebiotic soda brand at USD 1.85 billion.
In November 2025, TRIP raised USD 40 million in funding from Coefficient Capital and celebrity investors to support U.S. expansion of its calming functional drinks business.
In November 2025, Lucky Energy raised USD 25 million in Series B funding led by Paine Schwartz Partners to support national expansion of its clean energy drink brand.
By Type
Energy drinks accounted for 43.2% share of the Functional Beverages Market. This leading position is supported by strong demand for beverages that provide quick energy, alertness, stamina, and performance support among active consumers.
The segment is widely consumed by fitness users, students, working professionals, gamers, and people with busy lifestyles. Ingredients such as caffeine, taurine, B vitamins, electrolytes, amino acids, and natural energy extracts are commonly used to support energy and endurance claims.
Demand for energy drinks is expected to remain strong as brands continue to launch sugar-free, low-calorie, natural caffeine, and functional ingredient-based products. Wider availability through retail stores, gyms, convenience stores, and online platforms will continue to support segment growth.
By End User
Fitness lifestyle users held 46.1% share of the Functional Beverages Market. This dominance can be attributed to rising consumer interest in active living, workout performance, hydration, muscle recovery, weight management, and daily wellness support.
Functional beverages are increasingly used before, during, and after workouts to support energy, endurance, hydration, and recovery. Products such as energy drinks, protein beverages, electrolyte drinks, fortified waters, and amino acid drinks are gaining strong traction among gym-goers and health-focused consumers.
The segment is expected to remain the largest end-user group as fitness culture, sports participation, and preventive wellness habits continue to expand. Demand will be supported by convenient ready-to-drink formats, cleaner labels, and targeted products for active and performance-oriented consumers.
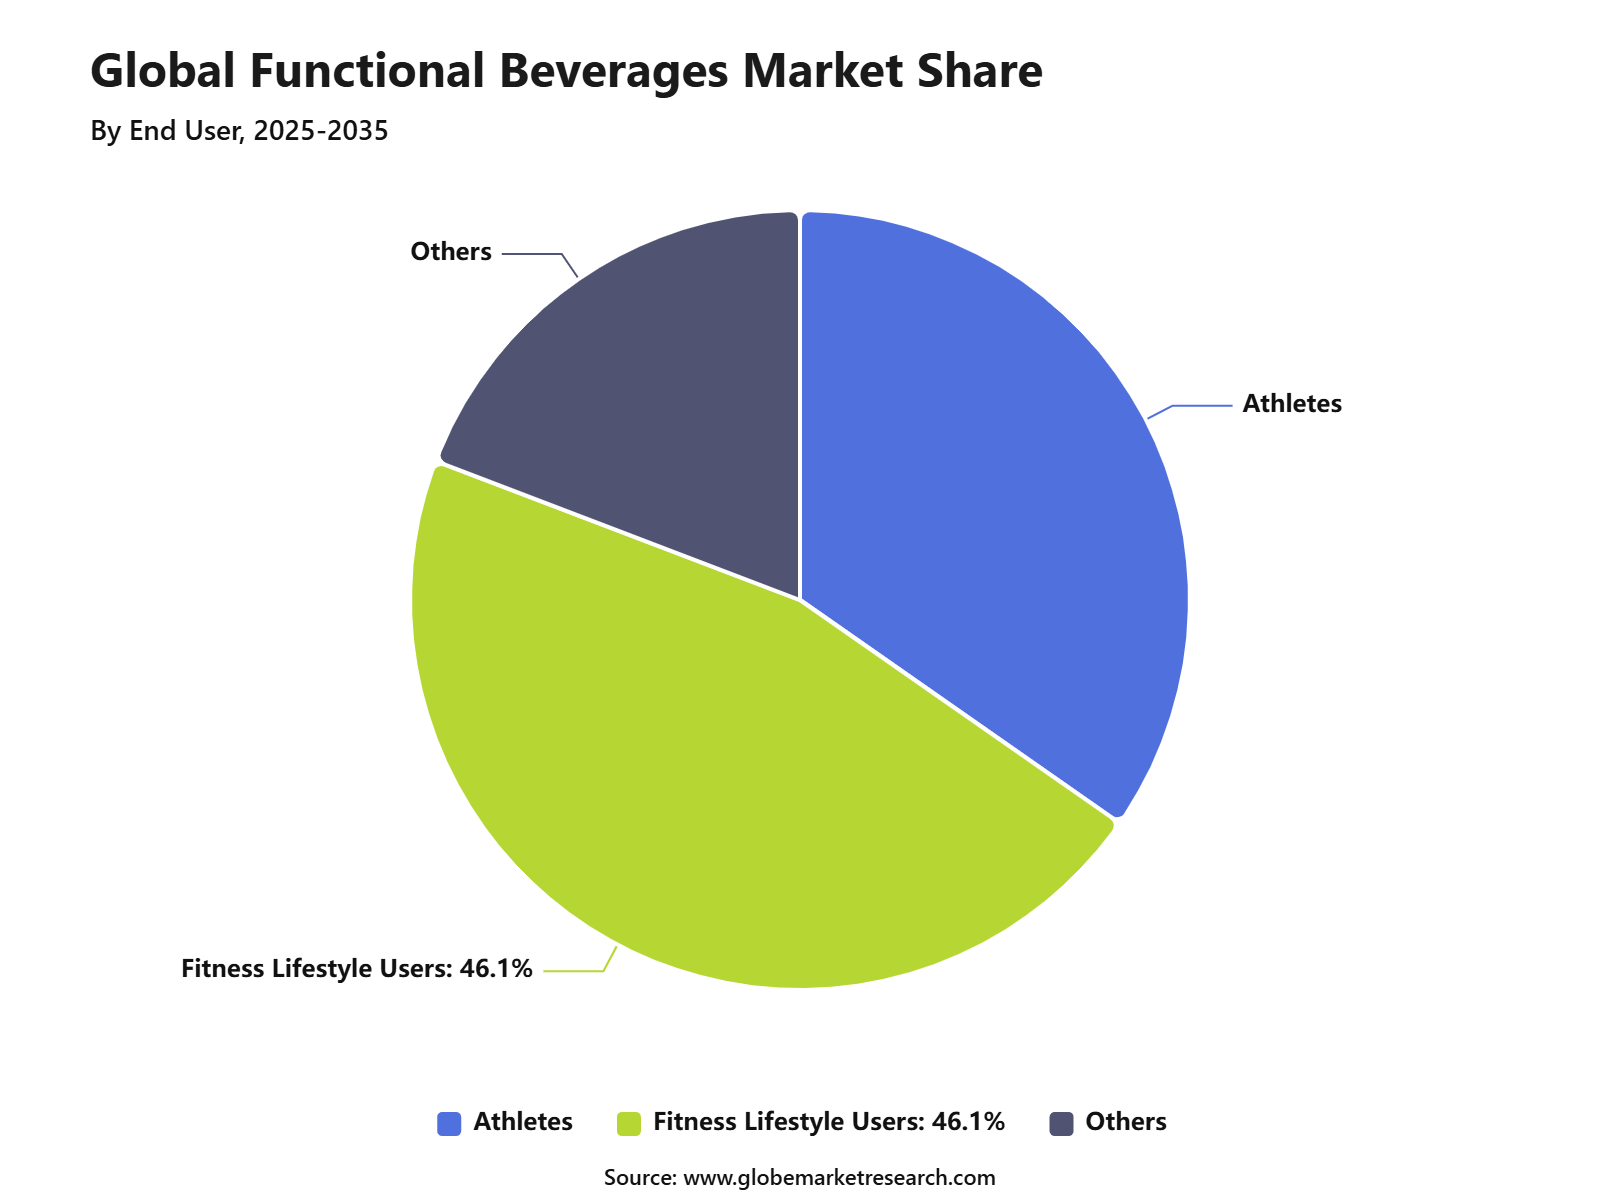 iThe graph shows projected market growth until 2035 based on CAGR analysis. Actual outcomes may vary depending on changing demand, competition, and economic factors.To gain greater insights - request a sample report PDF
By Region
North America accounted for 44.8% share of the Functional Beverages Market, reaching USD 76.2 billion. The region’s leadership is supported by high consumer awareness, strong fitness culture, advanced retail networks, and wide acceptance of health-focused beverage formats.
The United States and Canada are key contributors due to strong demand for energy drinks, sports drinks, fortified waters, probiotic drinks, protein beverages, and wellness shots. Consumers in the region are increasingly choosing beverages that combine refreshment with specific benefits such as energy, hydration, immunity, digestion, and recovery.
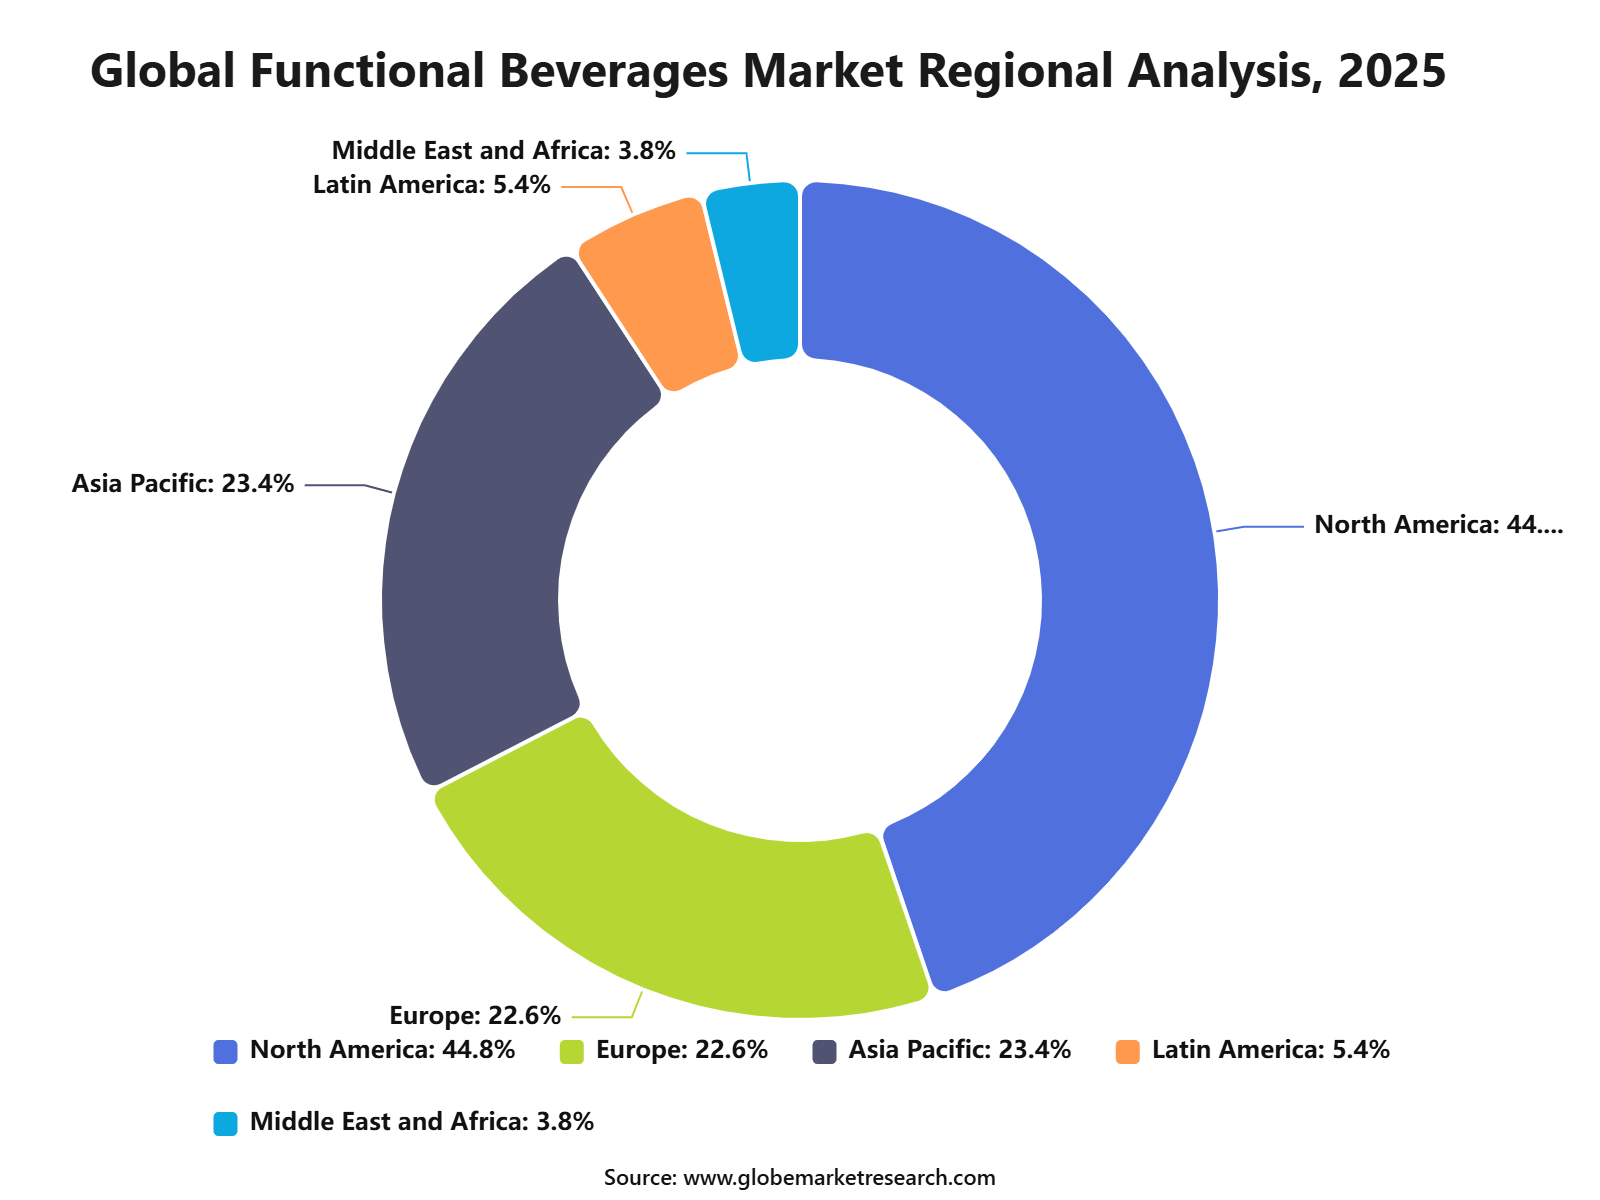 iThe graph shows projected market growth until 2035 based on CAGR analysis. Actual outcomes may vary depending on changing demand, competition, and economic factors.To gain greater insights - request a sample report PDF
Regional Impact Analysis
North America leads the Functional Beverages Market with 44.8% share in 2025, equal to about USD 76.2 billion, supported by strong energy drink consumption, sports nutrition demand, premium wellness beverages, and wide retail distribution. The U.S. remains the main regional driver due to strong convenience store sales, fitness culture, and rapid product innovation.
Europe remains important because of low-sugar beverage demand, clean-label preferences, probiotic drinks, and plant-based beverage growth. Asia Pacific is expected to build future demand through urbanization, rising disposable income, functional tea drinks, sports beverages, and digestive health products.
Impact Factor | Estimated CAGR Impact | Regional Relevance | Market Impact |
|---|---|---|---|
North America market leadership | +2.5% | North America, 44.8% share in 2025 | Leads global value demand. |
U.S. energy and wellness drink demand | +1.6% | U.S. | Drives regional growth. |
Canada clean-label beverage adoption | +1.0% | Canada | Supports premium demand. |
Europe low-sugar and probiotic trend | +0.9% | Germany, UK, France, Italy | Builds health-focused value. |
Asia Pacific urban functional drink growth | +0.8% | China, Japan, India, South Korea | Supports future scale. |
Go-To-Market and Sales Economics
Functional beverages are sold through supermarkets, convenience stores, gyms, pharmacies, cafés, vending, foodservice, and direct-to-consumer subscriptions. The strongest route is high-frequency retail because U.S. convenience in-store sales reached USD 341.2 billion in 2025, rising 1.7%. This supports chilled placement for hydration, energy, protein, probiotic, and vitamin drinks.
Sales economics are supported by premium pricing, multipacks, subscriptions, and repeat daily use. U.S. retail e-commerce sales reached USD 326.7 billion in Q1 2026, up 9.8% year over year, while e-commerce accounted for 16.9% of total retail sales. This gives functional beverage brands a strong online route for bundles and education.
Large beverage companies are using functional formats to protect growth. Coca-Cola reported Q1 2026 net revenue growth of 12% to USD 12.5 billion, while global unit case volume grew 3%. Water, sports, coffee, and tea remained important growth areas, supporting beverages positioned around hydration, energy, recovery, and wellness occasions.
Risk Factors & Market Barriers
Sugar content remains a key barrier because many functional drinks still rely on sweet taste to drive repeat purchase. FDA’s 2026 added-sugars guidance states that added sugars should be limited to less than 10% of daily calories, equal to 50 grams per day on a 2,000-calorie diet.
Caffeine scrutiny is increasing, especially for energy, focus, and performance beverages. FDA states that 400 mg of caffeine per day is generally not linked with negative effects for most adults, but sensitivity varies. In 2026, FDA also listed caffeine-content labeling for foods and beverages as a priority guidance topic.
Claim risk is another barrier because immunity, gut health, focus, metabolism, detox, and beauty claims must be supported. Probiotic and botanical beverages face stronger evidence expectations, ingredient stability issues, and shelf-life challenges. NIH notes that probiotic products differ by strain and use, meaning broad claims may create consumer trust and compliance risks.
Revenue Potential Analysis
Revenue Landscape Across
Revenue is spread across energy drinks, sports drinks, protein drinks, kombucha, probiotic beverages, vitamin waters, functional teas, ready-to-drink coffee, electrolyte drinks, and prebiotic sodas. Keurig Dr Pepper reported Q1 2026 net sales of USD 3.976 billion, up 9.4%, supported by favorable pricing and 2.6% volume or mix growth.
Energy and performance drinks remain among the strongest revenue pools. Celsius reported Q1 2026 revenue of USD 782.6 million, up 138% from the prior year, supported by the Alani Nu and Rockstar Energy acquisitions. This shows how portfolio expansion is being used to capture functional energy demand across retail channels.
Functional beverages also benefit from established global distribution. Monster Beverage reported Q1 2026 net sales growth of 26.9% to USD 2.35 billion and operating income growth of 28.1% to USD 730.0 million. Strong branded energy-drink performance supports wider retailer acceptance of functional, sugar-free, and performance-oriented beverage formats.
Financial Impact
Functional beverages can improve financial performance through higher unit pricing, strong repeat consumption, and better shelf productivity than basic drinks. The financial case is strongest when brands combine clear benefits, good taste, low sugar, and visible claims. Premium single-serve pricing also supports gross margin when distribution and packaging costs are controlled.
Profitability depends on ingredient cost, aluminum cans, cold-chain logistics, trade promotion, retailer fees, influencer marketing, and product returns. Coca-Cola’s Q1 2026 operating margin improved to 35.0% from 32.9%, showing how scale, pricing, and revenue management can protect beverage economics during cost pressure.
The strongest financial impact is expected from brands that balance science, compliance, and repeat habit formation. Low-sugar hydration, caffeine-transparent energy drinks, protein beverages, and gut-health drinks are better positioned than broad wellness claims. FDA’s 2026 caffeine-labeling focus indicates that clearer disclosure may become a competitive advantage.
Drivers Impact Analysis
The Functional Beverages Market is driven by rising demand for health-focused drinks, energy drinks, sports beverages, probiotic drinks, fortified waters, ready-to-drink teas, plant-based drinks, and immunity-support beverages. Consumers are choosing drinks that offer hydration, energy, digestion support, weight management, mental focus, and overall wellness benefits.
North America leads the market due to strong beverage innovation, high consumer spending on wellness products, wide retail availability, and strong adoption of energy and sports drinks. The U.S. remains the key regional contributor because of its mature functional beverage brands, convenience store distribution, fitness culture, and fast-growing demand for low-sugar and clean-label drinks.
Impact Factor | Estimated CAGR Impact | Regional Relevance | Market Impact |
|---|---|---|---|
Rising demand for health-focused beverages | +2.0% | North America, Europe, Asia Pacific | Drives core market growth. |
Growth in energy and sports drinks | +1.7% | U.S., Canada, UK, Japan | Supports high-volume demand. |
Increasing preference for low-sugar drinks | +1.4% | North America and Europe | Builds healthier product adoption. |
Expansion of probiotic and digestive drinks | +1.2% | U.S., Europe, Japan, South Korea | Adds functional wellness value. |
Growth in ready-to-drink formats | +1.0% | Urban retail and online channels | Improves convenience-led sales. |
Restraints Impact Analysis
The market faces restraints from sugar content concerns, caffeine-related health issues, regulatory scrutiny, and intense competition across beverage categories. Functional beverage brands must balance taste, health claims, ingredient safety, and clear product positioning.
Another restraint is premium pricing. Many functional beverages use added vitamins, minerals, probiotics, adaptogens, electrolytes, plant extracts, or protein, which can raise production costs and limit mass-market adoption in price-sensitive regions.
Impact Factor | Estimated CAGR Impact | Regional Relevance | Market Impact |
|---|---|---|---|
Sugar and calorie concerns | -1.0% | North America, Europe, developed Asia | Pressures standard formulations. |
Caffeine and stimulant safety concerns | -0.9% | Energy drink markets | Raises consumer and regulatory caution. |
High competition from regular beverages | -0.8% | Global retail beverage markets | Affects brand differentiation. |
Premium product pricing | -0.7% | Emerging and mass consumer markets | Limits wider adoption. |
Strict claim and labeling requirements | -0.6% | U.S., Canada, Europe, Japan | Restricts marketing flexibility. |
Opportunities Impact Analysis
Opportunities are strong in low-sugar energy drinks, functional waters, probiotic drinks, immunity beverages, plant-based drinks, protein beverages, electrolyte drinks, and mental wellness beverages. These products benefit from consumer interest in daily wellness and convenient nutrition.
Higher-value opportunities are also emerging in clean-label beverages, natural caffeine drinks, adaptogen-based formulas, beauty drinks, gut-health products, and personalized hydration solutions. Brands that combine credible ingredients, good taste, and clear benefits can capture stronger repeat purchases.
Impact Factor | Estimated CAGR Impact | Regional Relevance | Market Impact |
|---|---|---|---|
Low-sugar energy drink expansion | +1.9% | North America, Europe, Asia Pacific | Builds healthier growth. |
Functional water and hydration products | +1.5% | U.S., Canada, Europe, Japan | Supports daily-use demand. |
Probiotic and gut-health beverages | +1.3% | North America, Europe, Asia Pacific | Adds digestive wellness value. |
Plant-based functional beverages | +1.1% | U.S., Canada, Europe, urban Asia | Supports clean-label demand. |
Mental focus and relaxation drinks | +0.9% | Premium wellness markets | Creates new usage occasions. |
Challenges Impact Analysis
The main challenge is proving functional benefits in a crowded beverage market. Consumers see many claims around energy, immunity, digestion, hydration, focus, beauty, and relaxation, so brands need credible ingredients and transparent labeling.
Another challenge is maintaining taste and shelf stability while adding active ingredients. Probiotics, proteins, botanicals, vitamins, minerals, and natural sweeteners can affect flavor, texture, clarity, and product life.
Impact Factor | Estimated CAGR Impact | Regional Relevance | Market Impact |
|---|---|---|---|
Proving clear functional benefits | -0.9% | Global beverage consumers | Affects repeat purchase. |
Maintaining taste with active ingredients | -0.8% | Functional drink producers | Influences consumer acceptance. |
Managing shelf-life stability | -0.7% | Probiotic and fortified beverages | Impacts product quality. |
Avoiding overuse of health claims | -0.6% | Regulated markets | Protects brand credibility. |
Controlling formulation cost | -0.5% | Mass-market beverage brands | Supports price competitiveness. |
Segment Covered in the Report
By Type
Energy Drink
Caffeinated Beverages
Probiotic Drinks
Vegetable and Fruit Beverages
Nutraceutical Drinks
Juices
Enhanced Water
Others
By End User
Athletes
Fitness Lifestyle Users
Others
By Region
North America
Europe
Asia Pacific
Latin America
Middle East and Africa
Market Trend Analysis
The market trend is moving toward low-sugar beverages, clean-label ingredients, functional hydration, natural energy drinks, probiotic beverages, protein drinks, and plant-based wellness drinks. Consumers increasingly prefer beverages that provide both refreshment and measurable health value.
Convenience stores, supermarkets, gyms, pharmacies, online platforms, and direct-to-consumer channels are expanding product visibility. North America remains the value leader, while Asia Pacific and Europe continue to grow through wellness beverages, digestive health drinks, and natural functional products.
Impact Factor | Estimated CAGR Impact | Regional Relevance | Market Impact |
|---|---|---|---|
Low-sugar and zero-sugar drinks expand | +1.8% | North America, Europe, developed Asia | Supports healthier choices. |
Natural energy beverages gain traction | +1.5% | U.S., Canada, UK, Australia | Builds clean energy demand. |
Functional hydration trend grows | +1.2% | Fitness and active lifestyle users | Adds daily-use occasions. |
Probiotic drinks remain popular | +1.0% | Japan, South Korea, Europe, U.S. | Supports gut-health positioning. |
Plant-based wellness drinks rise | +0.8% | North America and Europe | Adds clean-label value. |
Investor Type Impact Matrix
Investors should focus on functional beverage companies with strong brand positioning, clean-label formulations, reliable distribution, attractive flavors, and clear consumer benefit claims. Repeat purchase, retail visibility, and product differentiation are key success factors.
Strategic investors can also target energy drink brands, probiotic beverage producers, functional water companies, plant-based beverage makers, and ready-to-drink wellness platforms. Companies that combine taste, convenience, and credible health benefits are better positioned for long-term growth.
Investor Type | Estimated CAGR Impact | Regional Relevance | Market Impact |
|---|---|---|---|
Functional Beverage Brands | +1.6% | Global | Expands wellness drink supply. |
Energy and Sports Drink Companies | +1.3% | North America, Europe, Asia Pacific | Supports high-volume growth. |
Probiotic and Gut-Health Beverage Producers | +1.1% | U.S., Europe, Japan, South Korea | Builds functional demand. |
Functional Water and Hydration Brands | +0.9% | North America and urban markets | Adds daily-use opportunity. |
Strategic Food and Beverage Investors | +0.7% | Global beverage markets | Funds product expansion. |
Recent Developments
In June 2026, Danone agreed to acquire MADE Group, an Australia-based healthy nutrition company with functional beverages, dairy and plant-based products, expanding its APAC wellness beverage presence.
In April 2026, Suntory Holdings announced the acquisition of Daiichi Sankyo Healthcare, strengthening its health-focused consumer business, while its beverage division continued work across non-alcoholic and wellness-led drink categories.
In May 2025, PepsiCo completed the acquisition of poppi for USD 1.95 billion, strengthening its prebiotic soda and functional beverage portfolio with a fast-growing, low-sugar brand targeting wellness-focused consumers.
Competitive Landscape
The market is characterized by intense competition among established players and emerging companies. Strategic partnerships, mergers and acquisitions, and product innovation are key strategies employed by market participants.
Key Market Players
PepsiCo, Inc.
The Coca-Cola Company
Red Bull GmbH
Monster Beverage Corporation
Nestlé S.A.
Danone S.A.
Keurig Dr Pepper Inc.
Celsius Holdings, Inc.
Suntory Holdings Limited
The Kraft Heinz Company
Unilever PLC
Fonterra Co-operative Group Limited
The Hain Celestial Group, Inc.
Universal Nutrition
Campbell Soup Company
Other Key Players
Research Methodology
This market study is prepared using a combination of primary and secondary research. Primary research includes discussions with manufacturers, suppliers, distributors, consultants, industry experts, and end users. Secondary research covers company reports, government databases, trade associations, technical publications, regulatory sources, and trusted industry documents. The collected information is used to assess market demand, pricing trends, technology adoption, competitive activity, and regional performance.
AI language models are not used as primary data sources, and publicly available AI-generated content is not treated as market evidence. Computational tools may be used to support data processing, translation, data classification, and pattern identification. However, every published assessment is supported by verified sources, human review, and primary market discussions.
Market estimates are developed through top-down and bottom-up approaches and validated using data triangulation. Revenue, production, shipment, pricing, and application-level data are compared across multiple sources. Forecasts consider economic conditions, regulatory changes, investment activity, innovation, supply chain developments, and industry risks. All findings are reviewed through source verification and internal quality checks before publication.
Part I
Source Management & Input Data Standards
Who provides data, how sources are qualified, and what types of evidence are admissible.
Part II
Research Scope & Market Coverage
How we define the markets we assess and the parameters that govern each product.
Part III
Data Collection, Verification & Submission
The mechanics of gathering, cross-checking, and hierarchically ranking evidence.
Part IV
Assessment Determination & Quality Controls
How raw data becomes a published assessment — normalisation, expert judgement, and outlier exclusion.
Part V
Publication, Corrections & Revision
Our publication schedule, corrections policy, and methodology review cycle.
Part VI
Independence, Ethics & Complaints
Conflict-of-interest policies, editorial independence, and how clients raise concerns.
Google · Preferred Sources
Don't miss the latest market research insights and industry updates on Google.
Add Globe Market Research as a preferred source in the Google app to see our reports, analysis, and market stories in your news suggestions.
Meet the Team
This report was prepared by our expert analysts with deep industry knowledge and research experience.
Pratiksha K. is a Senior Research Analyst with more than five years of experience in market research, industry analysis, competitive intelligence, and business strategy. She has contributed to detailed market reports, customized research studies, company profiling, market sizing, trend analysis, and strategic consulting projects for clients across different regions. Her industry expertise covers Chemical and Material, Consumer Goods, Food & Beverages and Energy & Power. She closely evaluates changing customer requirements, technology developments, regulatory conditions, supply chain structures, investment activity, and competitive strategies to provide clear and practical market insights.
Sayali brings more than 7 years of experience to Globe Market Research, supporting the accuracy, clarity, and relevance of research content across multiple industries. She reviews market data, segment analysis, competitive insights, and industry trends to ensure each report meets strong quality standards and provides practical value to business decision-makers. Her expertise spans healthcare, information technology, consumer goods, and diverse cross-industry domains. With a strong focus on data reliability, structured analysis, and clear presentation, Sayali helps ensure that each research output delivers well-reviewed insights for clients, investors, consultants, and industry stakeholders.
Frequently Asked Questions
Related Reports
More in Food and Beverages
Frozen Desserts Market to Hit USD 298.8 Billion by 2035
Frozen Desserts Market Size, Share, Analysis By Product (Ice Cream, Frozen Yogurt, Gelato, Sorbet, Frozen Cakes, Other Products), By Consumption (Retail Consumption, Foodservice Consumption), By Distribution Channel (Supermarkets and Hypermarkets, Convenience Stores, Specialty Stores, Online Retail), By Regional Insights, Business plan and Project Report, Investment Opportunities, Profitability, Industry Trends, Leading Companies and Growth Forecasts by 2026-2035
Frozen Meat and Seafood Market to Hit USD 181.1 Billion by 2035
Frozen Meat and Seafood Market Size, Share, Analysis By Product (Frozen Meat, Frozen Seafood), By Seafood Form (Whole, Fillets, Processed Seafood, Other Forms), By Seafood End Use (Retail and Household, Foodservice, Industrial), By Regional Insights, Business plan and Project Report, Investment Opportunities, Profitability, Industry Trends, Leading Companies and Growth Forecasts by 2026-2035
Frozen Meals Market to Hit USD 74.2 Billion by 2035
Frozen Meals Market Size, Share, Analysis By Product (Frozen, Chilled, Canned, Shelf-Stable), By Meal Type (Vegetarian, Non-Vegetarian, Vegan), By Distribution Channel (Supermarkets and Hypermarkets, Online Retail, Convenience Stores, Specialty Stores), By Regional Insights, Business plan and Project Report, Investment Opportunities, Profitability, Industry Trends, Leading Companies and Growth Forecasts by 2026-2035
Food Colorants Market to Hit USD 8.6 Billion by 2035
Food Colorants Market Size, Share, Analysis By Type (Natural, Synthetic, Nature-Identical), By Form (Powder, Liquid, Gel), By Application (Beverages, Bakery and Confectionery, Dairy, Meat Products, Snacks, Other Applications), By Regional Insights, Business plan and Project Report, Investment Opportunities, Profitability, Industry Trends, Leading Companies and Growth Forecasts by 2026-2035