

Revenue, 2026
USD 1.1 Trillion
Forecast, 2035
USD 6.3 Trillion
CAGR, 2026-2035
22.2%
Report Coverage
Global
Market Size and Forecast
Digital infrastructure includes data centres, cloud computing platforms, fibre-optic networks, mobile broadband, edge facilities, internet exchanges, servers, storage systems and specialised AI processors. These systems provide the computing capacity and connectivity required for digital payments, online commerce, streaming, enterprise software, artificial intelligence and connected devices. Investment is increasingly focused on high-density data centres, low-latency networks, hybrid cloud systems, cybersecurity, energy-efficient cooling and infrastructure positioned closer to end users.
The global Digital Infrastructure Market was valued at USD 1.1 trillion in 2026 and is projected to reach approximately USD 6.3 trillion by 2035, growing at a CAGR of 22.2% from 2026 to 2035. North America commanded around 40.4% of the market, equivalent to approximately USD 444.4 billion at the stated 2026 market value. Regional leadership is being supported by hyperscale cloud investment, extensive fibre and 5G networks, advanced data-centre capacity and strong demand for AI accelerators across technology, financial services, healthcare, retail and government applications.
Key Parameter | Report Details |
|---|---|
Market Revenue, 2026 | USD 1.1 Trillion |
Projected Revenue, 2035 | USD 6.3 Trillion |
CAGR, 2026-2035 | 22.2% |
Largest Region | North America, 40.4% Share |
Market Concentration | Medium |
Base Year | 2025 |
Forecast Period | 2026-2035 |
Digital activity is creating sustained demand for additional connectivity and computing capacity. The International Telecommunication Union estimated that 6 billion people, or 74% of the global population, used the internet in 2025, an increase of more than 240 million users from the previous year. GSMA reported that mobile technologies and services contributed USD 7.6 trillion to the global economy in 2025, equal to 6.4% of global GDP. Data-centre electricity demand increased by 17% during 2025, while global consumption is projected to reach around 945 TWh by 2030, highlighting the scale of investment required in power, cooling, compute and network infrastructure.
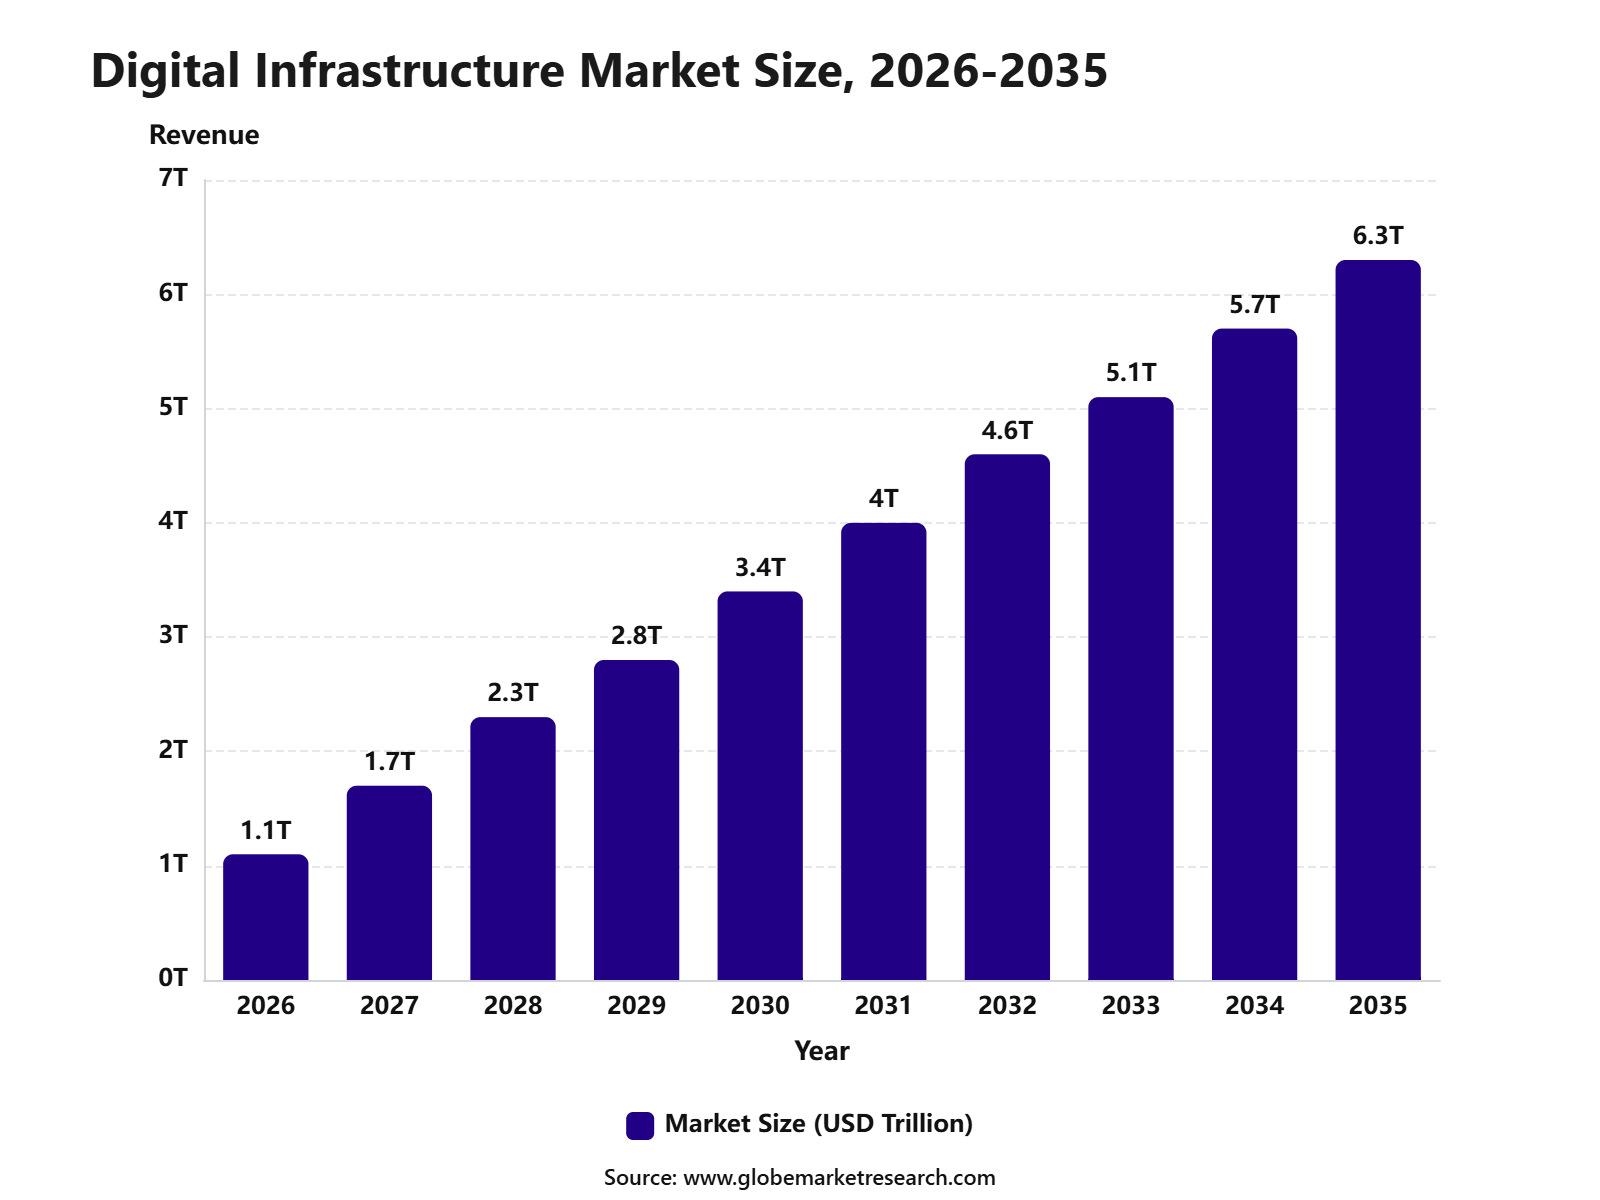 iThe graph shows projected market growth until 2035 based on CAGR analysis. Actual outcomes may vary depending on changing demand, competition, and economic factors.To gain greater insights - request a sample report PDF
Key Market Insights
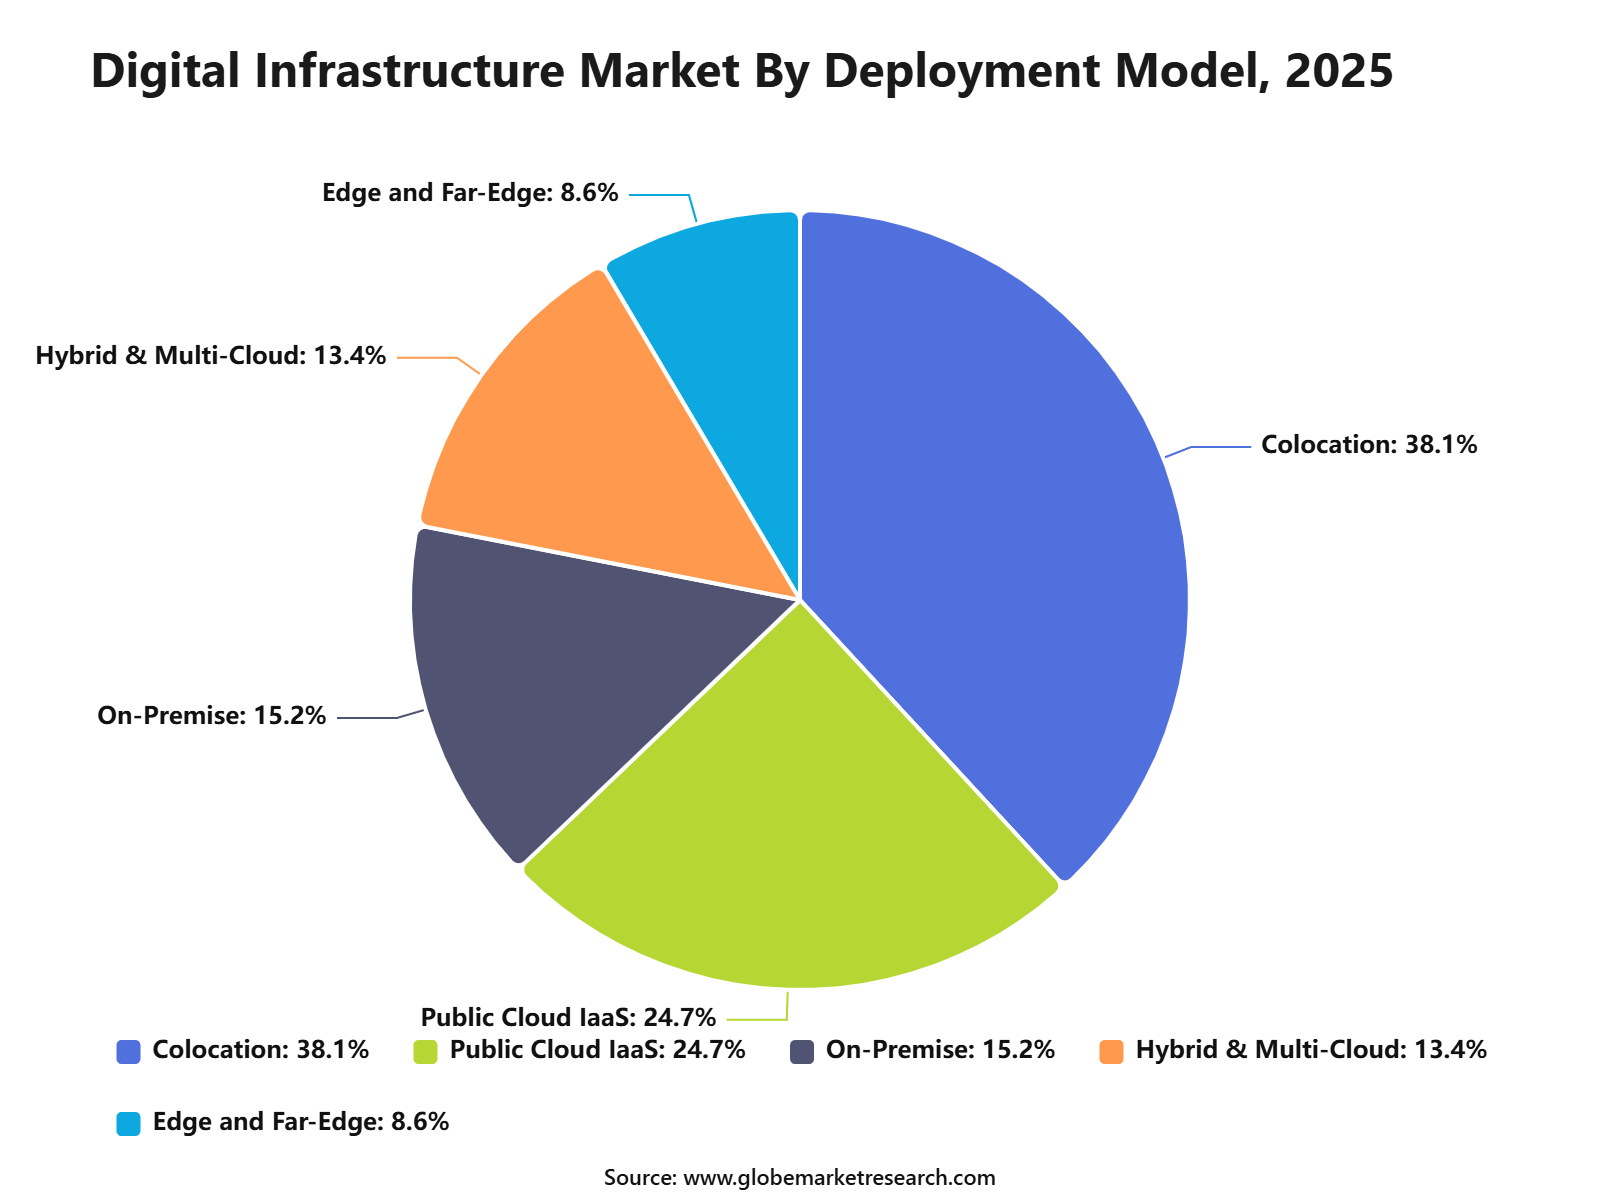
Colocation led the deployment model segment with 38.1% share, supported by rising enterprise demand for scalable data center space, secure hosting, reliable connectivity, and lower infrastructure ownership costs.
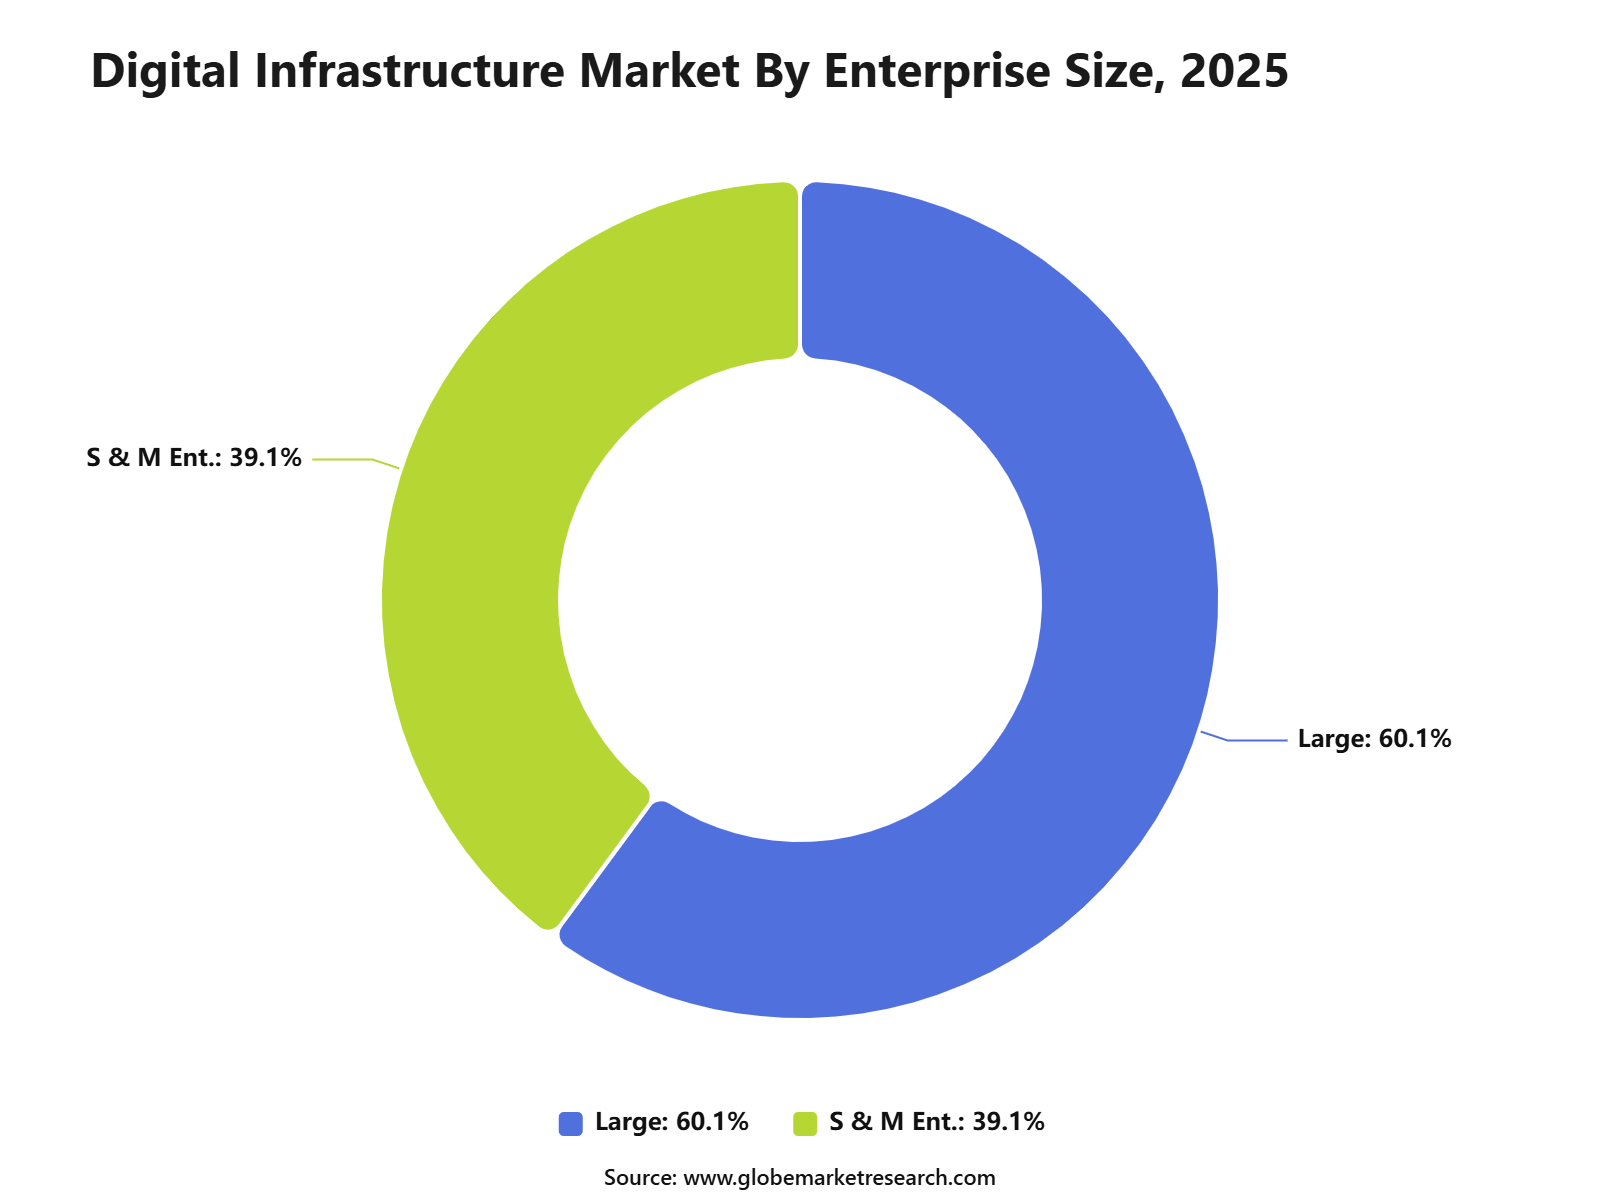
Large enterprises accounted for 60.1% share, driven by higher digital workload volumes, stronger IT budgets, complex cloud requirements, and growing demand for resilient infrastructure.
AI accelerators and specialized chips held 30.5% share by infrastructure layer, supported by rapid adoption of AI workloads, high-performance computing, GPU-based processing, and advanced data center modernization.
IT and telecom captured 26.3% share by end-user vertical, driven by rising data traffic, cloud service expansion, 5G infrastructure growth, and increasing demand for low-latency digital services.
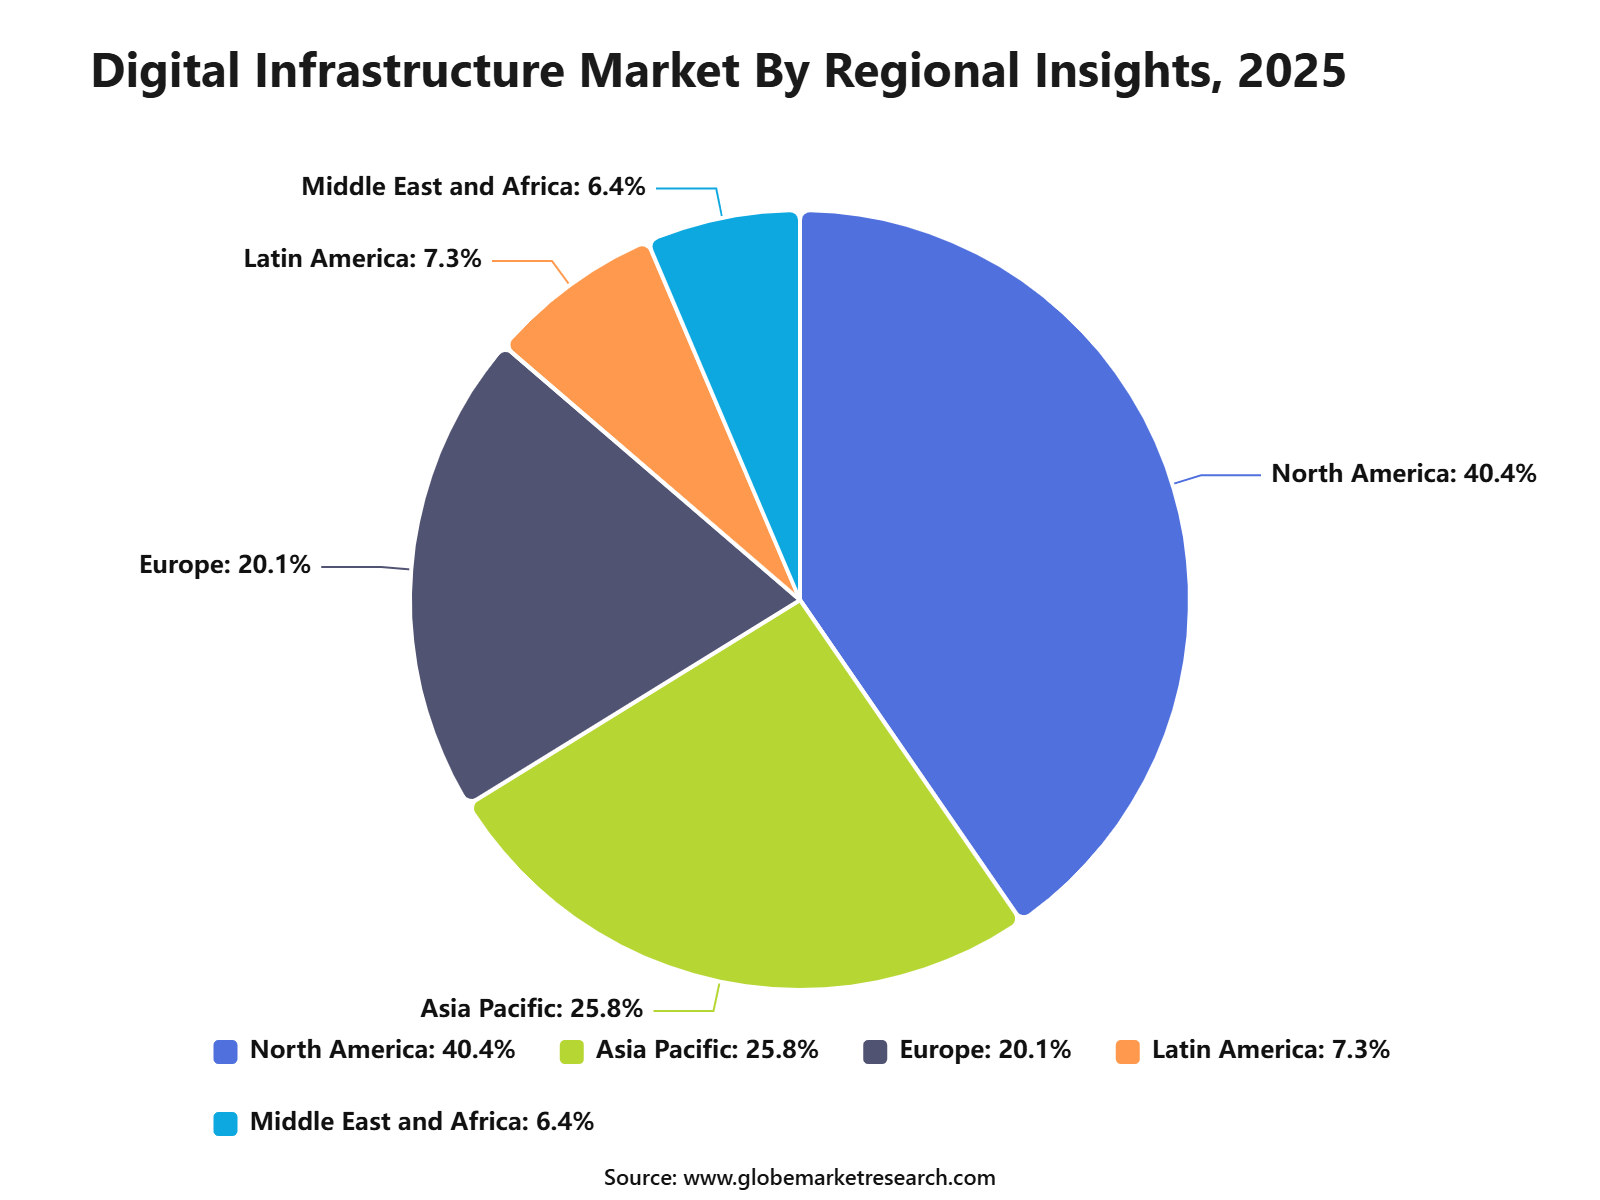
North America commanded 40.4% share of the digital infrastructure market, supported by strong hyperscale data center capacity, advanced cloud adoption, high enterprise digitization, and continued investment in AI-ready infrastructure.
Adoption Rate and Usage Statistics
According to the International Telecommunication Union and Google, digital infrastructure adoption continued to expand globally in 2025 and 2026. Internet penetration reached 74%, while 82% of people aged ten years and above owned a mobile phone. Around 55% of the global population was covered by 5G, and 5G represented 36% of mobile broadband subscriptions. Global IPv6 adoption reached 49.46% in June 2026, reflecting the continued modernization of internet networks.
Metric | Usage Value |
|---|---|
Internet Users | 6 billion |
Mobile Subscriptions | 9.2 billion |
Fixed Data Traffic | 7.3 ZB |
Mobile Data Traffic | 1.5 ZB |
Data-Centre Electricity | 485 TWh |
Digital infrastructure supported six billion internet users and 9.2 billion mobile subscriptions worldwide in 2025. Fixed broadband networks carried approximately 7.3 zettabytes of data, compared with 1.5 zettabytes carried through mobile broadband networks. Global data centres consumed about 485 terawatt-hours of electricity, demonstrating the increasing infrastructure requirements associated with cloud computing, AI workloads, streaming, connected devices and digital services.
Metric | Usage Value |
|---|---|
Internet Users | 6 billion |
Mobile Subscriptions | 9.2 billion |
Fixed Data Traffic | 7.3 ZB |
Mobile Data Traffic | 1.5 ZB |
Data-Centre Electricity | 485 TWh |
Deployment Model Insights
Colocation accounted for 38.1% of the Digital Infrastructure Market by deployment model. Its leading position is supported by growing demand for secure data center space, reliable power, advanced cooling and direct connectivity to cloud and network providers. Colocation allows organizations to retain control over their servers while avoiding the cost and complexity of constructing and operating dedicated facilities.
According to the Uptime Institute’s 2025 survey findings, around 55% of enterprise workloads were hosted off-premises, while 45% remained in company-operated data centers. The off-premises share is expected to increase further as organizations move workloads toward cloud, hosting and colocation environments that provide flexible capacity and specialized operational support.
Colocation adoption is also being supported by AI workloads that require higher power density and improved cooling systems. Providers are expanding interconnection services, liquid-cooling capacity and high-density server areas to serve cloud platforms and enterprises. Location, electricity availability, network access, security certification and expansion flexibility will remain important selection factors.
 iThe graph shows projected market growth until 2035 based on CAGR analysis. Actual outcomes may vary depending on changing demand, competition, and economic factors.To gain greater insights - request a sample report PDF
Enterprise Size Insights
Large enterprises held 60.1% of the Digital Infrastructure Market by enterprise size. These organizations operate extensive application portfolios, employee networks, databases and customer-facing systems across multiple locations. Their infrastructure requirements commonly include cloud computing, cybersecurity, data storage, enterprise software, networking and disaster recovery.
According to Eurostat, 84.67% of large EU enterprises purchased cloud computing services in 2025, compared with 66.78% of medium-sized enterprises and 49.3% of small enterprises. Among large organizations using paid cloud services, 87.67% purchased infrastructure services and 52.86% used cloud platforms for application development, testing or deployment.
Large enterprises generally require digital infrastructure that can support high transaction volumes, strict security controls and operations across different countries. Providers must offer reliable service agreements, system integration, centralized administration and regulatory compliance. Hybrid infrastructure will remain important because many large organizations operate cloud services alongside private data centers and existing business systems.
 iThe graph shows projected market growth until 2035 based on CAGR analysis. Actual outcomes may vary depending on changing demand, competition, and economic factors.To gain greater insights - request a sample report PDF
Infrastructure Layer Insights
AI accelerators and specialized chips captured 30.5% of the market by infrastructure layer. Their strong position is supported by the rapid expansion of AI training, inference, analytics and automated decision-making workloads. General-purpose processors remain important, but specialized chips are increasingly required to process large models efficiently and reduce response time.
According to the Semiconductor Industry Association, semiconductors represented more than 95% of the content value of a leading AI server rack in 2026. Chips also accounted for more than 50% of the capital expenditure required to build and operate an AI data center, while a single advanced AI server rack contained more than 4,500 packaged chips.
Infrastructure Layer | Market Share |
|---|---|
AI Accelerators and Specialized Chips | 30.5% |
Facilities | 18.4% |
Network | 15.6% |
Compute | 14.8% |
Software | 12.7% |
Other Infrastructure Layers | 8.0% |
Infrastructure design is therefore becoming closely connected with processor availability, memory bandwidth, networking speed and cooling capacity. Accelerators must operate with CPUs, storage devices and network processors as part of a complete computing system. Buyers are expected to focus on performance per watt, software compatibility, workload flexibility and access to reliable semiconductor supply.
End-user Vertical Insights
IT and telecom captured 26.3% of the Digital Infrastructure Market by end-user vertical. The segment relies on data centers, broadband networks, cloud platforms, fibre systems and edge computing facilities to deliver digital services. Rising mobile data use, cloud applications and connected devices are increasing infrastructure requirements across both fixed and wireless networks.
According to the International Telecommunication Union, 9.2 billion mobile-cellular subscriptions were active worldwide in 2025. Mobile broadband reached 99 subscriptions per 100 inhabitants and represented 89% of all mobile subscriptions. The ITU also reported that 36% of mobile broadband subscriptions used 5G technology.
Telecom operators must continue expanding fibre capacity, data processing resources and low-latency connections as traffic increases. Greater use of 5G, artificial intelligence and cloud-based network functions will require closer integration between telecommunications and data center infrastructure. Energy efficiency, network resilience, cybersecurity and coverage quality will influence future investment decisions.
End User | Market Share |
|---|---|
IT and Telecom | 26.3% |
BFSI | 18.4% |
Manufacturing | 14.2% |
Government | 11.8% |
Healthcare | 10.7% |
Retail | 9.9% |
Other Industries | 8.7% |
Regional Insights
North America accounted for 40.4% of the Digital Infrastructure Market. Regional leadership is supported by extensive cloud adoption, a large concentration of hyperscale data centers, advanced telecommunications networks and strong enterprise demand for AI computing. The United States represents the central infrastructure base, supported by established technology ecosystems and substantial electricity generation capacity.
According to a June 2026 facility-level study, 403 hyperscale data centers operated in the United States between May 2024 and April 2025. These facilities consumed an estimated 68 to 99 TWh of electricity, with the central scenario representing approximately 1.8% of total U.S. electricity consumption. U.S. Energy Information Administration, national electricity generation reached a record 4.43 thousand TWh in 2025, increasing by 2.8% from 2024. The agency identified commercial demand, including data centers, as an important contributor to recent electricity consumption growth.
 iThe graph shows projected market growth until 2035 based on CAGR analysis. Actual outcomes may vary depending on changing demand, competition, and economic factors.To gain greater insights - request a sample report PDF
Case Study: Microsoft Fairwater AI Campus
In June 2026, Microsoft completed and opened its first Fairwater AI datacenter facility in Mount Pleasant, Wisconsin. Nearly 10,000 construction workers participated in the project, while approximately 550 full-time employees now support its operations. The facility shows how digital infrastructure investment creates demand across computing systems, cooling, electrical equipment, networking and technical services.
Microsoft expects its local hyperscale construction spending in Wisconsin to reach USD 4.7 billion by 2028. Direct purchases have been made from 29 businesses across 11 counties, covering steel fabrication, machinery, electrical equipment and construction materials. This demonstrates how large datacenter projects distribute revenue across regional suppliers rather than limiting spending to technology vendors.
Construction of a second facility is already underway, with completion scheduled for 2028. Once operational, the number of permanent employees at the Mount Pleasant site is expected to increase to around 800. The project highlights that successful digital infrastructure expansion depends on computing capacity, reliable power, skilled labor, local procurement and sustained community participation.
Market Dynamics
Drivers Impact Analysis
The Digital Infrastructure Market is driven by rapid growth in cloud computing, AI data centers, 5G networks, edge computing, fiber connectivity, cybersecurity platforms, and enterprise digital transformation. As businesses generate more data and adopt AI-based workflows, demand for scalable compute, storage, power, cooling, and connectivity continues to rise.
North America leads the market due to strong hyperscale cloud investment, advanced telecom infrastructure, enterprise IT spending, and AI-ready data center expansion. The U.S. remains the key regional contributor because of its large cloud provider base, data center ecosystem, AI infrastructure investments, and high digital service consumption.
Impact Factor | Estimated CAGR Impact | Regional Relevance | Market Impact |
|---|---|---|---|
Cloud computing expansion | +6.7% | North America, Europe, Asia Pacific | Drives large-scale compute and storage demand. |
AI data center growth | +6.0% | U.S., Canada, Japan, South Korea | Increases demand for high-density infrastructure. |
5G and fiber network rollout | +4.8% | Developed and emerging markets | Supports faster digital connectivity. |
Enterprise digital transformation | +4.1% | BFSI, healthcare, retail, manufacturing | Expands infrastructure modernization. |
Edge computing adoption | +3.4% | Telecom, retail, industrial, smart cities | Supports low-latency applications. |
Restraints Impact Analysis
The market faces restraints from high capital expenditure, rising energy consumption, land constraints, grid connection delays, and hardware supply pressure. Digital infrastructure projects require heavy investment in facilities, servers, networking, power systems, cooling, and skilled operations. Another restraint is the growing pressure around sustainability, data privacy, cybersecurity, and regulatory compliance. Data center and telecom operators must manage power usage, carbon targets, data localization rules, and service reliability expectations.
Impact Factor | Estimated CAGR Impact | Regional Relevance | Market Impact |
|---|---|---|---|
High infrastructure capital cost | -3.8% | Data centers, telecom, cloud networks | Raises entry barriers. |
Power availability and energy cost | -3.3% | North America, Europe, Asia Pacific | Limits capacity expansion. |
Land and permitting constraints | -2.7% | Major metro and data center hubs | Delays new projects. |
Cybersecurity and resilience risks | -2.2% | Global digital infrastructure users | Raises security investment needs. |
Hardware supply chain constraints | -1.8% | Servers, chips, cooling, networking | Slows deployment timelines. |
Opportunities Impact Analysis
Opportunities are strong in AI-ready data centers, hyperscale campuses, fiber networks, edge infrastructure, cloud interconnection, cybersecurity infrastructure, liquid cooling, digital power systems, and green data centers. These areas benefit from rising data traffic, cloud migration, AI workloads, and enterprise digitization. Higher-value opportunities are emerging in AI accelerators, sovereign cloud, private networks, hybrid cloud infrastructure, smart city platforms, and energy-efficient data center design. Providers that combine scale, uptime, connectivity, energy efficiency, and security can capture stronger long-term value.
Impact Factor | Estimated CAGR Impact | Regional Relevance | Market Impact |
|---|---|---|---|
AI-ready data center development | +6.4% | North America, Europe, Asia Pacific | Builds high-value compute capacity. |
Edge infrastructure expansion | +5.1% | Telecom, retail, manufacturing | Supports real-time digital services. |
Fiber and broadband network growth | +4.3% | U.S., Canada, India, Southeast Asia | Improves digital access. |
Green data center investment | +3.7% | North America and Europe | Supports sustainable infrastructure. |
Sovereign and secure cloud demand | +3.0% | Government, BFSI, healthcare | Adds compliance-led growth. |
Challenges Impact Analysis
The main challenge is scaling digital infrastructure while controlling cost, power use, uptime risk, and environmental impact. AI and high-performance computing workloads require dense racks, advanced cooling, reliable grid access, and resilient network architecture. Another challenge is integrating multiple infrastructure layers, including facilities, power, cooling, compute, storage, network, cybersecurity, and software automation. Poor integration can increase downtime risk, operating cost, and deployment complexity.
Impact Factor | Estimated CAGR Impact | Regional Relevance | Market Impact |
|---|---|---|---|
Scaling power-intensive infrastructure | -3.6% | AI and data center hubs | Raises energy and grid pressure. |
Maintaining uptime and reliability | -3.0% | Cloud, telecom, enterprise networks | Increases redundancy requirements. |
Integrating multi-layer infrastructure | -2.5% | Hybrid and multi-cloud users | Adds operational complexity. |
Skilled workforce shortage | -2.0% | Data center and network operations | Slows project execution. |
Sustainability compliance pressure | -1.7% | North America, Europe, large enterprises | Requires cleaner energy planning. |
Key Market Segments
Deployment Model
Colocation
Public Cloud IaaS
On-Premise
Hybrid and Multi-Cloud
Edge and Far-Edge
Infrastructure Layer
Facilities
Network
Compute
AI Accelerators
Software
Other Infrastructure Layers
Enterprise Size
Large Enterprises
Small and Medium-Sized Enterprises
End User
IT and Telecom
BFSI
Retail
Manufacturing
Healthcare
Government
Other Industries
Region
North America
Europe
Asia Pacific
Latin America
Middle East and Africa
Go-to-Market and Sales Economics
According to Globe Market Research, the go-to-market approach for the Digital Infrastructure Market should focus on scalable computing capacity, reliable power supply, low-latency connectivity, cybersecurity and rapid deployment. Data centre operators, cloud providers, telecom companies and AI infrastructure developers should be targeted through application-specific solutions. The International Energy Agency reported that global data centre electricity demand increased by 17% in 2025, demonstrating the need for infrastructure that combines computing, cooling, power and network capacity.
Sales strategies should begin with capacity assessments, power availability studies, network design and phased infrastructure commitments. Customers increasingly require reserved capacity before new cloud, colocation and AI facilities become operational. Digital Realty signed bookings expected to generate USD 423 million in annualized rental revenue at its share during the first quarter of 2026, indicating strong demand for contracted digital infrastructure capacity.
The strongest commercial model will combine colocation, cloud connectivity, managed network services, security, technical support and interconnection within recurring contracts. Customers can be charged based on occupied space, power consumption, bandwidth, ports, cross-connects and managed services. Equinix generated USD 2.444 billion in revenue during the first quarter of 2026, reflecting continued demand for integrated data centre and connectivity platforms.
Financial Impact
Digital infrastructure development requires substantial upfront spending on land, buildings, servers, cooling equipment, electrical systems, fiber routes and backup power. Long construction periods and equipment requirements can delay revenue generation and increase financing costs. Equinix expects total capital expenditure of approximately USD 4.1 billion in 2026, illustrating the capital-intensive nature of data centre expansion.
Power efficiency will directly influence operating margins because cooling and computing systems consume large amounts of electricity. Operators with efficient facility designs can lower energy expenses, improve available capacity and support customer sustainability requirements. Digital Realty reported an average design power usage effectiveness ratio of 1.20 for the data centres delivered under sustainable building standards in 2025.
Cybersecurity, service continuity and disaster recovery will remain major operating cost factors. Infrastructure providers must invest in physical security, network monitoring, access controls, backup systems and incident response capabilities. IBM reported that the average cost of a data breach in the United States reached USD 10.22 million in 2025, making security performance an important commercial and financial requirement.
Recent Developments
Market News
In January 2026, Aware Super invested USD 300 million in the Skyline joint venture, which indirectly owns Vantage Data Centers’ Asia-Pacific operations. The portfolio includes more than 10 data-center assets across Australia, Japan, Taiwan, Malaysia, and Hong Kong.
In February 2026, India introduced a tax holiday until 2047 for qualifying foreign cloud service providers using data-center infrastructure located in India. The policy is intended to attract international cloud investment, AI computing projects, data-center campuses, and supporting digital infrastructure.
In February 2026, DigitalBridge and other shareholders agreed to sell Substantial Group, the parent of UK full-fiber operator Netomnia, to nexfibre at an enterprise value of GBP 2 billion. Netomnia’s fiber network had reached more than three million premises and approximately 460,000 customers.
In March 2026, Microsoft announced plans to invest more than USD 1 billion in Thailand between 2026 and 2028. The investment covers cloud and AI infrastructure, ongoing operations, cybersecurity cooperation, and workforce development.
In April 2026, Microsoft confirmed that it was on track to spend USD 5.5 billion on cloud and AI infrastructure and related operations in Singapore between 2025 and 2029. The investment supports Singapore’s role as a regional cloud, connectivity, and enterprise technology hub.
Mergers
In May 2026, DigitalBridge described its planned acquisition of ArcLight as a strategic combination of power and digital infrastructure investment platforms. The combined businesses would oversee assets representing more than USD 150 billion and provide expertise across data centers, fiber, towers, electricity generation, transmission, renewables, batteries, and energy storage.
In July 2026, Lightstorm, Microsoft, Singtel, and Tata Communications followed a consortium structure for the I-2SEA cable project. The agreement combines Lightstorm’s terrestrial fiber and network-management platform with Microsoft’s cloud requirements, Singtel’s cable experience, Tata Communications’ international network, NEC’s submarine cable systems, and ASEAN Cableship’s installation capabilities.
Acquisitions
In March 2026, DigitalBridge and JEXI completed the acquisition of selected NEC data-center facilities in Greater Tokyo and Kansai. NEC remained the anchor customer, while the facilities were transferred to a standalone platform that can attract additional enterprise and colocation demand.
Funding
In January 2026, Aware Super invested USD 300 million in Vantage Data Centers’ Asia-Pacific platform through the Skyline joint venture. Aware Super reported that its total digital infrastructure investments had exceeded A$6 billion following the transaction.
In April 2026, KKR committed USD 1.5 billion in equity to Vertical Bridge. KKR, DigitalBridge, and La Caisse will support tower development, organic network expansion, and potential acquisitions across the company’s nationwide US communications infrastructure portfolio.
In May 2026, DigitalBridge completed USD 400 million in securitized financing. The transaction included USD 300 million in secured fund-fee revenue notes and a USD 100 million variable-funding facility.
In June 2026, Blackstone outlined a proposed USD 30 billion investment in Japanese AI data centers over three to five years. The scale of the planned programme indicates that large infrastructure funds are directing more capital toward land, electricity, cooling, data-center construction, and supporting connectivity.
Competitive Landscape
The market is characterized by intense competition among established players and emerging companies. Strategic partnerships, mergers and acquisitions, and product innovation are key strategies employed by market participants.
Key Market Players
Cisco Systems, Inc.
Huawei Technologies Co., Ltd.
Nokia Corporation
Telefonaktiebolaget LM Ericsson
Dell Technologies Inc.
Hewlett Packard Enterprise Company
Lenovo Group Limited
Super Micro Computer, Inc.
Arista Networks, Inc.
Juniper Networks, Inc.
Schneider Electric SE
Vertiv Holdings Co.
Fujitsu Limited
Other Key Players
Research Methodology
This market study is prepared using a combination of primary and secondary research. Primary research includes discussions with manufacturers, suppliers, distributors, consultants, industry experts, and end users. Secondary research covers company reports, government databases, trade associations, technical publications, regulatory sources, and trusted industry documents. The collected information is used to assess market demand, pricing trends, technology adoption, competitive activity, and regional performance.
AI language models are not used as primary data sources, and publicly available AI-generated content is not treated as market evidence. Computational tools may be used to support data processing, translation, data classification, and pattern identification. However, every published assessment is supported by verified sources, human review, and primary market discussions.
Market estimates are developed through top-down and bottom-up approaches and validated using data triangulation. Revenue, production, shipment, pricing, and application-level data are compared across multiple sources. Forecasts consider economic conditions, regulatory changes, investment activity, innovation, supply chain developments, and industry risks. All findings are reviewed through source verification and internal quality checks before publication.
Part I
Source Management & Input Data Standards
Who provides data, how sources are qualified, and what types of evidence are admissible.
Part II
Research Scope & Market Coverage
How we define the markets we assess and the parameters that govern each product.
Part III
Data Collection, Verification & Submission
The mechanics of gathering, cross-checking, and hierarchically ranking evidence.
Part IV
Assessment Determination & Quality Controls
How raw data becomes a published assessment — normalisation, expert judgement, and outlier exclusion.
Part V
Publication, Corrections & Revision
Our publication schedule, corrections policy, and methodology review cycle.
Part VI
Independence, Ethics & Complaints
Conflict-of-interest policies, editorial independence, and how clients raise concerns.
Google · Preferred Sources
Don't miss the latest market research insights and industry updates on Google.
Add Globe Market Research as a preferred source in the Google app to see our reports, analysis, and market stories in your news suggestions.
Meet the Team
This report was prepared by our expert analysts with deep industry knowledge and research experience.
Prashant S. is a Research Analyst at Globe Market Research with more than four years of experience in market research and industry analysis. He specializes in the Aerospace and Defence, Automotive and Transportation, Semiconductor and Electronics, Information and Technology sectors, with expertise in market sizing, trend analysis, competitive assessment, and industry forecasting. He applies primary and secondary research, data validation, company analysis, and market estimation methods to deliver reliable insights for strategic planning and business decision-making.
Sayali brings more than 7 years of experience to Globe Market Research, supporting the accuracy, clarity, and relevance of research content across multiple industries. She reviews market data, segment analysis, competitive insights, and industry trends to ensure each report meets strong quality standards and provides practical value to business decision-makers. Her expertise spans healthcare, information technology, consumer goods, and diverse cross-industry domains. With a strong focus on data reliability, structured analysis, and clear presentation, Sayali helps ensure that each research output delivers well-reviewed insights for clients, investors, consultants, and industry stakeholders.
Frequently Asked Questions
Related Reports
More in Information and Technology
South Korea Physical AI Market Size to Reach USD 3.6 billion by 2035
South Korea Physical AI Market Size, Share, Trends and Growth Analysis Report By Deployment (On-Device AI, Cloud-Based AI), By Component (Hardware, Software, Services), By Technology (Computer Vision, Speech and Natural Language Processing, Gesture and Movement Recognition, Reinforcement Learning and Control Systems, Other Technologies), By Robot Type (Service Robots, Humanoid and Social Robots, Collaborative Robots, Exoskeletons and Prosthetics, Mobile Robots and Drones, Industrial Robots), By Application (Healthcare, Manufacturing and Automotive, Logistics and Warehousing, Retail and Hospitality, Other Applications), By Technology Trends, Competitive Landscape, Strategic Opportunities and Growth Forecast, 2026-2035
Physical AI Market Size to hit USD 2,129.0 billion by 2035
Physical AI Market Size, Share, Trends and Growth Analysis Report By Component (Hardware, Software, Services), By Technology (Computer Vision, Machine Learning and Deep Learning, Natural Language Processing, Edge AI, Other Technologies), By Product (Robots, Exoskeletons, Autonomous Systems, Smart Appliances), By Application (Automation and Manufacturing, Logistics and Supply Chain, Healthcare, Automotive, Defense and Security, Retail, Education, Other End Uses), By Regional Insights, Technology Trends, Competitive Landscape, Strategic Opportunities and Growth Forecast, 2026-2035
Edtech SaaS Tools Market Size to hit USD 217.6 billion by 2035
EdTech SaaS Tools Market Size, Share, Trends and Growth Analysis Report By Software (Classroom Management Systems, Document Management Systems, Learning and Gamification Platforms, Learning Management Systems, Student Collaboration Systems, Assessment and Analytics Tools, Content Authoring Tools, Other Software), By Sector (Preschool, K-12, Higher Education, Other Education Sectors), By Deployment (Cloud-Based, Hybrid), By End Use (Businesses, Educational Institutions, Individual Learners and Consumers), By Regional Insights, Technology Trends, Competitive Landscape, Strategic Opportunities and Growth Forecast, 2026–2035
Marketing Technology Market Size to Reach USD 3,810.8 billion by 2035
Marketing Technology Market Size, Share, Trends and Growth Analysis Report By Marketing Type (Digital Marketing, Offline Marketing), By Product (Social Media Tools, Content Marketing Tools, Rich Media Tools, Marketing Automation Tools, Data and Analytics Tools, Sales Enablement Tools), By Deployment (Cloud-Based, On-Premises, Other Deployment Models), By Enterprise Type (Large Enterprises, Small and Medium-Sized Enterprises), By Application (IT and Telecommunication, Retail and E-commerce, Healthcare, Media and Entertainment, Sports and Events, BFSI, Real Estate, Other Applications), By Regional Insights, Technology Trends, Competitive Landscape, Strategic Opportunities and Growth Forecast, 2026-2035