

Revenue, 2026
USD 92.3 Bn
Forecast, 2035
USD 145.7 Bn
CAGR, 2026-2035
5.2%
Report Coverage
Global
Market Size and Forecast
The Global Sweeteners Market was worth USD 92.3 billion in 2026 and is expected to reach USD 145.7 billion by 2035, growing at a CAGR of 5.2% from 2026 to 2035. Asia Pacific held the largest regional share of 50.6% in 2026, valued at around USD 46.7 billion, supported by high food and beverage production, rising packaged food consumption, and strong demand from confectionery, bakery, dairy, and beverage applications.
The Sweeteners Market includes sugar, high-intensity sweeteners, low-calorie sweeteners, sugar alcohols, natural sweeteners, and specialty sweetening ingredients used across food, beverages, pharmaceuticals, personal care, and nutritional products. Sweeteners are widely used to improve taste, texture, mouthfeel, shelf stability, and product appeal in both traditional and reduced-sugar formulations.
Market growth is being supported by rising demand for processed foods, ready-to-drink beverages, bakery products, desserts, dairy items, and functional nutrition products. Consumers are also showing stronger interest in low-sugar, zero-calorie, plant-based, and natural sweetener options. Food manufacturers are using blended sweetener systems to balance taste, cost, clean-label positioning, and sugar-reduction goals.
Key Parameter | Report Details |
|---|---|
Market Revenue, 2026 | USD 92.3 Billion |
Projected Revenue, 2035 | USD 145.7 Billion |
CAGR (2026-2035) | 5.2% |
Largest Region | Asia Pacific: 50.6%, USD 46.7 Bn |
Market Concentration | Medium |
Forecast Period | 2026-2035 |
Asia Pacific is expected to remain the leading region due to its large population, expanding middle class, growing food processing industry, and strong demand from China, India, Japan, South Korea, and Southeast Asian markets. Regional growth is supported by higher consumption of packaged snacks, soft drinks, confectionery, and convenience foods. Long-term market growth will depend on taste innovation, regulatory approval, pricing stability, clean-label demand, and wider use of healthier sweetening solutions.
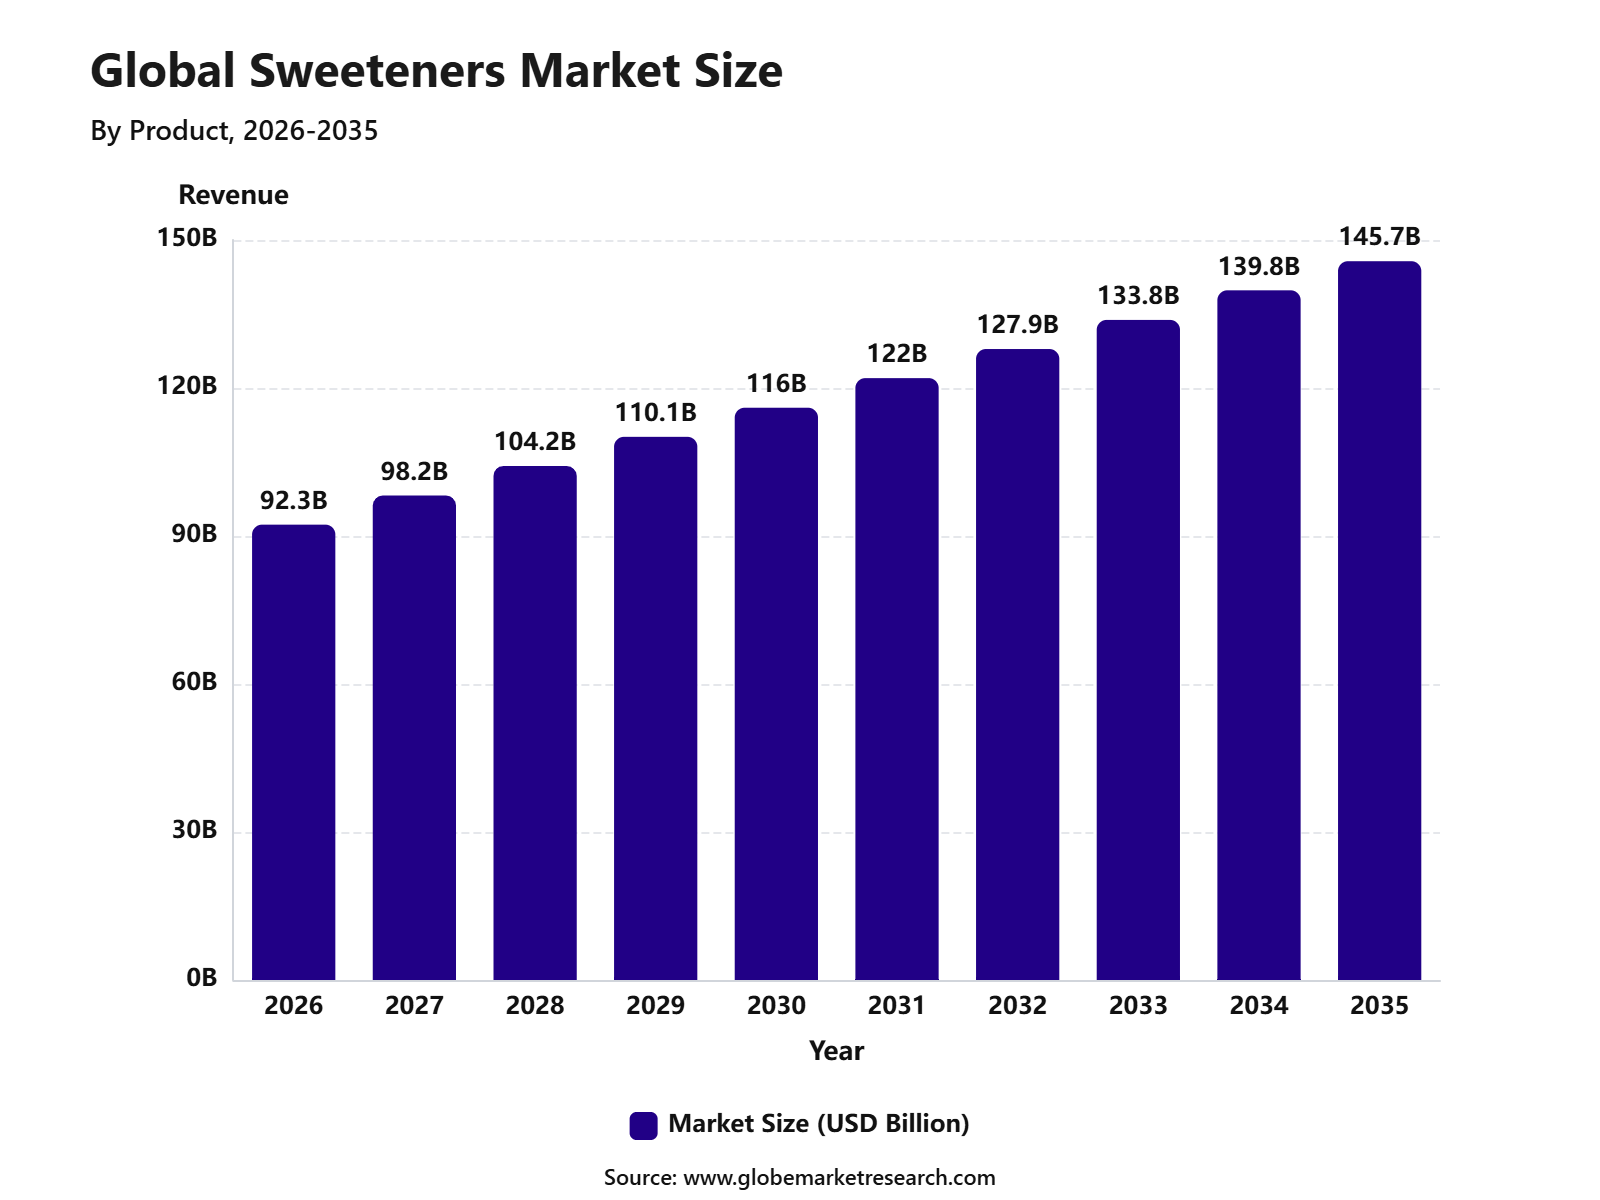 iThe graph shows projected market growth until 2035 based on CAGR analysis. Actual outcomes may vary depending on changing demand, competition, and economic factors.To gain greater insights - request a sample report PDF
Key Market Insights
Sucrose led the product segment with 80.3% share, supported by its wide availability, familiar taste, cost efficiency, and strong use across food, beverages, bakery, and confectionery products.
Solid sweeteners accounted for 75.2% share by form, driven by easier storage, longer shelf life, convenient handling, and broad use in packaged food and industrial formulations.
Bakery and confectionery held 35.3% share by application, supported by high sweetener consumption in cakes, biscuits, chocolates, candies, desserts, and other sweet baked products.
Asia Pacific led the sweeteners market with 50.6% share, valued at USD 46.7 billion, supported by large food processing capacity, high sugar consumption, expanding bakery demand, and strong confectionery production across China, India, Japan, and Southeast Asia.
Top Funding and Investment
Top Investments
In 2025, Pentasweet announced a EUR 44 million investment to establish a biotechnology-based natural sweetener production facility in Vilnius, Lithuania. The plant will use precision fermentation and advanced biotechnology to manufacture high-intensity sweetening ingredients. The project is expected to create 26 specialised biotechnology and manufacturing positions.
In 2026, STS Sugar advanced a RMB 750 million, approximately USD 106 million, functional sugar manufacturing project in Zhuhai, China. The first phase includes annual capacity for 100,000 tonnes of isomaltulose, alongside 300,000 tonnes of refined sugar and associated fermentation by-products. Trial production was scheduled for August 2026.
During its 2025 financial year, Tate & Lyle continued a capital expenditure programme of approximately GBP 100 million to GBP 120 million covering speciality food ingredient capacity, manufacturing efficiency and innovation. Its portfolio includes allulose, stevia, sucralose and sugar-reduction systems used across beverages, dairy, bakery and confectionery formulations.
In February 2025, Oobli and Ingredion formed a strategic commercialisation partnership to combine Oobli’s fermentation-produced sweet proteins with Ingredion’s stevia and formulation capabilities. The programme is designed to expand industrial access to sweetener systems that reduce added sugar while maintaining sweetness, texture and product performance.
In 2025, Mars announced plans to invest USD 2 billion in U.S. manufacturing through 2026, following approximately USD 6 billion invested during the previous five years. The programme covers confectionery, snacking and food production assets, including automation and product-formulation capabilities supporting portion control, alternative ingredients and changing sweetener requirements.
Top Funding Developments
In February 2025, Oobli secured USD 18 million in Series B1 funding from investors including Khosla Ventures, Piva Capital, Global Brain, the Norinchukin Bank and Kirin Holdings. The funding supports regulatory approvals, manufacturing scale-up and commercialisation of fermentation-derived sweet proteins intended to replace substantial amounts of added sugar.
Top Acquisitions
In June 2026, Ingredion agreed to acquire Tate & Lyle in an all-cash transaction valuing its equity at approximately GBP 2.7 billion, or around USD 3.6 billion. Ingredion will acquire Tate & Lyle’s stevia, allulose, sucralose, soluble-fibre, texturising and sugar-reduction portfolios, together with its manufacturing plants, laboratories, customer relationships and intellectual property. The combined business expects approximately USD 9.9 billion in annual revenue and USD 1.8 billion in adjusted EBITDA.
In May 2026, CVC Capital Partners agreed to acquire IFF’s Food Ingredients division for approximately USD 4.3 billion. CVC will acquire manufacturing operations and ingredient portfolios covering sweeteners, emulsifiers, stabilisers and other functional food ingredients. IFF expects about USD 3.8 billion in net cash proceeds while retaining a 10% interest in the separated business.
By Product
Sucrose accounted for 80.3% share of the Sweeteners Market. This leading position is supported by its wide use as a traditional sweetener in food, beverages, bakery, confectionery, dairy products, sauces, and packaged foods.
The segment is widely preferred because sucrose offers familiar taste, good solubility, bulk, texture, caramelization, and consistent performance in food processing. It is used not only for sweetness but also for structure, mouthfeel, browning, preservation, and fermentation support.
Demand is expected to remain strong due to its established role in everyday food and beverage production. Although low-calorie and alternative sweeteners are gaining attention, sucrose will continue to dominate because of its affordability, availability, and strong functional value across mass-market products.
By Form
Solid sweeteners accounted for 75.2% share of the Sweeteners Market. This dominance is driven by the high use of granulated sugar, powdered sugar, crystalline sweeteners, cubes, and dry sweetener blends in household, foodservice, and industrial applications.
The segment is widely preferred because solid sweeteners are easy to store, transport, measure, and blend into dry and semi-dry food formulations. They are commonly used in bakery mixes, confectionery, desserts, beverages, cereals, snacks, and packaged food production.
Demand for solid sweeteners is expected to remain strong as manufacturers require stable, shelf-friendly, and easy-to-handle ingredients. Growth will be supported by bakery, confectionery, packaged foods, and retail sugar demand across both developed and emerging markets.
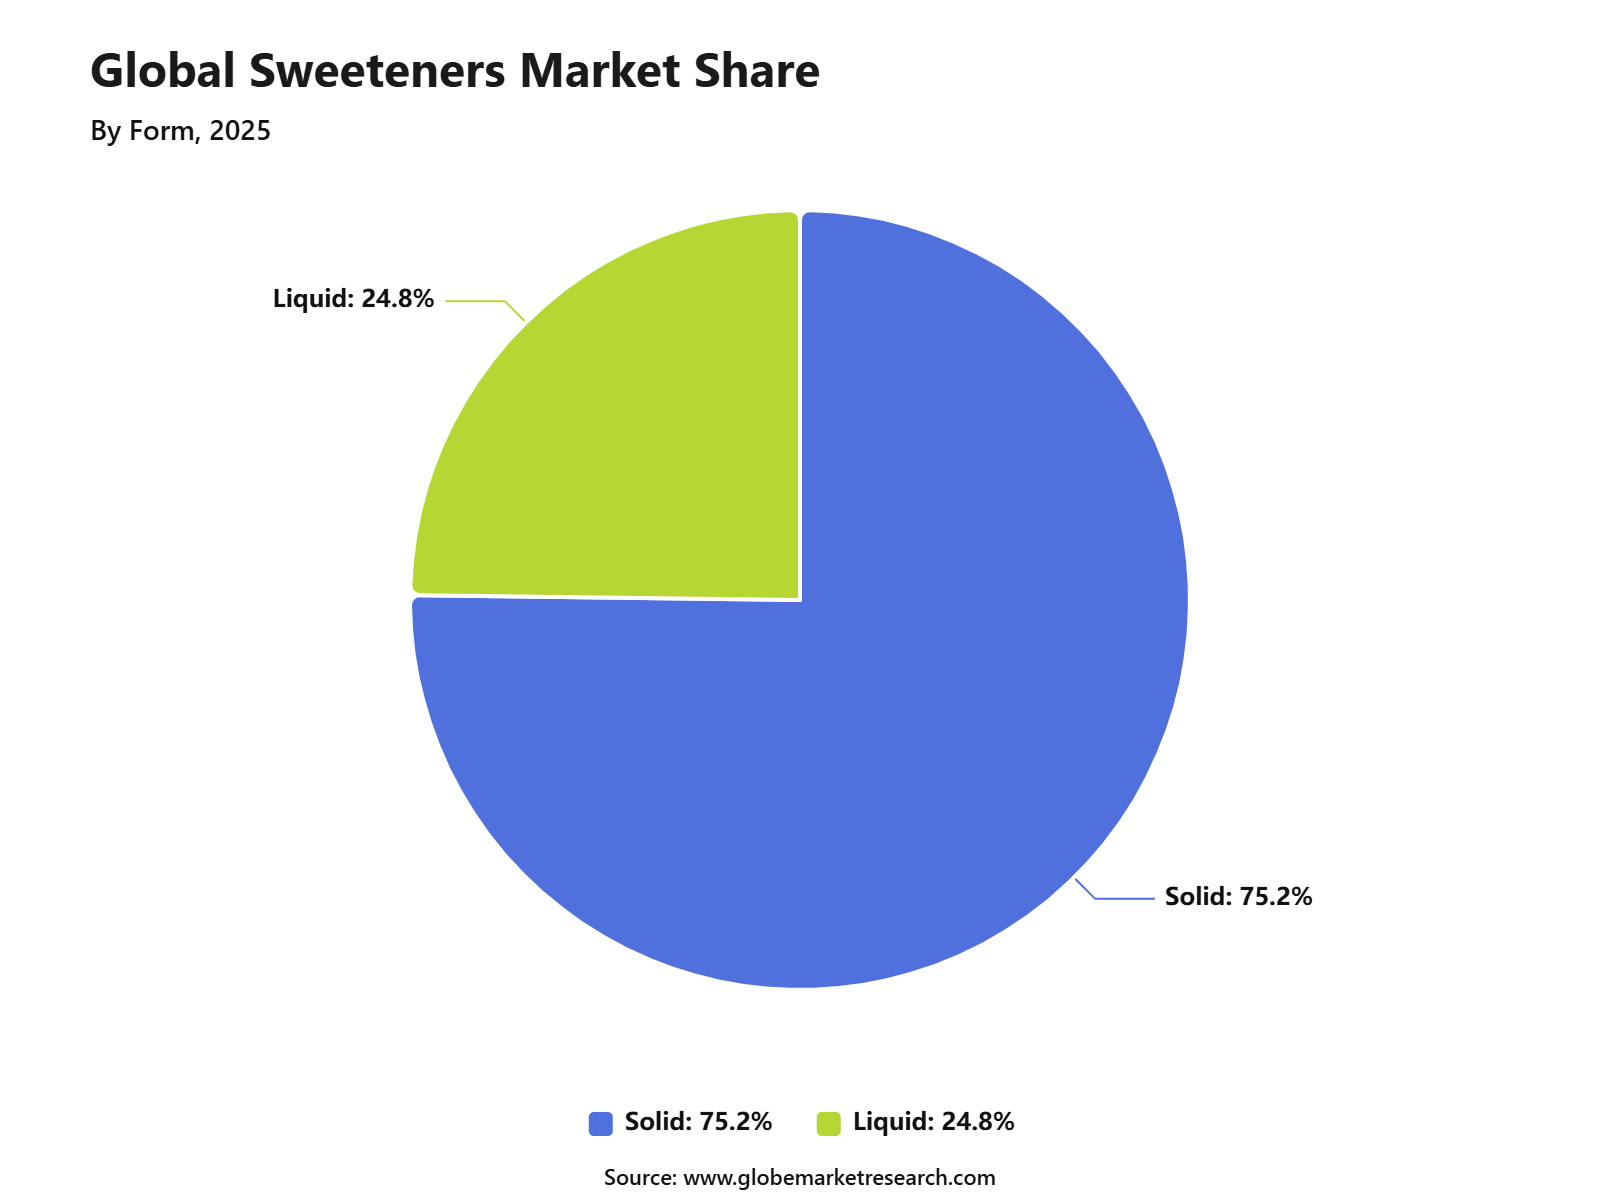 iThe graph shows projected market growth until 2035 based on CAGR analysis. Actual outcomes may vary depending on changing demand, competition, and economic factors.To gain greater insights - request a sample report PDF
By Application
Bakery and confectionery accounted for 35.3% share of the Sweeteners Market. This leading share is supported by the essential role of sweeteners in cakes, biscuits, pastries, chocolates, candies, gums, desserts, fillings, creams, and sweet baked products.
Sweeteners are used in this application not only to provide sweetness but also to support texture, volume, color, moisture retention, and shelf life. Sucrose remains especially important because it helps with browning, crystallization, aeration, and product structure in baked and confectionery items.
Demand from bakery and confectionery is expected to remain strong as packaged snacks, premium desserts, celebration foods, and convenience bakery products continue to grow. Product innovation in reduced-sugar and clean-label formats will also support wider use of blended sweetener systems.
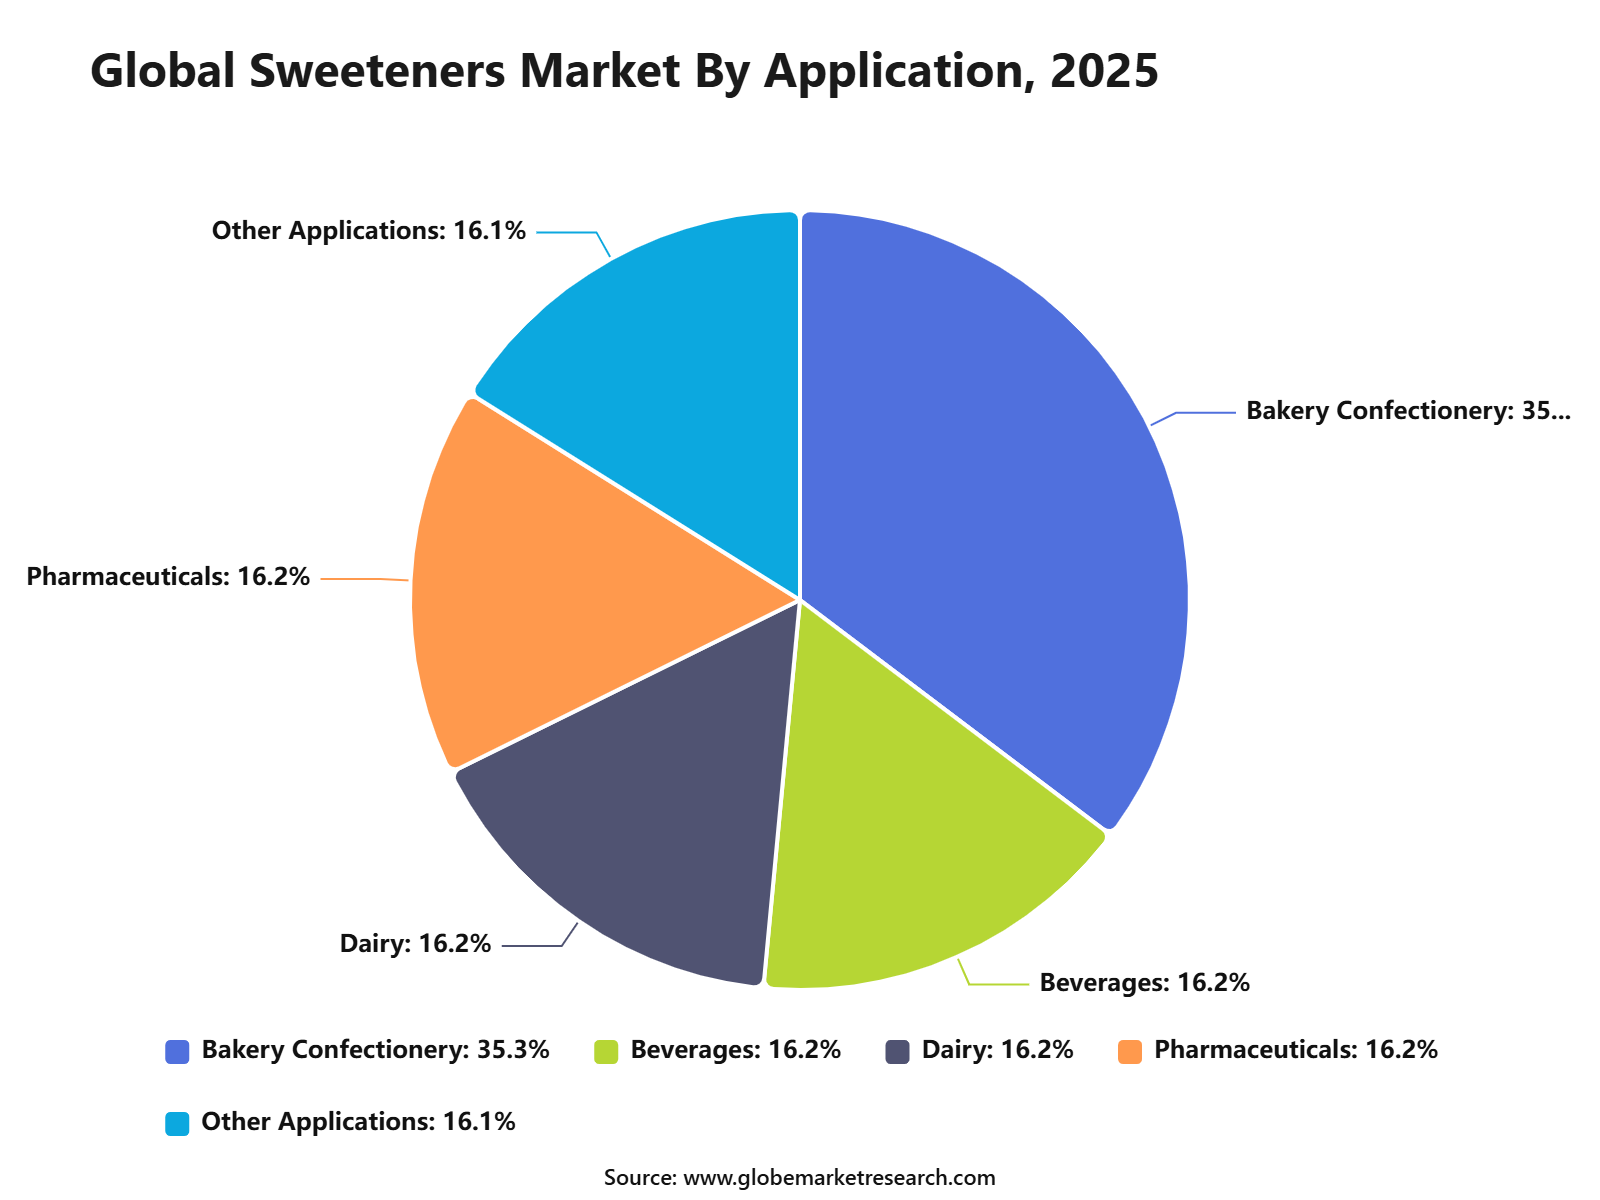 iThe graph shows projected market growth until 2035 based on CAGR analysis. Actual outcomes may vary depending on changing demand, competition, and economic factors.To gain greater insights - request a sample report PDF
By Region
Asia Pacific accounted for 50.6% share of the Sweeteners Market, reaching USD 46.7 billion. The region’s leadership is supported by large population size, high sugar consumption, strong food processing activity, and expanding demand from beverages, bakery, confectionery, dairy, and packaged foods.
China, India, Indonesia, Thailand, Japan, South Korea, and Vietnam are key contributors to regional demand. The region benefits from strong sugar production, growing urban food consumption, rising disposable income, and high use of sweeteners in traditional and modern food products.
Asia Pacific is expected to maintain its leading position as food and beverage manufacturing continues to expand. Demand will remain supported by sucrose, solid sweetener formats, bakery and confectionery applications, and increasing consumption of packaged and convenience foods across the region.
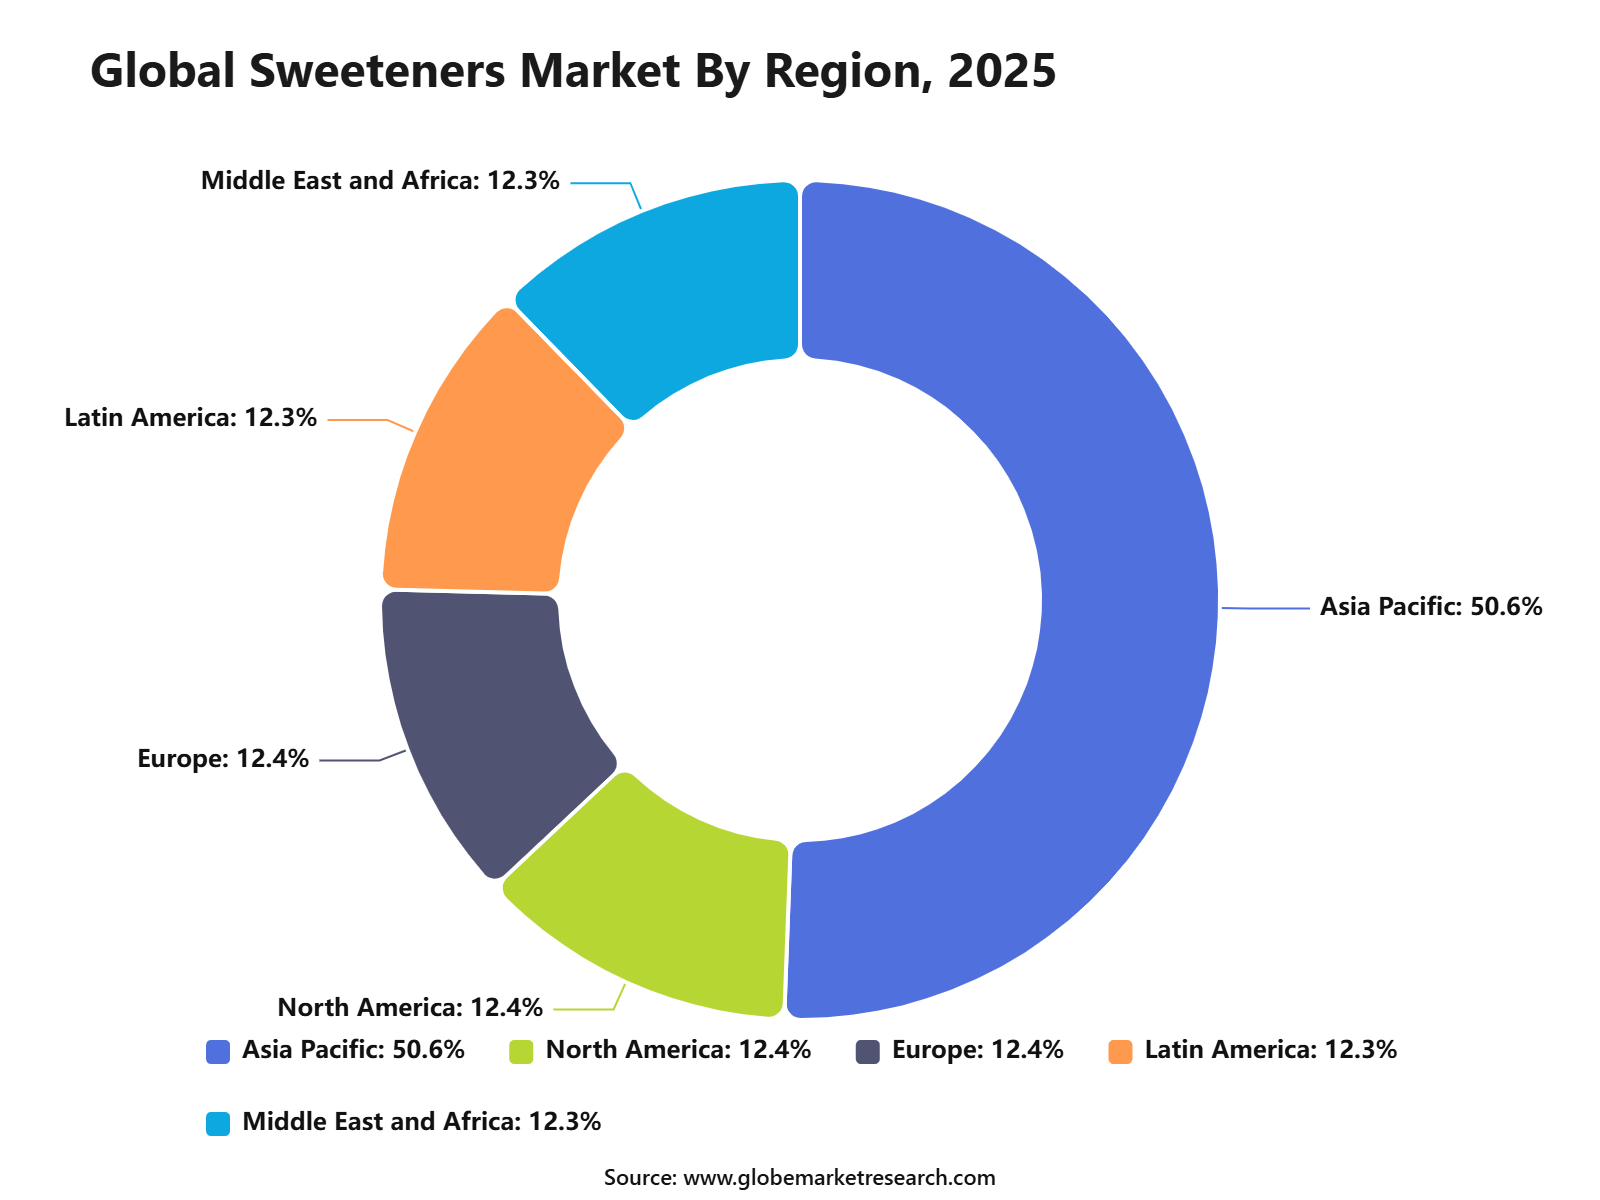 iThe graph shows projected market growth until 2035 based on CAGR analysis. Actual outcomes may vary depending on changing demand, competition, and economic factors.To gain greater insights - request a sample report PDF
Regional Impact Analysis
Asia Pacific leads the Sweeteners Market with 50.6% share in 2026, valued at around USD 46.7 billion, supported by large sugar consumption, strong food processing, rising bakery and confectionery demand, and expanding beverage production. China and India remain major contributors due to large populations and strong packaged food growth.
North America remains important because of sugar reduction, diet beverages, sports nutrition, and natural sweetener innovation. Europe supports steady demand through clean-label reformulation, regulatory pressure on sugar intake, and growing interest in low-calorie food and beverage products.
Impact Factor | Estimated CAGR Impact | Regional Relevance | Market Impact |
|---|---|---|---|
Asia Pacific market leadership | +1.7% | Asia Pacific, 50.6% share in 2026 | Leads global value demand. |
China food and beverage production | +1.3% | China | Drives large-volume sweetener use. |
India bakery and confectionery growth | +1.1% | India | Supports future consumption growth. |
North America sugar reduction demand | +0.9% | U.S. and Canada | Adds alternative sweetener opportunity. |
Europe clean-label reformulation | +0.7% | Germany, UK, France, Italy | Supports natural sweetener adoption. |
Go-To-Market and Sales Economics
Sweetener suppliers should organize sales around beverages, bakery, dairy, confectionery, tabletop products, and reduced-sugar foods. Value-based selling should explain sweetness intensity, bulking, mouthfeel, stability, and reformulation cost. The FDA notes that steviol glycosides can be 200 to 400 times sweeter than table sugar, allowing substantially lower inclusion rates in suitable formulations.
Large food and beverage manufacturers are best served through direct technical accounts, while distributors can cover smaller regional processors. Blended systems combining sugar, polyols, stevia, sucralose, or other high-intensity ingredients can improve taste and cost control. The FDA currently recognizes six high-intensity sweeteners as approved food additives under specified conditions in the United States.
Pricing must account for commodity exposure, application support, regulatory documentation, and the customer’s targeted sugar reduction. USDA forecast the 2025/26 United States sugar supply at 14.269 million short tons, raw value, in April 2026. Suppliers should use indexed pricing, multi-origin sourcing, and formulation flexibility to protect margins during shifts in production, trade, and inventories.
Risk Factors & Market Barriers
Government action against excessive sugar consumption is becoming a stronger commercial barrier for conventional sugar suppliers and a demand driver for alternatives. WHO reported in January 2026 that at least 116 countries taxed sugary drinks. Product portfolios must therefore support lower-sugar recipes, tax-threshold compliance, clear labeling, and acceptable taste at commercially workable dosage levels.
Regulatory acceptance differs by ingredient, manufacturing process, purity standard, and country. The FDA’s 2026 Human Foods Program includes an added-sugar reduction strategy and an assessment of low-calorie, non-nutritive, and blood-glucose-neutral alternatives. Suppliers will need stronger safety files, transparent ingredient descriptions, and substantiated claims as scrutiny of sweetener labeling and consumer communication increases.
Supply volatility remains important because sugar production is influenced by weather, planted area, energy costs, trade controls, and ethanol economics. USDA projected that European Union sugar production would decline again in 2026/27 as low prices reduced beet sowing. Buyers should qualify alternative origins and maintain contingency formulas that can absorb changes in sweetness cost and availability.
Revenue Potential Analysis
Revenue Landscape Across
North America offers revenue across reformulated beverages, snacks, dairy products, and packaged foods. The FDA plans to develop an added-sugar reduction strategy during 2026, including a possible definition for a low-added-sugar claim. This direction can support demand for high-intensity sweeteners, fibers, polyols, and blended solutions that preserve taste while lowering declared added sugar.
Europe presents opportunities for reduced-sugar formulations, but customer acquisition requires regulatory expertise and reliable supply. Lithuania introduced an excise tax on sugar-sweetened beverages from January 1, 2026, covering drinks with added sugar or sweeteners. Suppliers should evaluate each national tax design carefully because treatment may differ for sugar, caloric alternatives, and non-nutritive ingredients.
Asia, Latin America, and other sugar-producing regions remain important for bulk sugar, specialty syrups, and alternative sweeteners. Revenue can be diversified through food-service packs, industrial contracts, and application-specific blends. WHO found that 97% of countries tax energy drinks, demonstrating that beverage reformulation is a global opportunity rather than a requirement limited to mature Western markets.
Financial Impact
Sweetener selection can materially affect ingredient cost because high-intensity products require much smaller quantities than sugar. Steviol glycosides are reported by the FDA to be 200 to 400 times sweeter than table sugar. However, financial evaluation must include flavor masking, bulking agents, processing changes, testing, and possible consumer acceptance costs rather than dosage savings alone.
Taxes can change product economics by raising retail prices, encouraging reformulation, and shifting volume toward lower-sugar options. WHO reported that sugary drinks became more affordable in 62 countries between 2022 and 2024, despite wider taxation. Manufacturers should model tax exposure by sugar concentration, package size, country, and channel before finalizing recipes or investment decisions.
Supply planning also influences working capital and gross margin. USDA estimated the 2025/26 United States sugar supply at 14.269 million short tons in April 2026, while European production was expected to weaken in 2026/27. Contract coverage, inventory timing, alternative origins, and flexible sweetener blends can reduce the financial effect of regional shortages or price corrections.
Sugar Reduction Reshapes Sweetener Demand
Sugar reduction is the most important factor influencing the Sweeteners Market because nutrition guidance is changing product formulation priorities. The FDA identifies 50 grams as the Daily Value for added sugars based on a 2,000-calorie diet, while added sugar should remain below 10% of total daily calories. These limits are pushing manufacturers toward lower-sugar recipes, high-intensity sweeteners and blended solutions.
Traditional sugar nevertheless remains a major commercial ingredient. USDA projected U.S. sugar supply at approximately 14.27 million short tons and human-consumption deliveries at about 12.39 million short tons. Globally, USDA estimated sugar production at 186.1 million metric tons for the 2025/26 marketing period, confirming that reformulation is creating diversification rather than immediately replacing conventional sugar.
Important Data | Numeric Value |
|---|---|
Global Sugar Output | 186.1 million tons |
U.S. Sugar Supply | 14.27 million tons |
Human Consumption | 12.39 million tons |
Added Sugar Limit | 50 grams daily |
Calorie Intake Limit | Below 10% |
Target Stock Ratio | 13.5% |
Mexico Sugar Imports | 1.35 million tons |
Drivers Impact Analysis
The Sweeteners Market is driven by rising demand from bakery, confectionery, beverages, dairy, processed foods, sauces, snacks, and ready-to-eat products. Sweeteners are widely used to improve taste, texture, mouthfeel, product stability, and consumer acceptance across daily food and beverage categories.
Asia Pacific leads the market due to large sugar consumption, strong food processing activity, expanding bakery and confectionery production, and rising demand from China, India, Indonesia, Japan, and Southeast Asia. The region’s large consumer base supports both sugar-based and alternative sweetener demand.
Impact Factor | Estimated CAGR Impact | Regional Relevance | Market Impact |
|---|---|---|---|
Growth in bakery and confectionery demand | +1.6% | Asia Pacific, Europe, North America | Drives high-volume sweetener use. |
Rising beverage formulation demand | +1.3% | China, India, Japan, U.S. | Supports sugar and low-calorie sweeteners. |
Expansion of processed food production | +1.1% | Asia Pacific and emerging markets | Adds stable ingredient demand. |
Demand for low-calorie products | +0.9% | North America, Europe, urban Asia | Supports alternative sweeteners. |
Growth in dairy and dessert applications | +0.7% | Global food manufacturers | Builds steady formulation demand. |
Restraints Impact Analysis
The market faces restraints from health concerns linked to high sugar consumption, sugar taxes, clean-label expectations, and regulatory scrutiny around artificial sweeteners. Consumers are becoming more aware of calorie intake, obesity risk, diabetes concerns, and ingredient transparency.
Another restraint is formulation complexity. Reducing sugar without affecting taste, texture, bulk, browning, crystallization, and shelf life is difficult, especially in bakery, confectionery, beverages, and dairy products.
Impact Factor | Estimated CAGR Impact | Regional Relevance | Market Impact |
|---|---|---|---|
Health concerns over sugar intake | -0.8% | Global consumer markets | Limits high-sugar product growth. |
Sugar tax and policy pressure | -0.6% | Beverages and packaged foods | Encourages reformulation. |
Artificial sweetener perception issues | -0.5% | North America and Europe | Affects consumer trust. |
Reformulation cost and complexity | -0.4% | Food and beverage producers | Slows product development. |
Raw material price volatility | -0.3% | Sugar and corn-based sweeteners | Pressures margins. |
Opportunities Impact Analysis
Opportunities are strong in low-calorie sweeteners, natural sweeteners, stevia, monk fruit, polyols, allulose, sugar reduction blends, clean-label sweetening systems, and diabetic-friendly food products. These areas benefit from health-conscious consumers and reformulation demand.
Higher-value opportunities are emerging in beverage sugar reduction, protein snacks, functional foods, plant-based dairy, children’s nutrition, and premium confectionery. Suppliers that combine taste performance, cost efficiency, and regulatory support can capture stronger demand.
Impact Factor | Estimated CAGR Impact | Regional Relevance | Market Impact |
|---|---|---|---|
Natural sweetener adoption | +1.5% | Asia Pacific, Europe, North America | Supports clean-label growth. |
Low-calorie sweetener demand | +1.3% | Beverages and wellness foods | Builds reformulation value. |
Sugar reduction blends | +1.1% | Packaged food manufacturers | Improves taste and functionality. |
Functional and diabetic-friendly foods | +0.9% | Health-focused markets | Adds premium product demand. |
Plant-based food and beverage growth | +0.7% | Urban consumer markets | Creates new formulation uses. |
Challenges Impact Analysis
The main challenge is matching sweetness with full product performance. Sugar adds bulk, texture, preservation, browning, fermentation support, and mouthfeel, so replacing it requires careful ingredient balancing.
Another challenge is managing consumer trust. Some consumers prefer natural sweeteners, while others question artificial or high-intensity sweeteners, making product positioning and ingredient communication important.
Impact Factor | Estimated CAGR Impact | Regional Relevance | Market Impact |
|---|---|---|---|
Taste matching difficulty | -0.7% | Beverages, bakery, confectionery | Affects product acceptance. |
Texture and bulk replacement issues | -0.6% | Bakery and dairy applications | Increases formulation complexity. |
Consumer confusion over sweeteners | -0.5% | Global packaged food markets | Affects purchase decisions. |
Regulatory variation across regions | -0.4% | Export-oriented brands | Adds compliance burden. |
Supply consistency for natural sweeteners | -0.3% | Stevia, monk fruit, plant-based inputs | Impacts pricing and availability. |
Segment Covered in the Report
By Product
Sucrose
High-Fructose Corn Syrup
Glucose Syrup
High-Intensity Sweeteners
Other Products
By Form
Solid
Liquid
By Application
Beverages
Dairy
Pharmaceuticals
Other Applications
By Region
North America
Europe
Asia Pacific
Latin America
Middle East and Africa
Market Trend Analysis
The market trend is moving toward sugar reduction, natural sweeteners, high-intensity sweeteners, blended sweetening systems, clean-label positioning, and better-tasting low-calorie products. Food and beverage companies are reformulating products to meet health expectations without losing taste appeal.
Asia Pacific remains the largest value region because of its strong sugar consumption, fast-growing packaged food sector, and rising demand for beverages, confectionery, bakery, and dairy products. North America and Europe support innovation in low-calorie and natural sweetener applications.
Impact Factor | Estimated CAGR Impact | Regional Relevance | Market Impact |
|---|---|---|---|
Sugar reduction trend strengthens | +1.4% | Beverages, snacks, dairy, bakery | Drives alternative sweetener use. |
Natural sweeteners gain preference | +1.2% | North America, Europe, Asia Pacific | Supports clean-label positioning. |
Blended sweetener systems expand | +1.0% | Food and beverage manufacturers | Improves taste performance. |
High-intensity sweetener use rises | +0.8% | Beverage and diet product markets | Reduces calorie content. |
Premium confectionery innovation grows | +0.6% | Urban and developed markets | Adds value-led sweetener demand. |
Investor Type Impact Matrix
Investors should focus on companies with strong ingredient sourcing, formulation expertise, regulatory knowledge, taste performance, and application support. Sweetener suppliers that can help food brands reduce sugar without compromising taste or texture are better positioned for long-term growth.
Strategic investors can also target natural sweetener producers, sugar processing companies, specialty ingredient suppliers, fermentation technology firms, beverage formulation partners, and clean-label ingredient platforms. Companies with scalable supply and strong customer application support can capture higher value.
Investor Type | Estimated CAGR Impact | Regional Relevance | Market Impact |
|---|---|---|---|
Natural Sweetener Producers | +1.3% | Asia Pacific, Europe, North America | Expands clean-label supply. |
Sugar Processing Companies | +1.1% | High-consumption food markets | Supports core volume demand. |
Specialty Ingredient Suppliers | +0.9% | Food and beverage manufacturers | Adds formulation value. |
Fermentation Technology Firms | +0.7% | Novel sweetener markets | Supports innovation pipeline. |
Strategic Food Ingredient Investors | +0.5% | Global packaged food markets | Funds scale-up and portfolio growth. |
Recent Developments
June 2026: Ingredion announced a recommended all-cash offer to acquire Tate & Lyle, valuing the business at approximately GBP 3.7 billion and combining complementary sweetening, mouthfeel, fortification, and formulation capabilities.
May 2026: Tate & Lyle expanded its BioHarvest collaboration to develop multiple plant-based sweetener molecules, broadening scalable solutions tailored to different food and beverage categories, taste requirements, costs, and labelling needs.
January 2026: ADM announced a USD 26 million Erlanger facility expansion, adding automated handling and digital capabilities to support sugar reduction, natural ingredient replacement, flavour modulation, and customer-led food reformulation.
Competitive Landscape
The market is characterized by intense competition among established players and emerging companies. Strategic partnerships, mergers and acquisitions, and product innovation are key strategies employed by market participants.
Key Market Players
Cargill, Incorporated
Archer Daniels Midland Company
Tate & Lyle PLC
Ingredion Incorporated
Roquette Frères
Ajinomoto Co., Inc.
Tereos Group
Südzucker AG
Associated British Foods plc
Mitsui DM Sugar Co., Ltd.
Other Key Players
Research Methodology
This market study is prepared using a combination of primary and secondary research. Primary research includes discussions with manufacturers, suppliers, distributors, consultants, industry experts, and end users. Secondary research covers company reports, government databases, trade associations, technical publications, regulatory sources, and trusted industry documents. The collected information is used to assess market demand, pricing trends, technology adoption, competitive activity, and regional performance.
AI language models are not used as primary data sources, and publicly available AI-generated content is not treated as market evidence. Computational tools may be used to support data processing, translation, data classification, and pattern identification. However, every published assessment is supported by verified sources, human review, and primary market discussions.
Market estimates are developed through top-down and bottom-up approaches and validated using data triangulation. Revenue, production, shipment, pricing, and application-level data are compared across multiple sources. Forecasts consider economic conditions, regulatory changes, investment activity, innovation, supply chain developments, and industry risks. All findings are reviewed through source verification and internal quality checks before publication.
Part I
Source Management & Input Data Standards
Who provides data, how sources are qualified, and what types of evidence are admissible.
Part II
Research Scope & Market Coverage
How we define the markets we assess and the parameters that govern each product.
Part III
Data Collection, Verification & Submission
The mechanics of gathering, cross-checking, and hierarchically ranking evidence.
Part IV
Assessment Determination & Quality Controls
How raw data becomes a published assessment — normalisation, expert judgement, and outlier exclusion.
Part V
Publication, Corrections & Revision
Our publication schedule, corrections policy, and methodology review cycle.
Part VI
Independence, Ethics & Complaints
Conflict-of-interest policies, editorial independence, and how clients raise concerns.
Google · Preferred Sources
Don't miss the latest market research insights and industry updates on Google.
Add Globe Market Research as a preferred source in the Google app to see our reports, analysis, and market stories in your news suggestions.
Meet the Team
This report was prepared by our expert analysts with deep industry knowledge and research experience.
Pratiksha K. is a Senior Research Analyst with more than five years of experience in market research, industry analysis, competitive intelligence, and business strategy. She has contributed to detailed market reports, customized research studies, company profiling, market sizing, trend analysis, and strategic consulting projects for clients across different regions. Her industry expertise covers Chemical and Material, Consumer Goods, Food & Beverages and Energy & Power. She closely evaluates changing customer requirements, technology developments, regulatory conditions, supply chain structures, investment activity, and competitive strategies to provide clear and practical market insights.
Sayali brings more than 7 years of experience to Globe Market Research, supporting the accuracy, clarity, and relevance of research content across multiple industries. She reviews market data, segment analysis, competitive insights, and industry trends to ensure each report meets strong quality standards and provides practical value to business decision-makers. Her expertise spans healthcare, information technology, consumer goods, and diverse cross-industry domains. With a strong focus on data reliability, structured analysis, and clear presentation, Sayali helps ensure that each research output delivers well-reviewed insights for clients, investors, consultants, and industry stakeholders.
Frequently Asked Questions
Related Reports
More in Food and Beverages
Frozen Meat and Seafood Market to Hit USD 181.1 Billion by 2035
Frozen Meat and Seafood Market Size, Share, Analysis By Product (Frozen Meat, Frozen Seafood), By Seafood Form (Whole, Fillets, Processed Seafood, Other Forms), By Seafood End Use (Retail and Household, Foodservice, Industrial), By Regional Insights, Business plan and Project Report, Investment Opportunities, Profitability, Industry Trends, Leading Companies and Growth Forecasts by 2026-2035
Frozen Meals Market to Hit USD 74.2 Billion by 2035
Frozen Meals Market Size, Share, Analysis By Product (Frozen, Chilled, Canned, Shelf-Stable), By Meal Type (Vegetarian, Non-Vegetarian, Vegan), By Distribution Channel (Supermarkets and Hypermarkets, Online Retail, Convenience Stores, Specialty Stores), By Regional Insights, Business plan and Project Report, Investment Opportunities, Profitability, Industry Trends, Leading Companies and Growth Forecasts by 2026-2035
Food Colorants Market to Hit USD 8.6 Billion by 2035
Food Colorants Market Size, Share, Analysis By Type (Natural, Synthetic, Nature-Identical), By Form (Powder, Liquid, Gel), By Application (Beverages, Bakery and Confectionery, Dairy, Meat Products, Snacks, Other Applications), By Regional Insights, Business plan and Project Report, Investment Opportunities, Profitability, Industry Trends, Leading Companies and Growth Forecasts by 2026-2035
Food Enzymes Market to Hit USD 7.5 Billion by 2035
Food Enzymes Market Size, Share, Analysis By Type (Carbohydrases, Proteases, Lipases, Other Enzymes), By Source (Microbial, Plant, Animal), By Application (Dairy Processing, Bakery, Beverages, Processed Foods, Animal Feed), By Regional Insights, Business plan and Project Report, Investment Opportunities, Profitability, Industry Trends, Leading Companies and Growth Forecasts by 2026-2035