

Revenue, 2026
USD 15.8 Bn
Forecast, 2035
USD 35.2 Bn
CAGR, 2026-2035
9.3%
Report Coverage
Global
Market Size and Forecast
The Global Cereal Bars Market was worth USD 15.8 billion in 2026 and is expected to reach USD 35.2 billion by 2035, growing at a CAGR of 9.3% from 2026 to 2035. North America held the largest regional share of 50.3% in 2026, valued at around USD 7.9 billion, supported by strong demand for convenient breakfast options, healthy snacks, protein-rich bars, and on-the-go nutrition products.
The Cereal Bars Market includes snack bars made from oats, rice, wheat, corn, granola, nuts, seeds, dried fruits, honey, chocolate, and fortified ingredients. These products are widely consumed as breakfast replacements, school snacks, fitness snacks, travel food, and workplace convenience foods. The market is closely linked with busy lifestyles, health-focused eating habits, and rising demand for portion-controlled packaged foods.
Market growth is being supported by consumers looking for quick, nutritious, and easy-to-carry food options. Demand is increasing for cereal bars with high fiber, low sugar, plant-based ingredients, added protein, clean-label claims, and functional benefits such as energy support or digestive health. Brands are also expanding flavor choices and packaging formats to attract children, athletes, working professionals, and health-conscious consumers.
Key Parameter | Report Details |
|---|---|
Market Revenue, 2026 | USD 15.8 Billion |
Projected Revenue, 2035 | USD 35.2 Billion |
CAGR (2026-2035) | 9.3% |
Largest Region | North America (50.3%, USD 7.9 Bn) |
Fastest Growing Region | Asia Pacific |
Market Concentration | Medium |
Base Year | 2025 |
Forecast Period | 2026-2035 |
North America is expected to remain a leading market due to strong retail penetration, established snack culture, and high acceptance of meal-replacement and functional nutrition products. Supermarkets, convenience stores, online platforms, gyms, and specialty health stores continue to support product availability. Long-term growth will depend on better ingredient quality, transparent labeling, affordable pricing, and innovation in healthier cereal bar formulations.
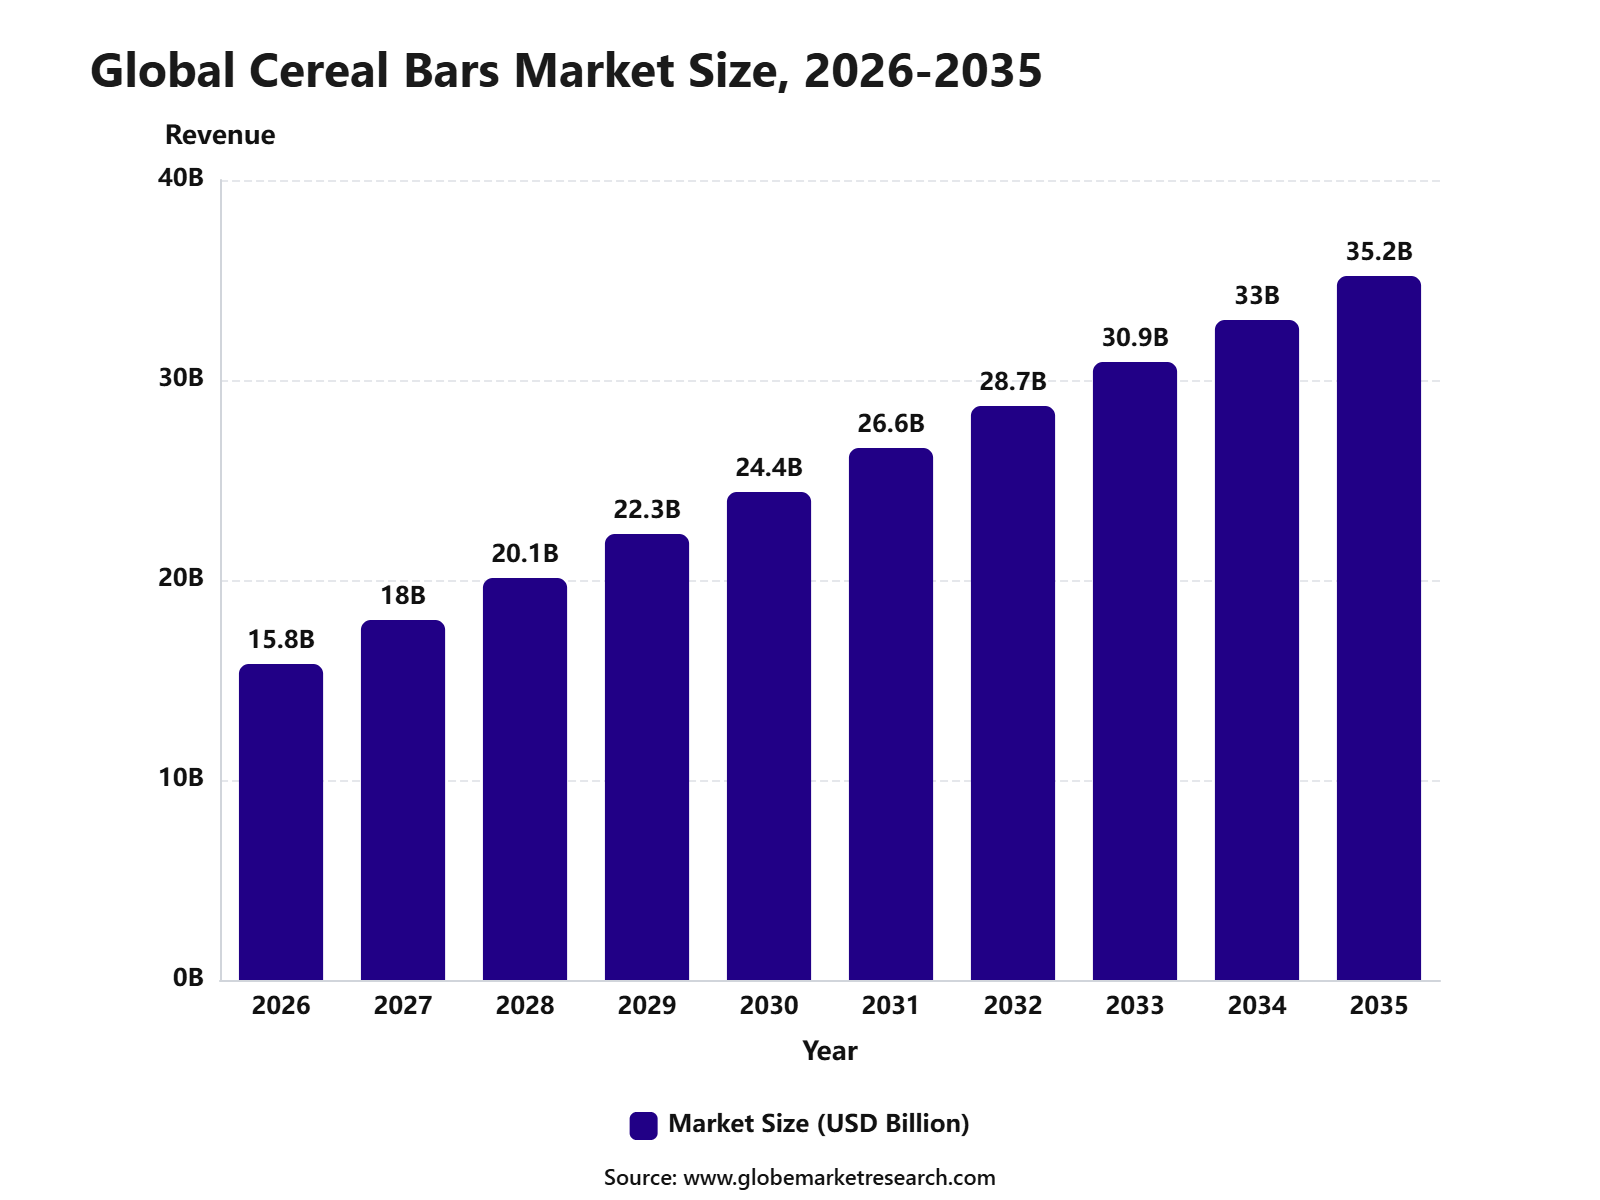 iThe graph shows projected market growth until 2035 based on CAGR analysis. Actual outcomes may vary depending on changing demand, competition, and economic factors.To gain greater insights - request a sample report PDF
Key Market Insights
Energy and nutrition bars led the product type segment with 49.6% share, supported by strong demand for convenient snacks that offer quick energy, protein, fiber, and on-the-go nutrition.
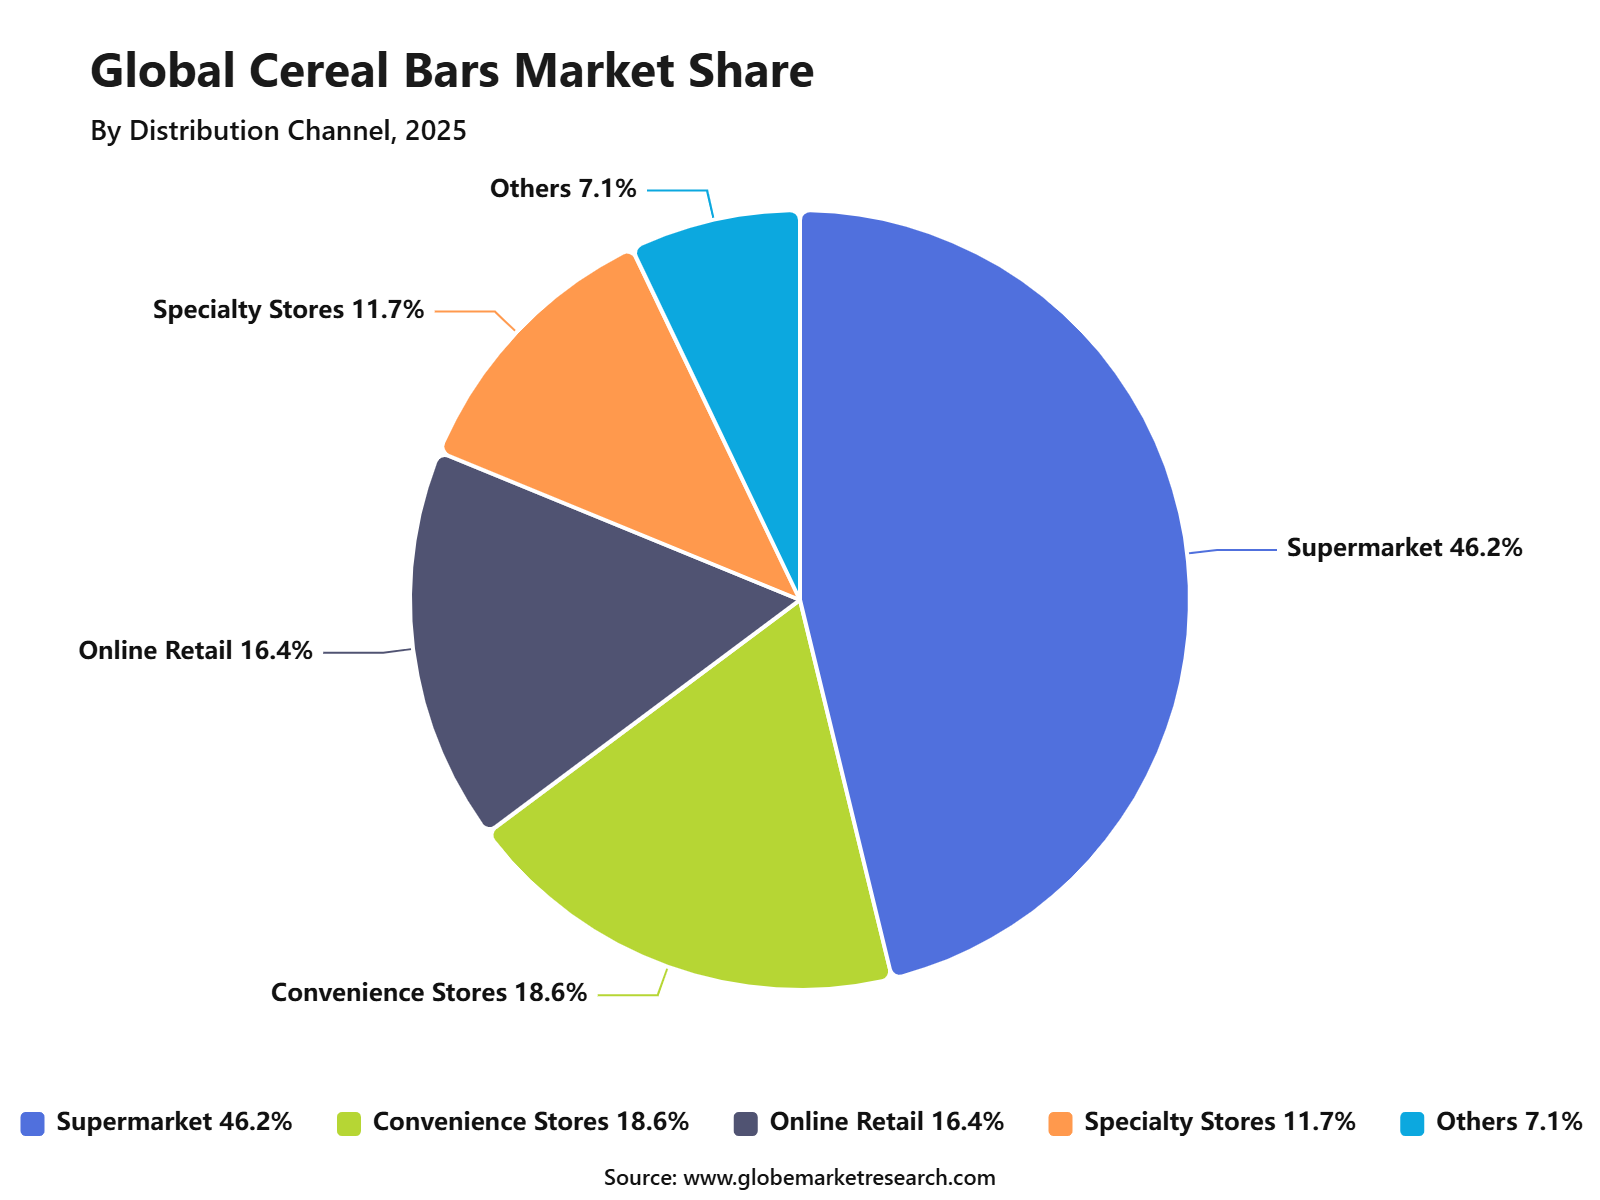
Supermarkets and hypermarkets accounted for 46.2% share by distribution channel, driven by wide product availability, strong shelf visibility, promotional pricing, and regular household grocery purchases.
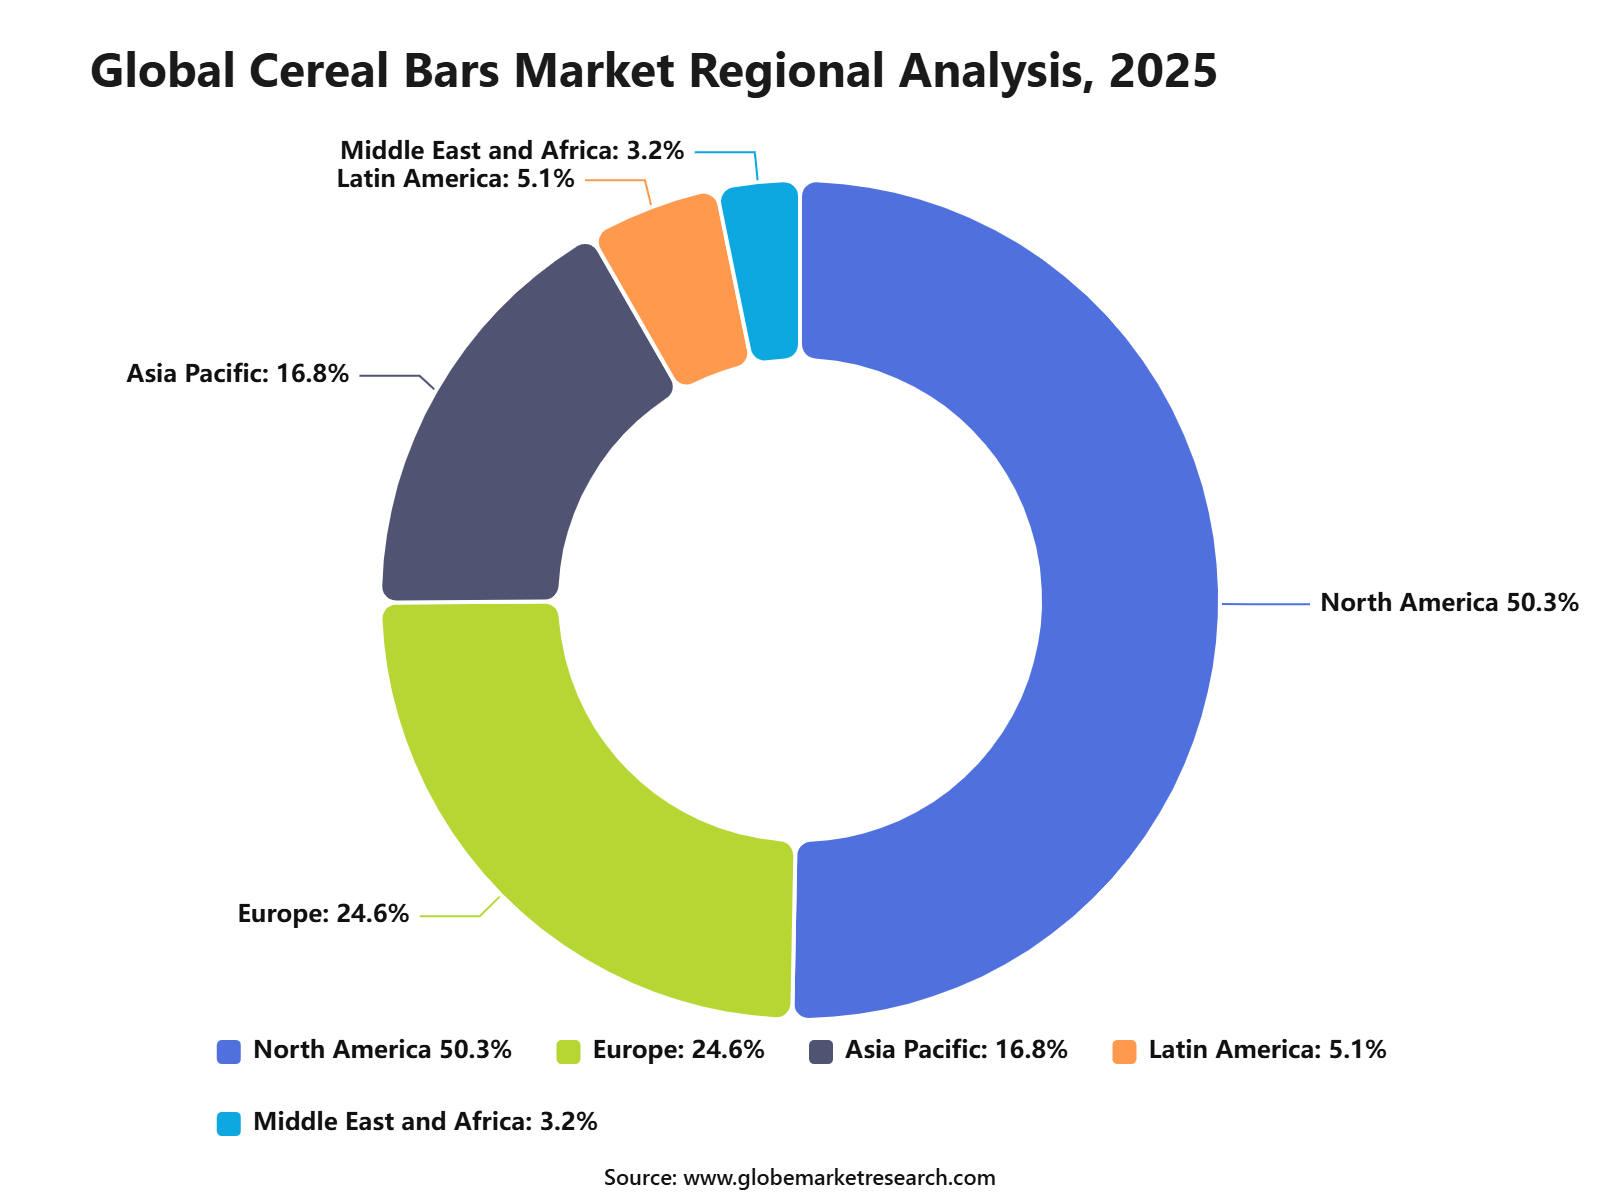
North America led the cereal bars market with 50.3% share, valued at USD 7.9 billion, supported by high snack consumption, strong health and wellness trends, mature retail networks, and growing demand for convenient nutrition products.
Top Funding and Investment
Top Investments
Mars opened a USD 240 million Nature’s Bakery manufacturing facility in Salt Lake City, Utah. The site covers more than 339,000 square feet, is expected to create over 230 jobs, and can manufacture more than one billion snack bars annually. The facility expands production of whole-wheat fig bars, oatmeal crumble bars, and other baked nutrition bars.
Kellanova advanced a GBP 75 million modernization program at its Wrexham cereal facility. The investment will add 130 jobs and more than double cereal production capacity to approximately 1.5 million boxes per day. During August 2025, Kellogg’s also introduced Oaties cereal bars containing 55% wholegrain oats and high-protein bars containing 8 grams of protein. A separate investment allocation for the bar products was not disclosed.
BioTechUSA announced the largest investment program in its history, valued at approximately EUR 22 million. Its completed first phase represented EUR 13.5 million and included a multilayer protein-bar production line. The expansion tripled annual production capacity to 75 million bars and enabled the company to manufacture additional premium bar formats.
Healthy Bars received approval for a BGN 15.75 million investment in a proprietary protein-bar production facility in Sofia. The project includes high-technology machinery, automated manufacturing processes, and more than 45 new jobs. The expansion is expected to triple the company’s production capacity, with the new facility designed to manufacture more than 500 million bars annually.
Newon Food invested EUR 3.5 million in its Lithuanian protein and nutrition bar facility, increasing total capacity to 50 million bars per year. The new line supports softer textures, aerated layers, no-added-sugar fillings, and protein-fortified toppings. The expansion will strengthen contract manufacturing services for food brands across Europe and the Middle East.
Top Funding Transactions
David Protein completed a USD 75 million Series A round led by Greenoaks, with participation from Valor Equity Partners. The company’s flagship bar contains 28 grams of protein, zero sugar, and 150 calories. Funding was allocated to manufacturing expansion, product development, and inventory growth after the brand entered more than 3,000 U.S. retail locations.
The Whole Truth raised approximately USD 51 million through primary and secondary Series D financing led by Sofina and Sauce.vc. Peak XV Partners, Rainmatter Health, and AYRA Ventures also participated. The company, which produces protein bars and other clean-label foods, will use the capital to expand in-house manufacturing, finance working capital, and prepare its systems for a potential public listing.
Stars + Honey secured a USD 24 million growth equity investment from VMG Partners. The funding will support national retail expansion, product development, and a new 60,000-square-foot manufacturing facility. The collagen protein-bar company recorded 300% annual growth and expects to generate approximately USD 50 million in revenue during 2026.
Top Acquisitions
ETi Gıda, United States, February 2026: Acquisition of TRUBAR for USD 173 Million
ETi Gıda completed the acquisition of 100% of TRUBAR for USD 173 million in cash, with no earn-out arrangement. ETi acquired full ownership of the TRUBAR brand, its clean-label protein-bar portfolio, commercial partnerships, employees, and North American operating platform.
TRUBAR was available in more than 21,000 retail locations and generated nearly USD 100 million in gross revenue during 2025. Its founder, management team, and employees remained with the business following the acquisition.
Ferrero Group, United States, 2025: Acquisition of Power Crunch
Ferrero completed the acquisition of Power Crunch from Bio-Nutritional Research Group, expanding its presence in high-protein and better-for-you snacks. The acquired portfolio includes Power Crunch wafer protein bars, high-protein crisps, brand operations, customer relationships, and product-development capabilities.
Ferrero also took control of Power Crunch’s office in Irvine, California, while approximately 50 employees joined Ferrero North America.
By Product Type
Energy and nutrition bars accounted for 49.6% share of the Cereal Bars Market. This leading position is supported by rising consumer demand for convenient snack products that provide quick energy, balanced nutrition, and easy consumption during busy routines.
The segment is widely preferred by students, working professionals, athletes, travelers, and health-focused consumers. Energy and nutrition bars are commonly positioned with oats, grains, nuts, seeds, protein, fiber, vitamins, minerals, and natural sweeteners to support better snacking choices.
Demand is expected to remain strong as consumers continue to replace traditional snacks with healthier and functional alternatives. Product innovation in high-protein, low-sugar, gluten-free, plant-based, and clean-label bars will continue to support segment growth.
By Distribution Channel
Supermarkets and hypermarkets accounted for 46.2% share of the Cereal Bars Market. This dominance is supported by strong shelf visibility, wide product variety, promotional offers, and easy access to multiple brands under one retail format.
Consumers prefer these stores because they can compare flavors, nutrition claims, pack sizes, prices, and ingredient labels before purchase. Cereal bars are also frequently bought as impulse snacks, especially when placed near checkout counters, breakfast aisles, health food sections, and snack displays.
The segment is expected to maintain a strong position as organized retail continues to expand. In-store promotions, private-label products, bulk packs, and better placement of health-focused snack options will continue to support sales through supermarkets and hypermarkets.
 iThe graph shows projected market growth until 2035 based on CAGR analysis. Actual outcomes may vary depending on changing demand, competition, and economic factors.To gain greater insights - request a sample report PDF
By Region
North America accounted for 50.3% share of the Cereal Bars Market, reaching USD 7.9 billion. The region’s leadership is supported by strong snack consumption, high health awareness, busy lifestyles, and wide availability of cereal bars across retail and online channels.
The United States and Canada are key contributors due to strong demand for energy bars, breakfast bars, granola bars, protein bars, and nutrition-focused snack products. Consumers in the region increasingly prefer convenient foods that support energy, weight management, fitness, and on-the-go breakfast needs.
North America is expected to maintain its leading position as brands continue to expand healthier cereal bar formats. Demand will remain supported by clean-label ingredients, higher protein content, low-sugar options, plant-based formulations, and strong distribution through supermarkets, convenience stores, gyms, and e-commerce platforms.
 iThe graph shows projected market growth until 2035 based on CAGR analysis. Actual outcomes may vary depending on changing demand, competition, and economic factors.To gain greater insights - request a sample report PDF
Regional Impact Analysis
North America leads the Cereal Bars Market with 50.3% share in 2026, valued at around USD 7.9 billion, supported by high snack consumption, busy lifestyles, strong packaged food brands, and wide retail distribution. The U.S. remains the largest contributor due to strong demand for breakfast bars, granola bars, protein bars, and better-for-you snack formats.
Europe remains important because of clean-label demand, organic food consumption, and strong grocery retail networks. Asia Pacific supports future growth through urbanization, rising disposable income, modern retail expansion, and increasing demand for convenient breakfast and snack products.
Impact Factor | Estimated CAGR Impact | Regional Relevance | Market Impact |
|---|---|---|---|
North America market leadership | +3.0% | North America, 50.3% share in 2026 | Leads global value demand. |
U.S. packaged snack consumption | +2.2% | U.S. | Drives regional sales volume. |
Canada health-focused snack demand | +1.5% | Canada | Supports better-for-you products. |
Europe clean-label cereal bar demand | +1.3% | UK, Germany, France, Italy | Adds premium product value. |
Asia Pacific urban snack growth | +1.2% | China, India, Japan, Australia | Builds future expansion. |
Healthier Snack Bars Gain Consumer Trust
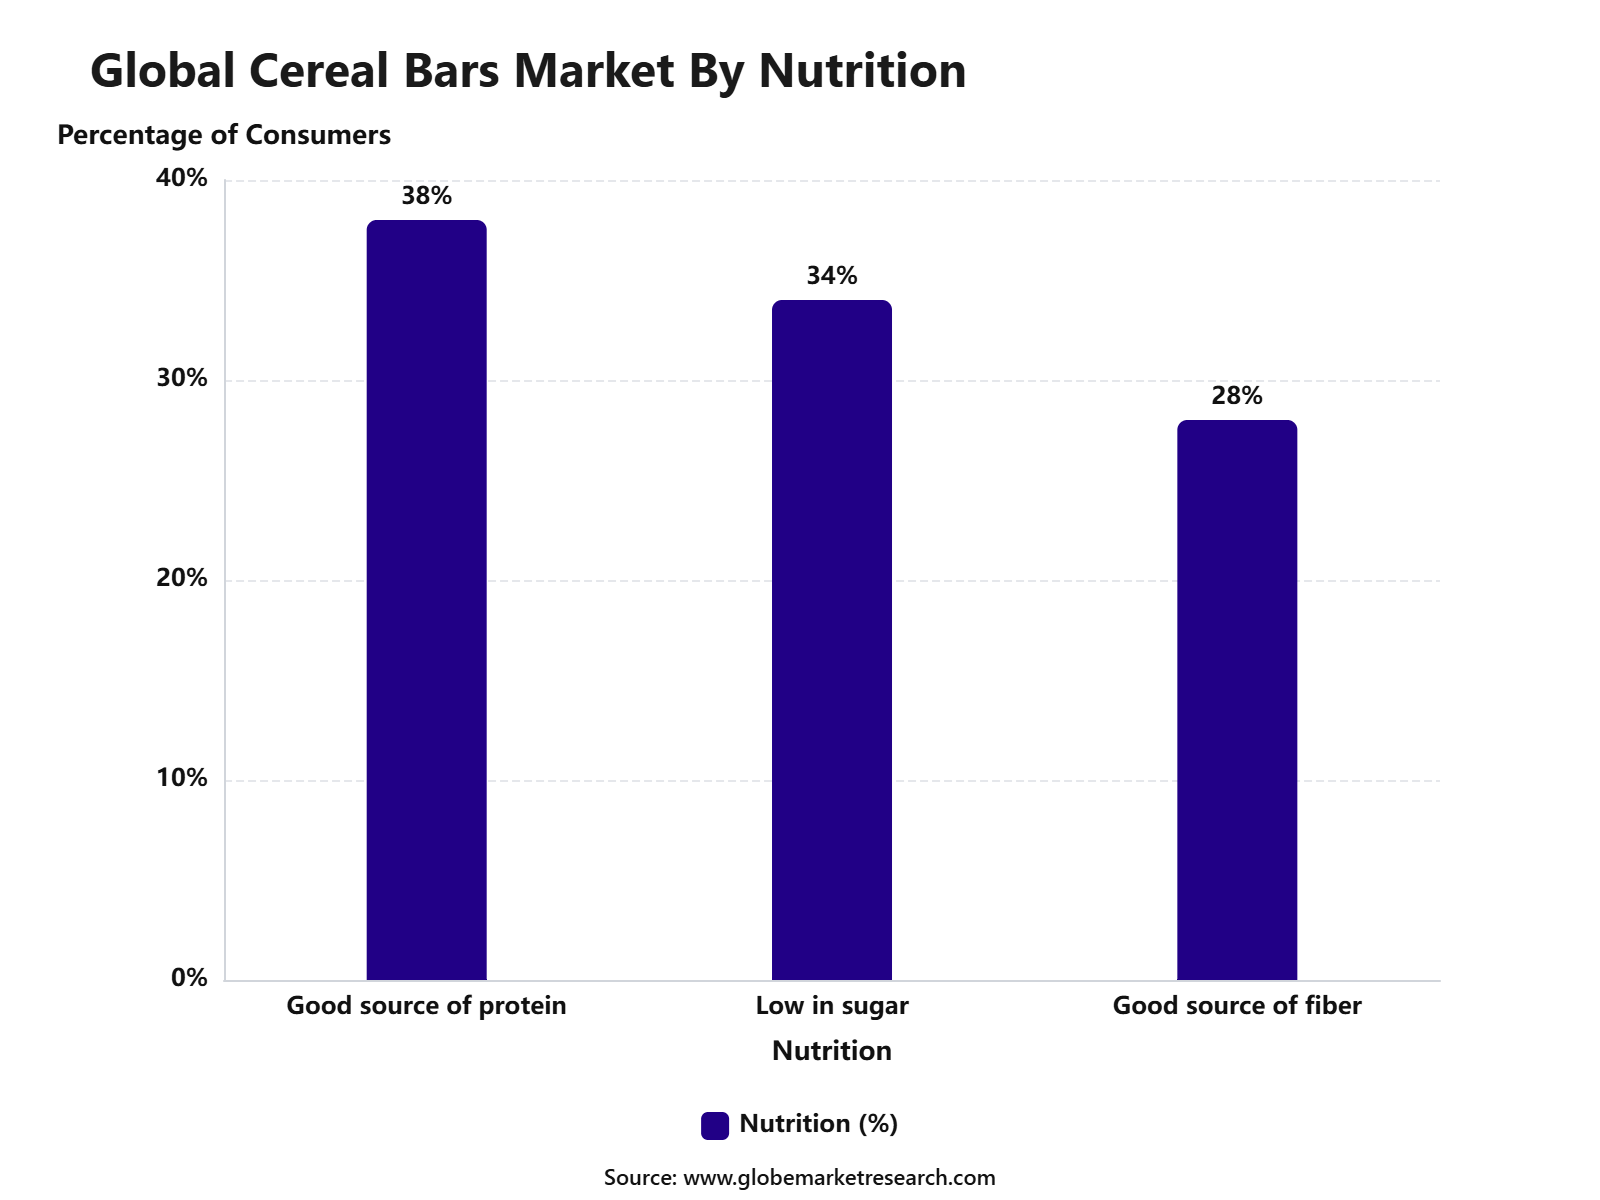
The most important factor in the Cereal Bars Market is the shift toward healthy, convenient snacking, especially bars with protein, fiber, low sugar, clean-label ingredients, and meal-replacement positioning. In 2025, IFIC reported that Americans defined healthy food mainly by “good source of protein” at 38%, “low in sugar” at 34%, and “good source of fiber” at 28%, which directly supports cereal bar reformulation around nutrition-led claims. In 2025, Glanbia also reported that two in five global consumers increased healthy snack consumption, while 56% consumed a healthy snack at least once daily.
For companies, the strongest growth path is to develop cereal bars that balance taste, nutrition, and label trust. Sugar control is especially important because the FDA’s 2026 Nutrition Facts guidance sets the Daily Value for added sugars at 50 grams per day and classifies 5% DV or less as low and 20% DV or more as high. This means brands should focus on low-sugar recipes, visible protein and fiber claims, whole-grain positioning, and transparent ingredient labels to win health-conscious snack buyers.
 iThe graph shows projected market growth until 2035 based on CAGR analysis. Actual outcomes may vary depending on changing demand, competition, and economic factors.To gain greater insights - request a sample report PDF
Go-To-Market and Sales Economics
Cereal bar producers should use a mixed channel strategy covering supermarkets, convenience stores, foodservice outlets, and direct online sales. U.S. retail e-commerce sales reached USD 302.3 billion in the first quarter of 2026, increasing 9.7% year over year and representing 16.8% of retail sales. Multipacks, subscriptions, and targeted digital promotions can improve repeat purchasing.
Regional expansion should be supported by local flavours, pack sizes, nutrition profiles, and affordable price points. Mondelēz generated USD 4.15 billion from emerging markets in the first quarter of 2026, with reported revenue increasing 11.4% and organic growth reaching 6.3%. Local manufacturing and distributor partnerships can reduce freight costs and improve product availability.
Convenience retail is an important route for single-serve cereal bars purchased during travel, work, and daily commuting. NACS reported that merchandise and foodservice represented 35.0% of average convenience-store sales and 57.4% of gross profit in 2025. Checkout placement, coffee pairings, promotional bundles, and frequent flavour rotation can strengthen sales per outlet.
Risk Factors & Market Barriers
Oat availability and pricing can affect production costs because oats remain a central ingredient in many cereal bars. U.S. oat stocks totalled 41.0 million bushels on March 1, 2026, down 3% from the previous year, while USDA raised the 2025/26 average farm-price estimate to USD 3.25 per bushel. Forward purchasing can reduce volatility.
Weak packaged-food demand and heavy promotional activity can pressure volume and margins. General Mills reported fiscal third-quarter 2026 net sales of USD 4.4 billion, down 8%, while organic sales decreased 3%. Producers should avoid excessive discounting and instead improve value through protein, fibre, portion control, cleaner labels, and clear product differentiation.
Nutrition and packaging rules can increase reformulation and compliance costs. FDA guidance updated in March 2026 recommends keeping added sugars below 10% of daily calories, equal to 50 grams on a 2,000-calorie diet. EU packaging rules generally apply from August 12, 2026, including recyclability requirements and limits affecting certain food-contact packaging materials.
Revenue Potential Analysis
Revenue Landscape Across
North America remains an important revenue base because cereal bars are widely sold through grocery, mass retail, convenience, and club channels. Mondelēz reported first-quarter 2026 North American revenue of USD 2.56 billion, with organic sales increasing 0.5%. Growth can be supported through value packs, high-protein formats, reduced-sugar variants, and stronger retailer category management.
Europe offers revenue through breakfast, lunchbox, sports, and on-the-go consumption, although consumer price sensitivity remains significant. Mondelēz generated USD 3.87 billion in European revenue during the first quarter of 2026, an increase of 9.0% on a reported basis. Manufacturers should balance premium natural products with competitively priced mainstream ranges and private-label production.
Foodservice and institutional channels provide additional revenue across schools, healthcare facilities, universities, hotels, workplaces, and transport locations. General Mills recorded USD 2.2 billion in North America Foodservice sales during fiscal 2026 and held or gained share in nearly 90% of its priority businesses. Individually wrapped bars can support portion control and convenient distribution.
Financial Impact
Margin performance depends on ingredient inflation, manufacturing efficiency, pricing, and product mix. Mondelēz reported first-quarter 2026 gross profit of USD 2.80 billion and a reported gross margin of 27.8%. Its adjusted gross margin was 30.7%, but declined 270 basis points as higher input costs and unfavourable volume mix exceeded pricing and productivity benefits.
Factory utilisation and cost control can materially change profitability during periods of uneven demand. General Mills reported fourth-quarter fiscal 2026 adjusted operating profit of USD 705 million, increasing 13% in constant currency, while adjusted operating margin rose 160 basis points to 15.3%. Producers should improve throughput, labour scheduling, maintenance, and packaging-line efficiency.
Cash generation determines how much can be invested in new flavours, protein formulations, packaging redesign, and production automation. Mondelēz expects approximately USD 3 billion of free cash flow in 2026, while forecasting organic revenue growth between flat and 2%. Investment should therefore be directed toward products with secured listings, repeat demand, and measurable contribution margins.
Drivers Impact Analysis
The Cereal Bars Market is driven by rising demand for convenient snacks, busy lifestyles, breakfast-on-the-go consumption, health-focused eating, and wider retail availability. Cereal bars are gaining demand among working consumers, students, fitness users, and households looking for portable food options.
North America leads the market due to strong snack culture, high retail penetration, demand for protein and fiber-rich bars, and strong presence of packaged food brands. The U.S. remains the main regional contributor because of large consumer demand for breakfast bars, granola bars, energy bars, and better-for-you snacks.
Impact Factor | Estimated CAGR Impact | Regional Relevance | Market Impact |
|---|---|---|---|
Rising on-the-go breakfast demand | +2.6% | North America, Europe, Asia Pacific | Drives regular cereal bar consumption. |
Growth in healthy snacking | +2.2% | U.S., Canada, Europe, Australia | Supports fiber, protein, and low-sugar bars. |
Strong retail and e-commerce availability | +1.8% | North America and developed markets | Improves product reach. |
Demand from fitness and active consumers | +1.5% | Urban and health-focused markets | Adds functional snack demand. |
Product innovation in flavors and nutrition | +1.2% | Global packaged food markets | Supports repeat purchases. |
Restraints Impact Analysis
The market faces restraints from high competition, sugar content concerns, clean-label pressure, and price sensitivity among mass-market consumers. Many cereal bars are compared with protein bars, snack bars, biscuits, breakfast cereals, and fresh snack alternatives.
Another restraint is ingredient cost volatility. Oats, nuts, fruits, chocolate, sweeteners, protein ingredients, and packaging materials can affect production cost and retail pricing.
Impact Factor | Estimated CAGR Impact | Regional Relevance | Market Impact |
|---|---|---|---|
High competition from snack alternatives | -1.3% | Global snack markets | Limits faster category growth. |
Sugar and calorie concerns | -1.1% | North America and Europe | Pressures reformulation. |
Ingredient cost volatility | -0.9% | Global packaged food producers | Affects margins. |
Price sensitivity in mass retail | -0.7% | Emerging and value markets | Limits premium adoption. |
Clean-label formulation challenges | -0.6% | Health-focused consumers | Raises product development needs. |
Opportunities Impact Analysis
Opportunities are strong in protein cereal bars, high-fiber bars, low-sugar bars, gluten-free bars, organic bars, plant-based bars, kids’ nutrition bars, and meal-replacement snack formats. These product types benefit from changing consumer demand for convenient and healthier snack choices.
Higher-value opportunities are emerging in functional ingredients, gut health claims, energy-support formulas, nut and seed-based bars, and personalized nutrition packs. Brands that combine taste, nutrition, clean labeling, and affordable pricing can capture stronger demand.
Impact Factor | Estimated CAGR Impact | Regional Relevance | Market Impact |
|---|---|---|---|
Protein-enriched cereal bars | +2.5% | North America, Europe, Asia Pacific | Builds premium growth. |
Low-sugar and high-fiber products | +2.1% | Health-conscious markets | Supports better-for-you positioning. |
Gluten-free and organic bars | +1.7% | U.S., Canada, Europe | Adds specialized demand. |
Plant-based cereal bars | +1.4% | Urban and vegan-friendly markets | Expands consumer base. |
Kids’ nutrition and lunchbox bars | +1.1% | Household and school snack markets | Adds family-focused growth. |
Challenges Impact Analysis
The main challenge is delivering strong taste while meeting health-focused expectations. Consumers want bars that are convenient and enjoyable, but they also check sugar levels, artificial ingredients, calories, protein, fiber, and allergen content.
Another challenge is managing shelf stability and texture. Cereal bars need to remain fresh, chewy, crunchy, and visually appealing across storage, transport, and retail display conditions.
Impact Factor | Estimated CAGR Impact | Regional Relevance | Market Impact |
|---|---|---|---|
Balancing taste and nutrition | -1.2% | Global consumer markets | Affects repeat purchase. |
Maintaining texture and freshness | -1.0% | Packaged snack manufacturers | Influences product quality. |
Allergen management | -0.8% | Nut, dairy, gluten, soy formulations | Adds compliance needs. |
Retail shelf competition | -0.7% | Supermarkets and convenience stores | Limits brand visibility. |
Short innovation cycles | -0.5% | Branded snack companies | Requires constant product renewal. |
Segment Covered in the Report
By Product Type
Energy & Nutrition Bars
Granola Bars
Breakfast Bars
Others
By Distribution Channel
Supermarkets/Hypermarkets
Convenience Stores
Online Retail
Specialty Stores
Others
By Region
North America
Europe
Asia Pacific
Latin America
Middle East and Africa
Market Trend Analysis
The market trend is moving toward protein-rich cereal bars, low-sugar recipes, whole-grain ingredients, natural sweeteners, plant-based formulas, and clean-label snacks. Consumers are choosing cereal bars not only as breakfast substitutes but also as mid-day snacks and travel-friendly food products.
North America remains the largest value region because of mature snack consumption, strong brand presence, and high demand for functional and convenient foods. Europe supports premium clean-label growth, while Asia Pacific is expanding through urbanization and modern retail growth.
Impact Factor | Estimated CAGR Impact | Regional Relevance | Market Impact |
|---|---|---|---|
High-protein cereal bar trend | +2.4% | North America, Europe | Supports premium product demand. |
Clean-label ingredient demand | +2.0% | U.S., Canada, Europe | Improves consumer trust. |
Whole-grain and fiber claims rise | +1.6% | Health-focused snack markets | Strengthens nutrition positioning. |
Plant-based snacking expands | +1.3% | Urban global consumers | Adds new product variety. |
Multipack and portion-controlled formats grow | +1.0% | Retail and household channels | Supports everyday consumption. |
Investor Type Impact Matrix
Investors should focus on companies with strong retail distribution, clean-label formulation capability, product innovation, brand loyalty, and exposure to health-focused snack categories. Taste, nutrition, pricing, and shelf visibility are key success factors.
Strategic investors can also target cereal bar brands, private-label manufacturers, ingredient suppliers, protein ingredient companies, sustainable packaging firms, and online snack platforms. Companies that combine convenience, nutrition, and strong channel access are better positioned for long-term growth.
Investor Type | Estimated CAGR Impact | Regional Relevance | Market Impact |
|---|---|---|---|
Cereal Bar Manufacturers | +2.0% | Global | Expands packaged snack supply. |
Functional Snack Brands | +1.7% | North America, Europe, Asia Pacific | Supports health-focused demand. |
Private-Label Snack Producers | +1.3% | Retail-driven markets | Builds value segment growth. |
Ingredient and Protein Suppliers | +1.1% | Snack manufacturing supply chains | Supports nutrition innovation. |
Strategic Consumer Food Investors | +0.9% | Global snack markets | Funds brand and channel expansion. |
Recent Developments
In March 2026, Quest Nutrition launched Stacks protein bars alongside new crispy protein snacks, using athlete partnerships and an original digital series to support high-protein product innovation and consumer engagement.
In February 2026, Mondelēz reported expansion of Perfect Bar assortments and wider distribution for high-protein, low-sugar Clif Builders and Grenade bars, supporting its investment in better-for-you and protein snacking categories.
In February 2026, Hain Celestial agreed to sell its North American Snacks business to Snackruptors for USD 115 million, simplifying its portfolio and directing resources toward higher-margin core product categories.
In January 2025, ALOHA returned its plant-based protein bars to Target after seven years, expanding retail distribution and using the relaunch to strengthen consumer access within the better-for-you snack-bar category.
Competitive Landscape
The market is characterized by intense competition among established players and emerging companies. Strategic partnerships, mergers and acquisitions, and product innovation are key strategies employed by market participants.
Key Market Players
General Mills
Kellogg Company
Clif Bar & Company
Nature Valley
KIND LLC
Nestlé S.A.
Mars Incorporated
PepsiCo
Mondelez International
Post Holdings
Hero Group
Bobo’s
Atkins Nutritionals
RXBAR
The Hain Celestial Group
Other Key Players
Research Methodology
This market study is prepared using a combination of primary and secondary research. Primary research includes discussions with manufacturers, suppliers, distributors, consultants, industry experts, and end users. Secondary research covers company reports, government databases, trade associations, technical publications, regulatory sources, and trusted industry documents. The collected information is used to assess market demand, pricing trends, technology adoption, competitive activity, and regional performance.
AI language models are not used as primary data sources, and publicly available AI-generated content is not treated as market evidence. Computational tools may be used to support data processing, translation, data classification, and pattern identification. However, every published assessment is supported by verified sources, human review, and primary market discussions.
Market estimates are developed through top-down and bottom-up approaches and validated using data triangulation. Revenue, production, shipment, pricing, and application-level data are compared across multiple sources. Forecasts consider economic conditions, regulatory changes, investment activity, innovation, supply chain developments, and industry risks. All findings are reviewed through source verification and internal quality checks before publication.
Part I
Source Management & Input Data Standards
Who provides data, how sources are qualified, and what types of evidence are admissible.
Part II
Research Scope & Market Coverage
How we define the markets we assess and the parameters that govern each product.
Part III
Data Collection, Verification & Submission
The mechanics of gathering, cross-checking, and hierarchically ranking evidence.
Part IV
Assessment Determination & Quality Controls
How raw data becomes a published assessment — normalisation, expert judgement, and outlier exclusion.
Part V
Publication, Corrections & Revision
Our publication schedule, corrections policy, and methodology review cycle.
Part VI
Independence, Ethics & Complaints
Conflict-of-interest policies, editorial independence, and how clients raise concerns.
Google · Preferred Sources
Don't miss the latest market research insights and industry updates on Google.
Add Globe Market Research as a preferred source in the Google app to see our reports, analysis, and market stories in your news suggestions.
Meet the Team
This report was prepared by our expert analysts with deep industry knowledge and research experience.
Pratiksha K. is a Senior Research Analyst with more than five years of experience in market research, industry analysis, competitive intelligence, and business strategy. She has contributed to detailed market reports, customized research studies, company profiling, market sizing, trend analysis, and strategic consulting projects for clients across different regions. Her industry expertise covers Chemical and Material, Consumer Goods, Food & Beverages and Energy & Power. She closely evaluates changing customer requirements, technology developments, regulatory conditions, supply chain structures, investment activity, and competitive strategies to provide clear and practical market insights.
Sayali brings more than 7 years of experience to Globe Market Research, supporting the accuracy, clarity, and relevance of research content across multiple industries. She reviews market data, segment analysis, competitive insights, and industry trends to ensure each report meets strong quality standards and provides practical value to business decision-makers. Her expertise spans healthcare, information technology, consumer goods, and diverse cross-industry domains. With a strong focus on data reliability, structured analysis, and clear presentation, Sayali helps ensure that each research output delivers well-reviewed insights for clients, investors, consultants, and industry stakeholders.
Frequently Asked Questions
Related Reports
More in Food and Beverages
Food Colorants Market to Hit USD 8.6 Billion by 2035
Food Colorants Market Size, Share, Analysis By Type (Natural, Synthetic, Nature-Identical), By Form (Powder, Liquid, Gel), By Application (Beverages, Bakery and Confectionery, Dairy, Meat Products, Snacks, Other Applications), By Regional Insights, Business plan and Project Report, Investment Opportunities, Profitability, Industry Trends, Leading Companies and Growth Forecasts by 2026-2035
Sweeteners Market to Hit USD 145.7 Billion by 2035
Sweeteners Market Size, Share, Analysis "By Product (Sucrose, High-Fructose Corn Syrup, Glucose Syrup, High-Intensity Sweeteners, Other Products), By Form (Solid, Liquid), By Application (Bakery and Confectionery, Beverages, Dairy, Pharmaceuticals, Other Applications), By Regional Insights, Business plan and Project Report, Investment Opportunities, Profitability, Industry Trends, Leading Companies and Growth Forecasts by 2026-2035
Food Enzymes Market to Hit USD 7.5 Billion by 2035
Food Enzymes Market Size, Share, Analysis By Type (Carbohydrases, Proteases, Lipases, Other Enzymes), By Source (Microbial, Plant, Animal), By Application (Dairy Processing, Bakery, Beverages, Processed Foods, Animal Feed), By Regional Insights, Business plan and Project Report, Investment Opportunities, Profitability, Industry Trends, Leading Companies and Growth Forecasts by 2026-2035
Food Preservatives Market to Hit USD 8.0 Billion by 2035
Food Preservatives Market Size, Share, Analysis By Source (Natural, Synthetic), By Function (Antimicrobial, Antioxidant, Other Functions), By Application (Meat, Poultry and Seafood, Bakery, Dairy, Beverages, Snacks, Other Applications), By Regional Insights, Business plan and Project Report, Investment Opportunities, Profitability, Industry Trends, Leading Companies and Growth Forecasts by 2026-2035